-
-

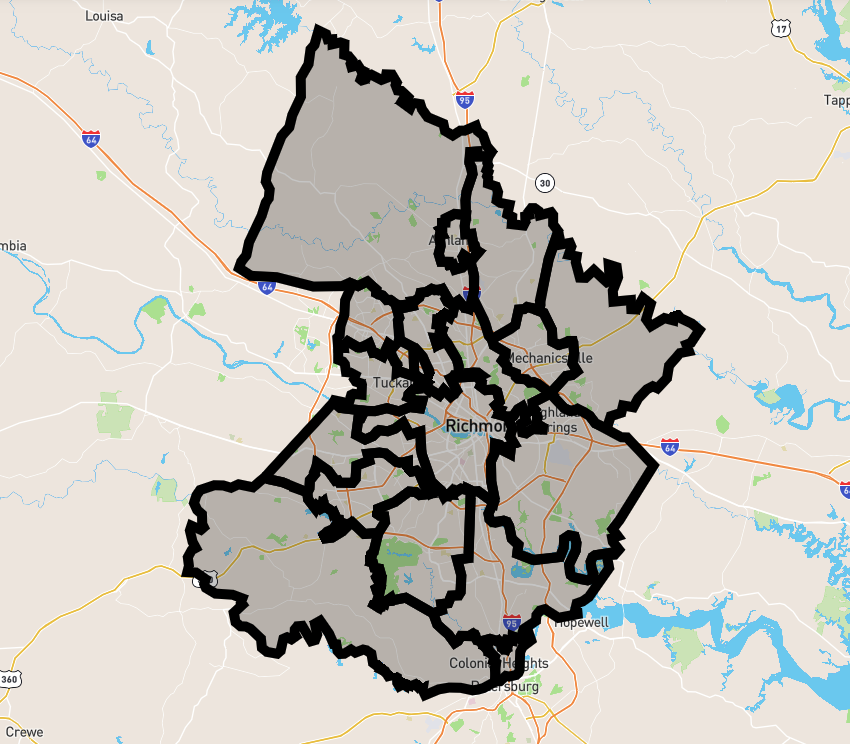
Regional Map Layer in Mapbox
-

Admin Registration
-

Volunteer Registration Form
-

Interaction Model


Inspiration
Our communities have been greatly impacted by the COVID-19 virus, as well as the related economic fallout. How do we look out for one another at this time.
What it does
Managing a community response during a pandemic requires tools that inform and educate. Maps have done this across centuries, and we now have amazing digital tools that can do this with the click of a few buttons. Here's how our community is responding to the crisis, and hope others can leverage these tools to build their own applications to help inform and mobilize their communities.
How I built it
The volunteer form connects to a g-sheet. The non-profit that we were working with already had a basic static website hosted by Squarespace. Were able to get a form page setup that could serve to sign-up volunteers and directly load into a g-sheet. This page was then linked to their main website, and shared on multiple social media channels.
Most of the work is in building the interactive map. Here are the steps.
Step 1 - Source the Data
The greater Richmond metro area has more than one million people living in it, and is spread across several hundred square miles of land mass. Mapping all of this data by hand would take years, but fortunately this information already existed - just was a matter of finding out where. Our research showed that the local municipalities have GIS departments that have already built digital maps for other purposes, and publish it as public data. This data can be downloaded, and then used in other projects. I downloaded the data for all four municipalities in our region that we wanted to get block level data for, so this enabled moving forward with the new approach of building a regional map of all of the residential blocks that could be adopted.
Step 2 - Convert Street Data to GeoJSON
While I was able to get versions of data, a consistent theme was that the datasets were in a different format than what was needed in Mapbox. KML data is the common format that was found in the GIS departments, however what's needed is geojson. That requires conversion. Also these downloaded files are quite large - in the 10-100MB range, and given that we're eventually going to need to use API's to load this data, I needed to keep the size manageable. I used an online utility to convert the KML structures to a more common csv format (see link below), then created multiple shards that broke the files into something easier to manage (approximately 5-10MB each shard).
https://www.convertcsv.com/xml-to-csv.htm
Step 3 - Filter and Enrich the Data
Next was a step to reduce the dataset for just the information we needed. This would help in the usability as well as the performance of the application. This application just needed residential streets. The maps that we received from the municipalities is used for street maintenance, so includes things like highways and overpasses were removed. This was done through a data filtering process written as a lambda function in AWS that could process data staged in S3 buckets.
The interactive map also needed to be seeded with attributes for each block. That makes rendering the maps easier within Mapbox. To accomplish this, there's a boolean that indicates if the block has been adopted, as well as who has adopted it. These attributes were added to the filtered data in the previous step, continuing to use a json format.
Step 4 - Load Data into Mapbox
To create the map that would be rendered by a browser, I needed to import the data into Mapbox into unique datasets. This can be done either by API or by the Studio interface, and I chose the later. There are limits on how large of an upload file can be processed at once, so the file sizes needed to be practical. This was done for all four data sets processed in the prior step.
Step 5 - Build a View of the Map Data
Once the data is loaded into Mapbox, tilesets need to be created that reflect each of the different groups of street data. These tilesets are what the browser renders within the map as a layer that the user can interact with, and are also referenced in the SDK within the browser code. Each layer has its own attributes - color, font size, line width, etc. This is all done within Mapbox studio and is called a style.
Step 6 - Add Region Layer to make Map Usable
An unexpected scope that I needed to add was a summary layer to the maps that we refer to as the regional layer. The underlying datasets in the prior steps totaled 100k city blocks (features), so when attempting to display them all at once, the user experience is terrible as it just turns into a big blob of a single color as all of the streets blend together.
To address this, I created a summary view of the region that was usable when trying to take the whole thing in. This was done by creating a dataset using Mapbox studio that outlined the regions. The starting point for the map is then zoomed out at this level which shows the broader area.
There is javascript embedded within the webpage that allows the user to click on one of the regions, then it zooms into that region. From there a more user friendly version of the map can be clicked on.
Step 7 - Build an API that can update the Map
Mapbox already has API's that can manage updates. To call the API, will need the unique identifier of the feature that is to be updated. Given that Mapbox sets that unique identifier, will need to extract the maps from Mapbox after they are loaded, and build a lookup utility that serves as a wrapper before the API is called that can apply the unique identifier. This was written in NodeJS, and hosted in AWS.
Step 8 - Integrate API into Digital Map
Once we have the API working, then integrate it into our. I built a simple AngularJS web app that then calls the API to assign a block to an individual volunteer. This enables multiple individuals to directly update the map, enabling the project to scale up.
Challenges I ran into
How to deal with adjusting large datasets, and inconsistencies across the four municipalities. There doesn't appear to be a data standard for each map, but ultimately they needed to have the same data to work within the Mapbox application.
Accomplishments that I'm proud of
We were able to get more a thousand blocks volunteered as part of this work.
What I learned
How to build an application in Mapbox.
What's next for Mobilize the Community with Digital Maps
Continue to support making the map more interactive, and easier to report on the data that is in geojson format.


Log in or sign up for Devpost to join the conversation.