Inspiration The T-Mobile hackathon challenged us to build a system that streams live sentiment data. We built a system that streams live feedback and network data to detect issues before they spread, turning customer emotion into actionable insight through data engineering, APIs, and AI-powered analytics.
What it does T-no is the T-Mobile Customer satisfaction Index - transforming customer emotion into actionable intelligence:
Pain Index (0-10) - Quantifies customer satisfaction by analyzing sentiment, outage severity, and geographic impact Real-time sentiment analysis from customer complaints across different issue types Geographic hotspot mapping showing which cities are most affected Multi-provider comparison across 9 major carriers with competitive benchmarking AI-powered recommendations and critical insights for internal teams Proactive issue detection that identifies problems before they spread Interactive visualizations through charts, heatmaps, and trend analysis
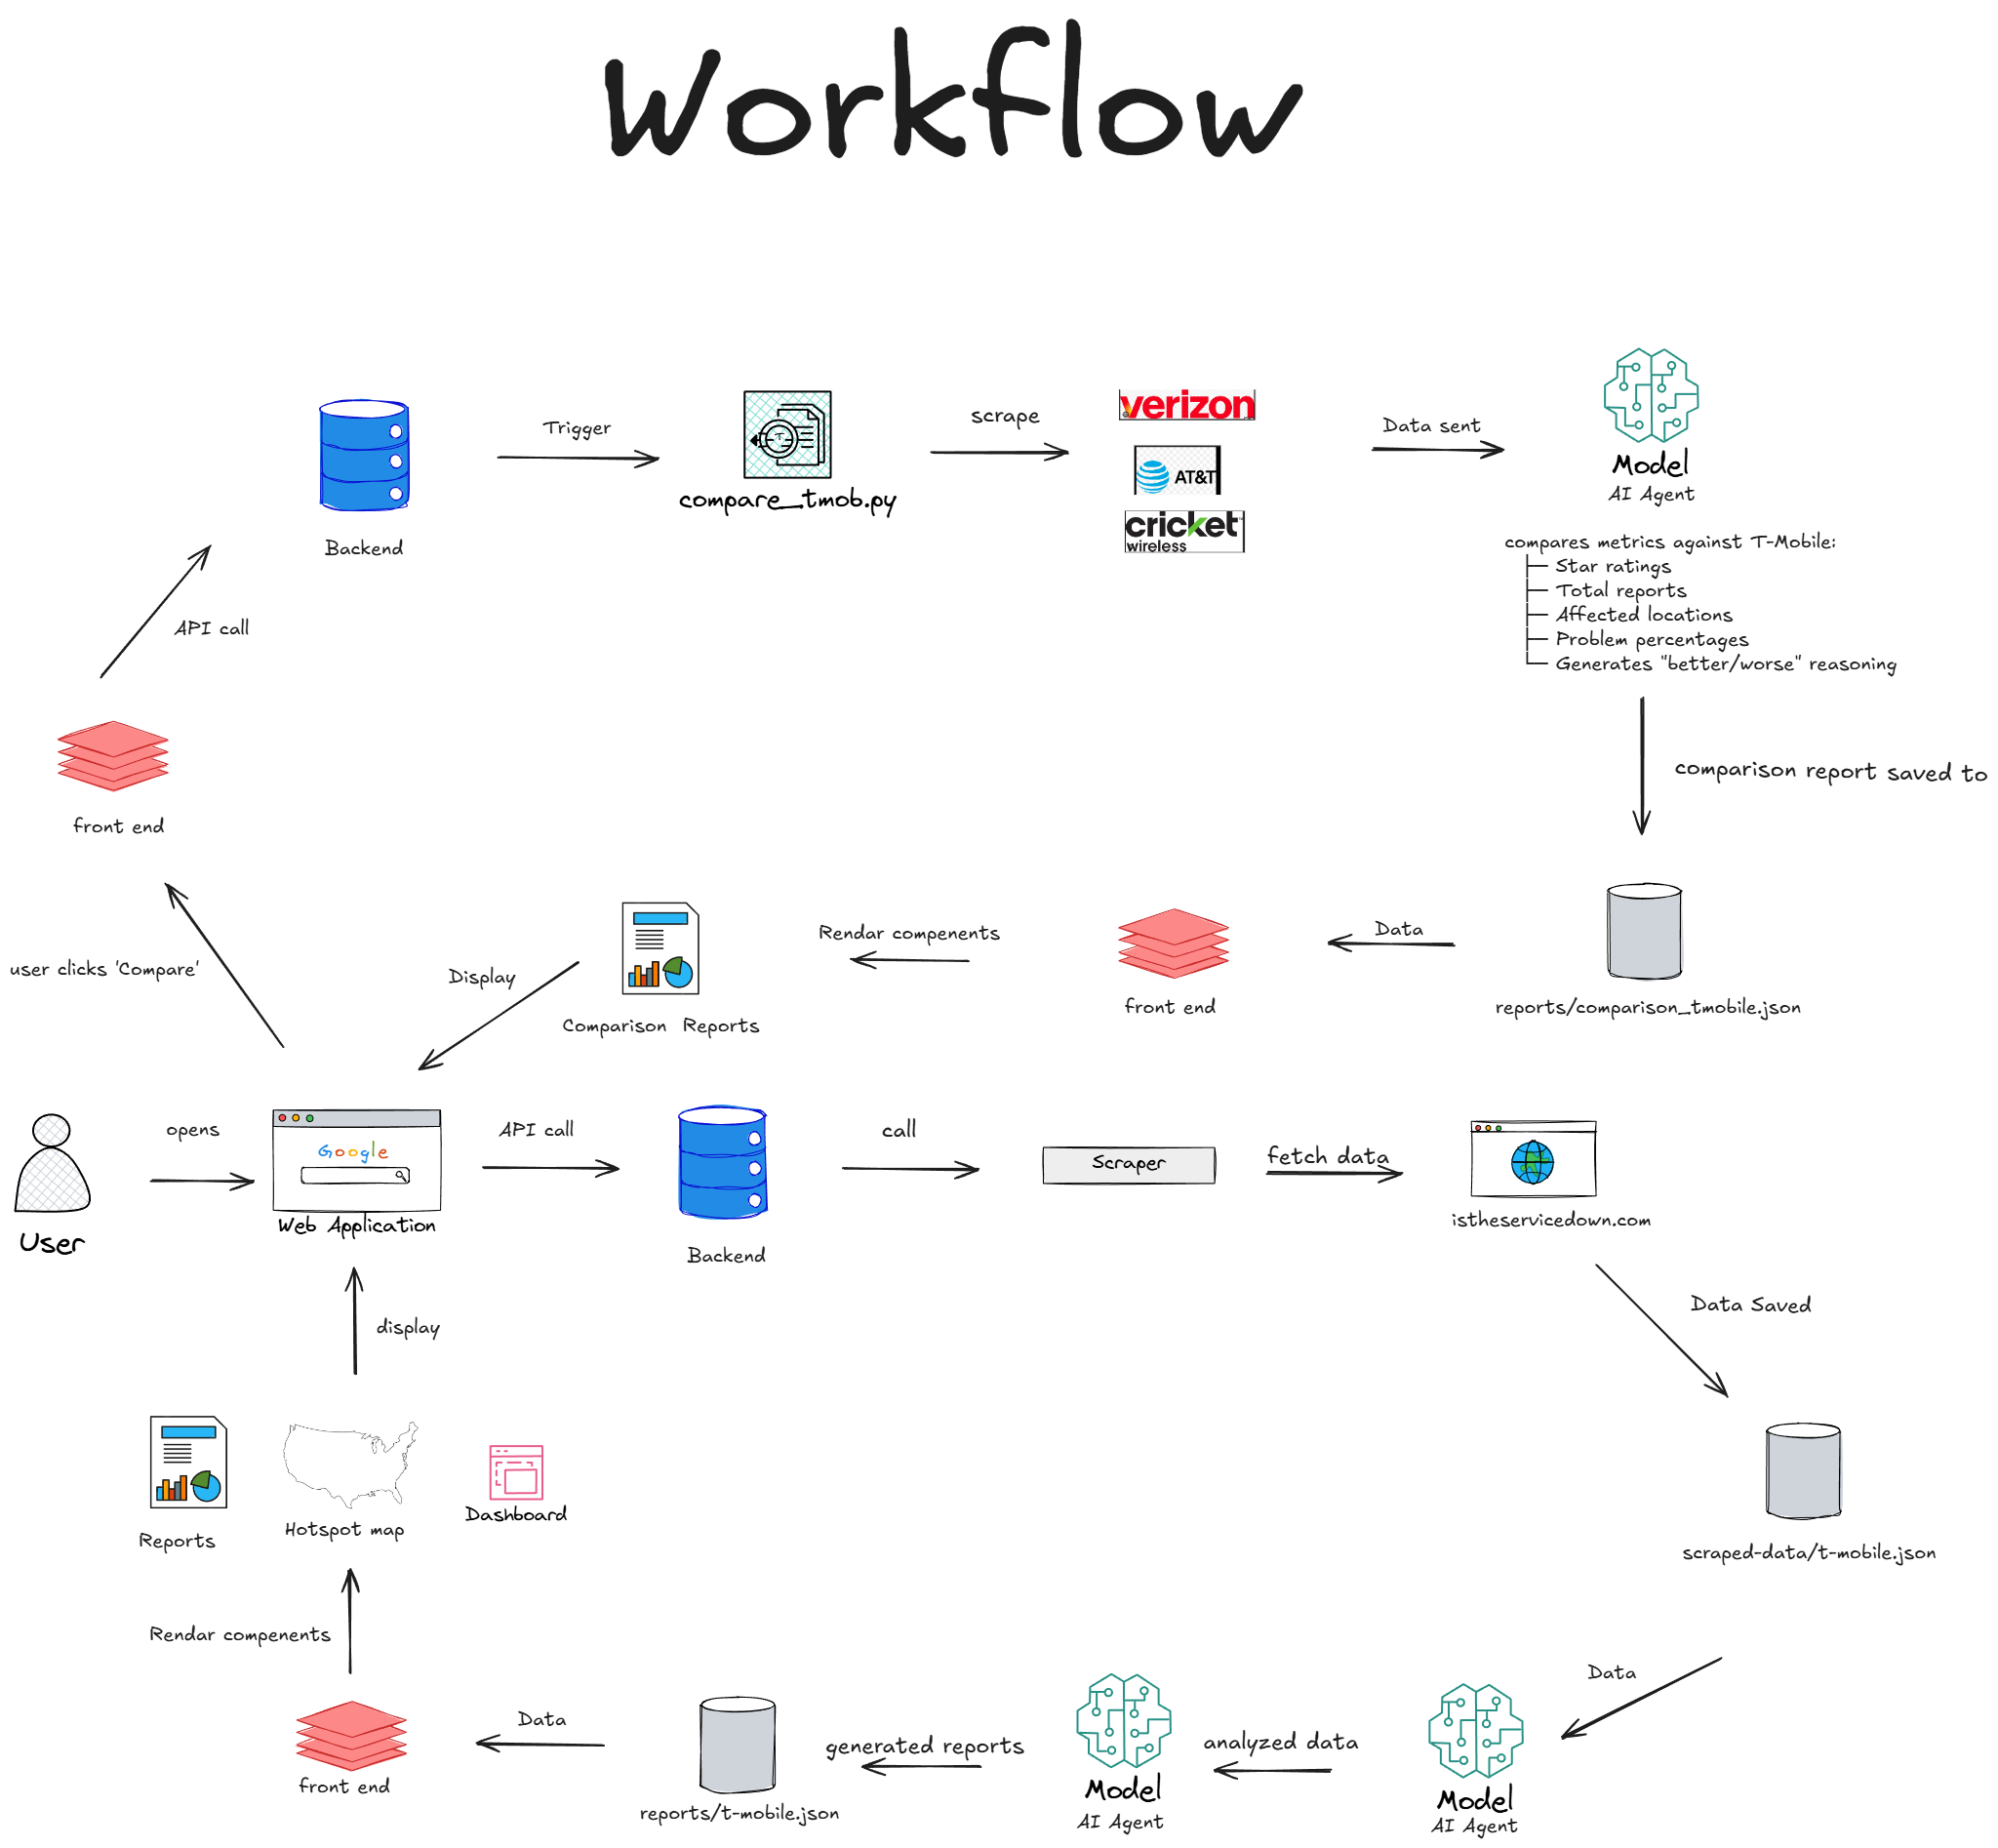
How we built it Frontend: React + TypeScript + Vite with Tailwind CSS, , Recharts, and React Simple Maps Backend: Python FastAPI server with 7 REST endpoints, Crawl4AI/BeautifulSoup for web scraping, async processing with rate limiting. AI Integration: NVIDIA Nemotron Multi-step workflow: scrape → image analysis → insight generation → reporting NVIDIA Nemotron Vision Model analyzes outage charts and graphs OpenAI GPT-4 structures data and generates recommendations Goes beyond a chatbot, it is a complex agent system with tool integration solving real telecommunications challenges
Pipeline: Automated workflow that scrapes live data → uses Nemotron for visual analysis → employs GPT-4 for structured reports → calculates pain indices → generates actionable insights Challenges we ran into Cloudflare Protection: Overcame scraping blocks by implementing cloudscraper with custom headers and rate limiting AI Prompt Engineering: Getting consistent JSON output without hallucinations required extensive prompt refinement with strict validation rules Async Coordination: Synchronizing scraping → analysis → comparison pipeline across 9 providers while maintaining data consistency Data Accuracy: Ensuring pain index and sentiment calculations were mathematically sound across varied data patterns
Accomplishments that we're proud of We built complete Customer satisfaction Index meeting T-Mobile challenge requirements and Integrated NVIDIA Nemotron in multi-step workflows meeting NVIDIA challenge criteria Scraped and analyzed data from 9 major telecom providers Created production-ready FastAPI server with 7 REST endpoints Developed unique pain index metric quantifying customer satisfaction Built responsive dashboard with real-time visualizations Achieved sub-second load times through efficient data caching
What we learned Multi-Modal AI: Orchestrating NVIDIA Nemotron for visual analysis and GPT-4 for structured data generation Agentic Workflows: Building complex multi-step systems where AI agents plan and execute tasks autonomously Full-Stack Integration: Connecting React frontends with Python backends, managing CORS, and designing REST APIs Async Python: Mastering asyncio, aiohttp, and concurrent processing for scalable web scraping Web Scraping at Scale: Cloudflare bypass techniques, rate limiting, and responsible data collection System Design: Architecting maintainable pipelines that separate concerns (scraping, analysis, visualization)
What's next for T-Mo Predictive Analytics - ML models to predict outages before they happen Mobile App - Native iOS/Android with push notifications for outage alerts International Coverage - Expand to carriers beyond the U.S. Alert System - Real-time notifications for user-specified locations Historical Trends - Time-series data showing patterns over months/years AI Chatbot - Answer questions like "Is T-Mobile down in Dallas?" Live Dashboard - WebSocket connections for true real-time updates
Built With
- beautiful-soup
- fastapi
- nemotron
- openai
- python
- react
- tailwind
- typescript


Log in or sign up for Devpost to join the conversation.