-
-
Logos
-
-
-
-
-
Inspiration
For people waiting at a public transport stop, reliability matters more than the timetable: will the bus come, when will it arrive, and how long will the trip take? Lisbon's metropolitan area has a lot of open data, including live vehicle positions, GTFS schedules and Navegante validations. But no single view turns that data into a clear answer on how reliable the service actually is, or why it goes wrong. We wanted to build a tool that answers both questions for any operator and any area of the AML.
What it does
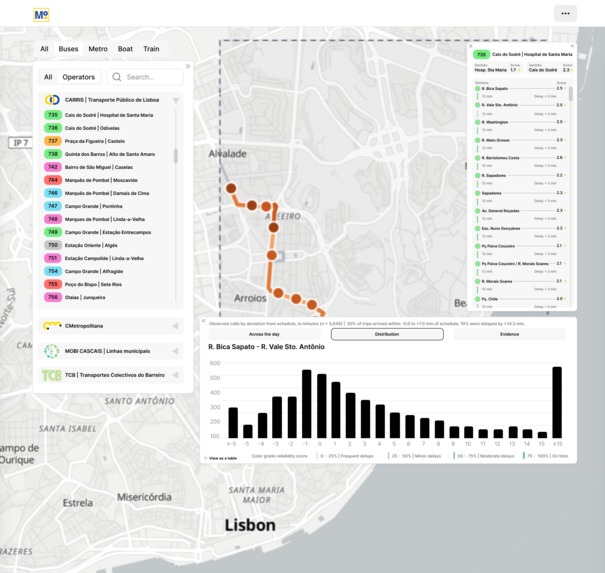
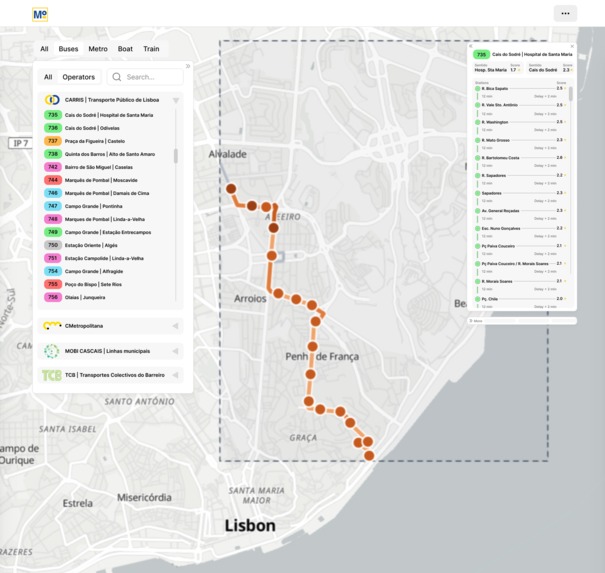
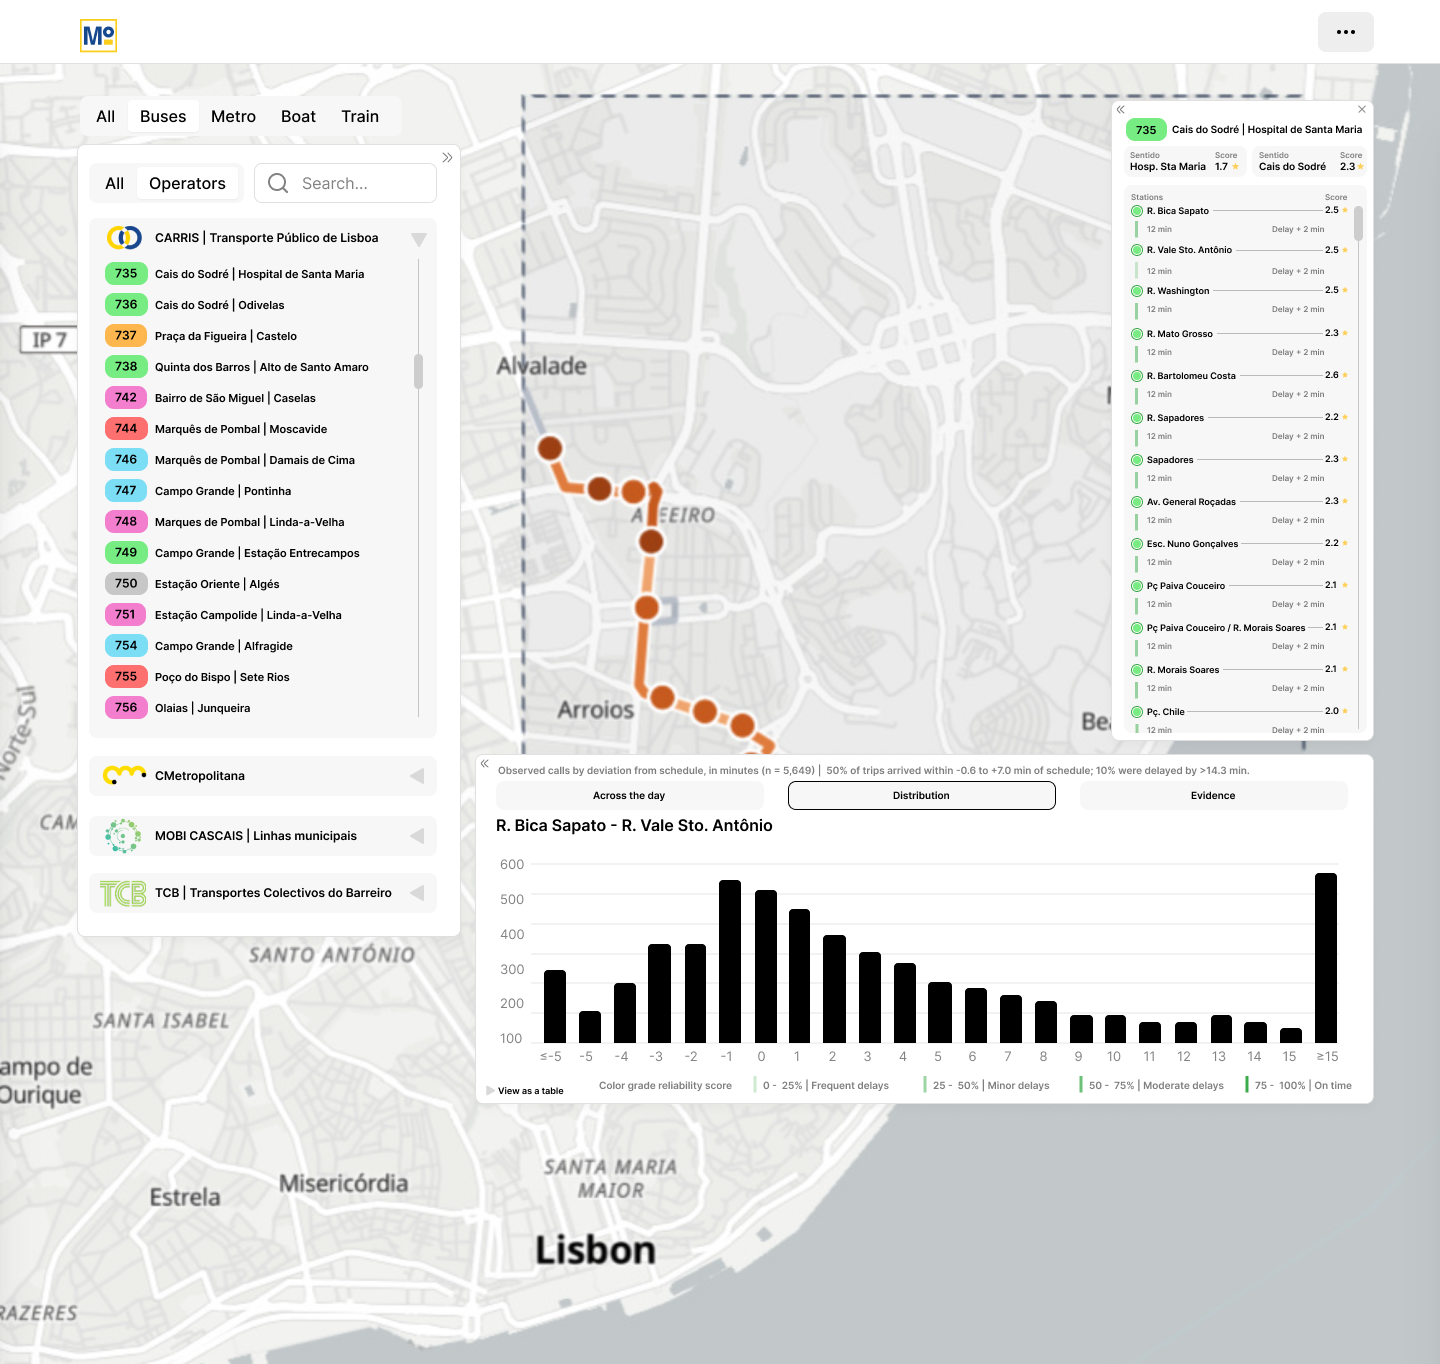
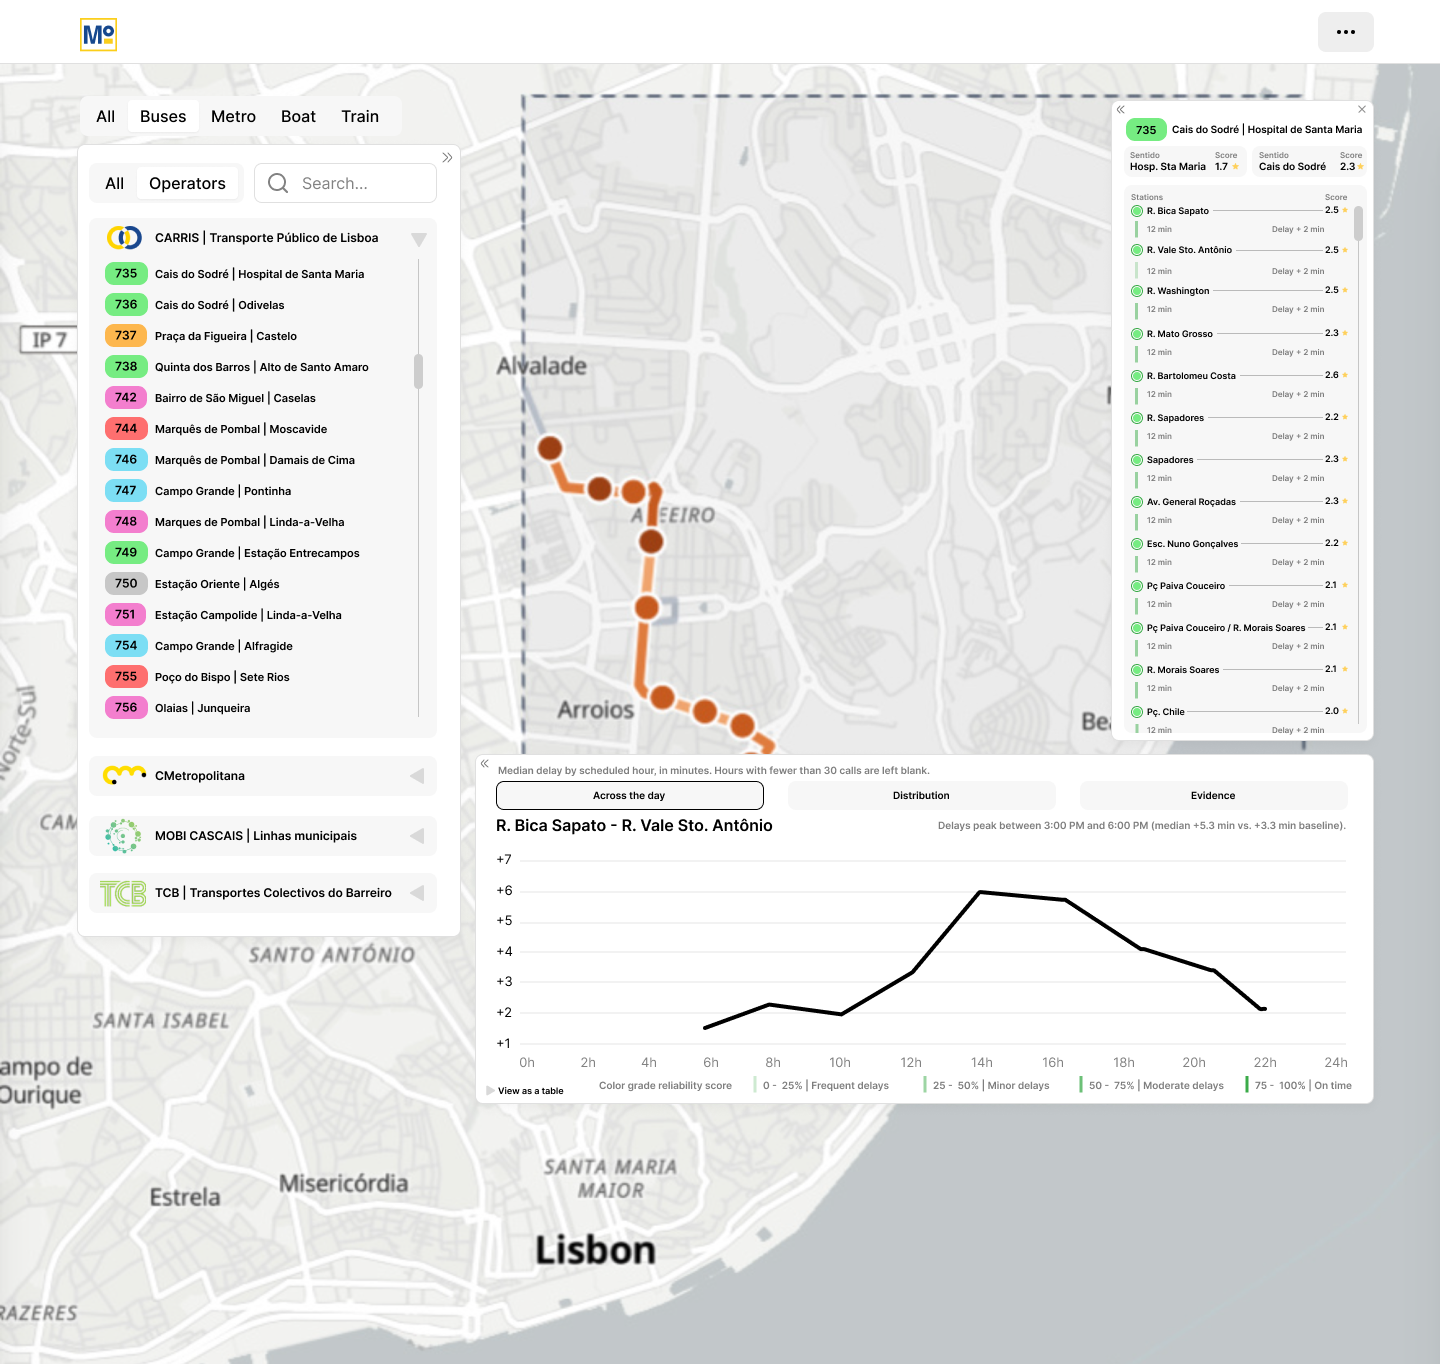
Mobi4U is a dashboard that scores public-transport reliability across the Lisbon Metropolitan Area, for every operator and every mode. It combines four dimensions into a single Service Reliability Index (0–100):
Punctuality: the share of stop arrivals within a mode-specific on-time window. Completion: the share of scheduled trips that actually ran. It is shown only when data coverage is high enough, so a missing feed is never counted as cancelled service. Regularity: Excess Waiting Time, the extra minutes passengers wait beyond what the schedule promises. Journey-time reliability: the Buffer Time Index and a Congestion Index per road segment.
The weights change automatically with service frequency. On high-frequency lines, regularity matters most. On low-frequency lines, punctuality matters most.
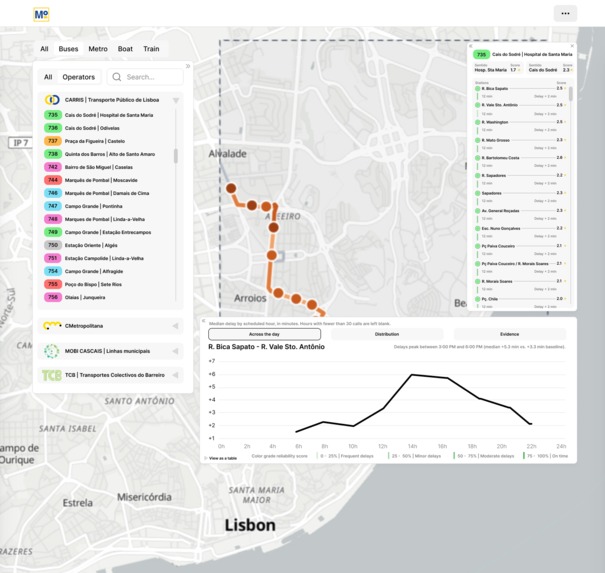
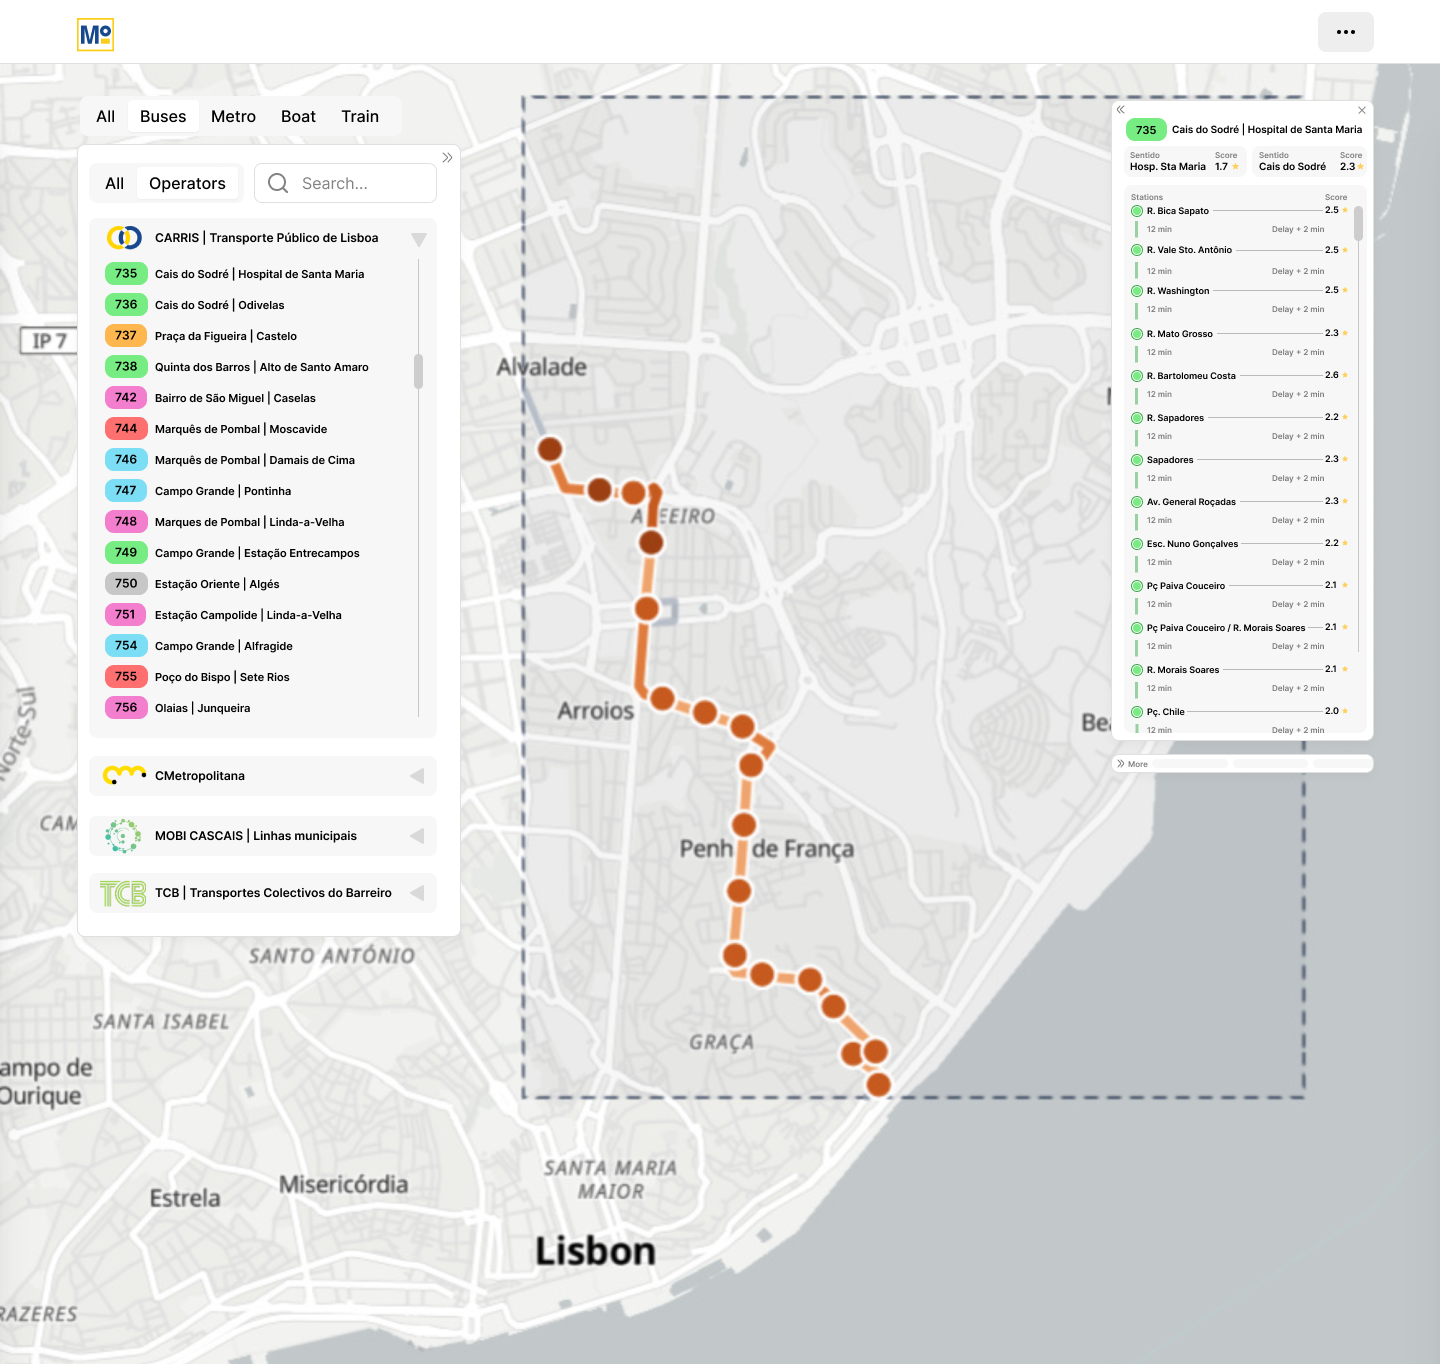
Mobi4U also explains the causes of delay. A rule-based model splits each delay into four causes: demand (long dwells at busy stops), congestion (slow running between stops), late starts, or mixed. Results can be viewed by line, stop, segment, corridor, municipality and time of day.
How we built it
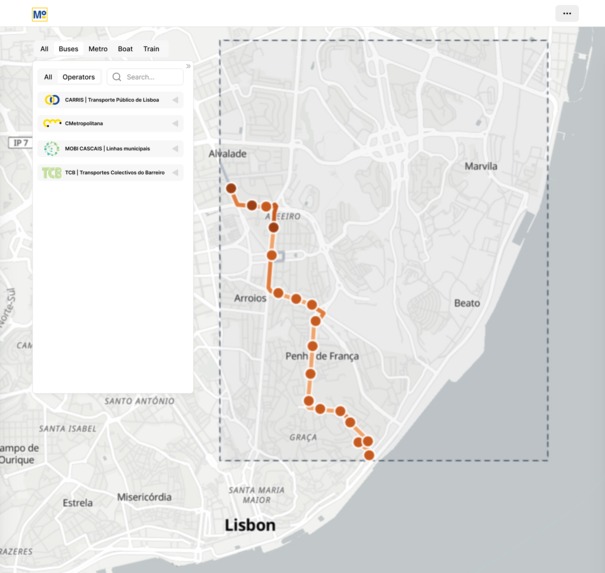
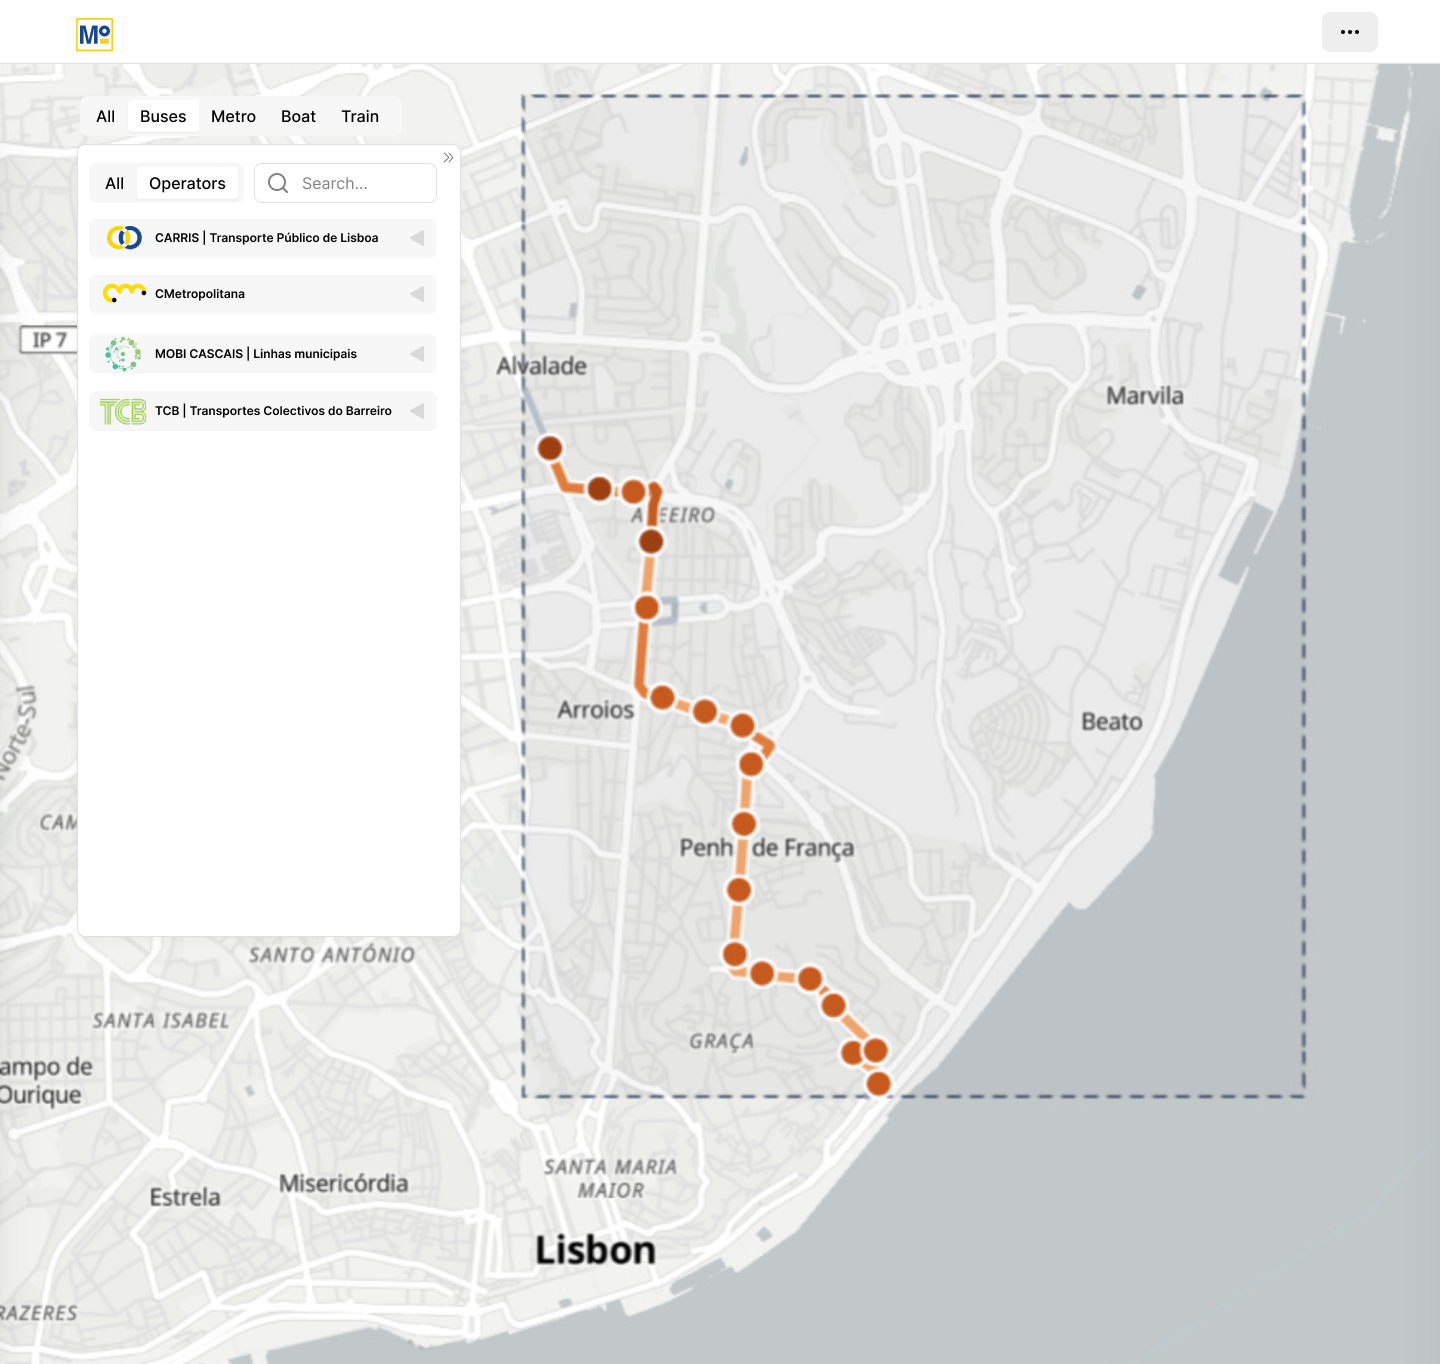
We used TML's GTFS-RT vehicle positions, the GTFS static feeds and Navegante validations for 31 August to 6 September 2026. We piloted the method on geohash eycs2 (Areeiro, Alameda, Olaias and Chelas), but designed it for the whole AML from the start:
Operator registry: each operator's feed differences are stored as configuration instead of hard-coded rules. Automatic feed checks: the pipeline detects what stop_id means in each feed, distance units, duplicate pings, ping intervals, calendar gaps and the trip-match rate. Stop events: arrivals, departures and dwell times are detected geometrically (pings within a radius of each stop) instead of trusting stop_id. Demand linkage: validations are joined to vehicles with an as-of join. Same-card trip chaining across operators estimates where passengers get off and how full vehicles are. Scale: data is partitioned by date and operator and stored in Parquet, so it can handle about 100× the pilot's 482k pings per day. Challenges we ran into No two feeds were alike. Carris reports the last stop reached, Carris Metropolitana reports the next stop, and CP and Fertagus report no stop at all. One CM feed used kilometres instead of metres, and Carris sent about three copies of every ping. Our first index was wrong. The first version used an FGT-based index and read the timestamp for each stop_id directly. For next-stop feeds, that put arrivals 29–165 seconds too early. It also reported Carris completion at about 26 %, while the real figure was 89 %. We rebuilt the method from scratch. Gaps in the data. The Metro GTFS only started on 7 September, and one validations file was from October 2025. We had to detect these problems automatically and show them in the dashboard, not hide them. Separating demand from congestion. Separating these two causes of delay took careful thresholds and cross-checks between operators. Accomplishments that we're proud of We turned a single-area prototype into a method that works for any operator and any area, backed by a working dashboard. We found and fixed a completion error that had understated delivered service by more than three times. We found real bottlenecks in the pilot: Av. João XXI → Areeiro runs at about 4.2× its free-flow time, and Av. Almirante Reis at 2.1–2.6×. Bus speeds fall from 20.7 km/h at 05:00 to 14.6 km/h at 17:00. We made the dashboard honest about data quality. Every score shows its sample size, and every missing score says why. What we learned Understanding each feed matters as much as the modelling. The same field can mean different things from one operator to the next. Passenger experience depends on frequency. On a line every 5 minutes, a "late" bus hardly matters, but gaps between buses do. Missing data must never look like bad service. Once validations are linked to vehicles, they show much more than ridership. They let us tell a crowded bus apart from a bus stuck in traffic. What's next for Mobi4U Scale to the full AML: all 18 municipalities, plus trams, rail and ferries. Calibrate with TML and the operators: agree the scoring anchors, stop radii and thresholds for each mode. Add a fleet capacity table to turn on-board load into true load factors. Bring in Metro de Lisboa with station arrival events, since GPS doesn't work underground. Compare periods week by week and season by season, so we can track whether bus lanes, timetable changes or new services actually improve reliability
Built With
- apache-echarts
- duckdb
- fastapi
- gtfs
- maplibre-gl-js
- pandas
- parquet
- pyarrow
- pydantic
- pytest
- python
- react
- tailwind-css
- tanstack-query
- three.js
- tml-api
- typescript
- uvicorn
- vite
- vitest


