-
-
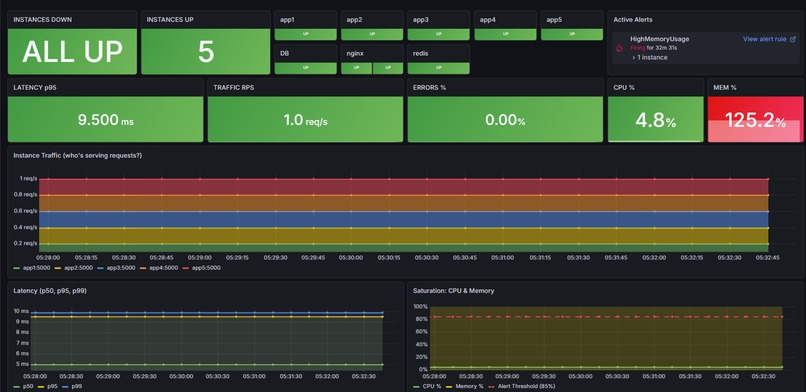
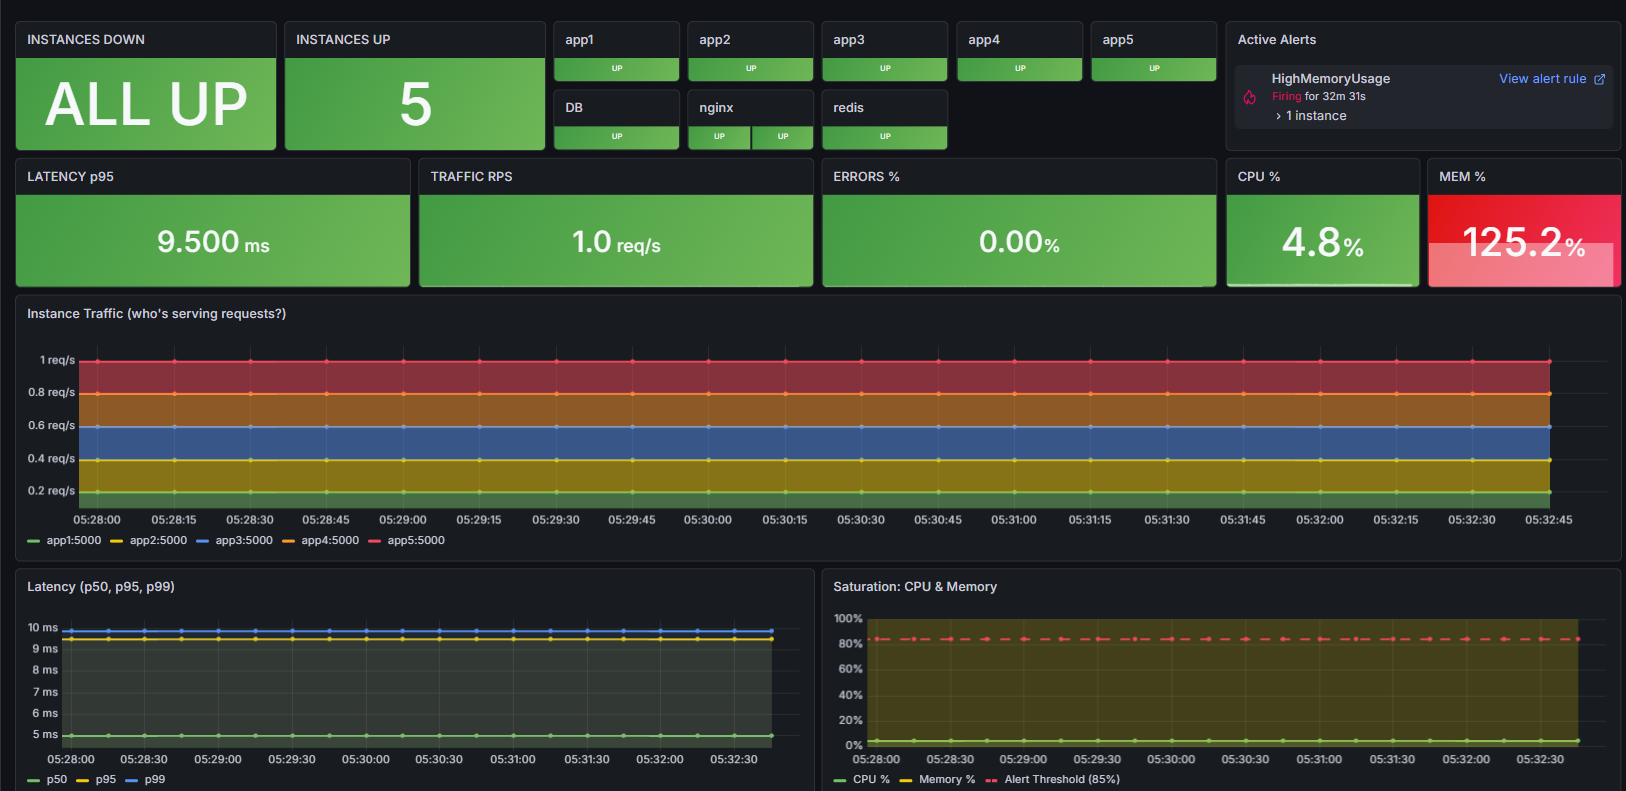
Our golden dashboard, capable of immediately telling us what instances are down, active alerts, general latency, saturations
-
 GIF
GIF
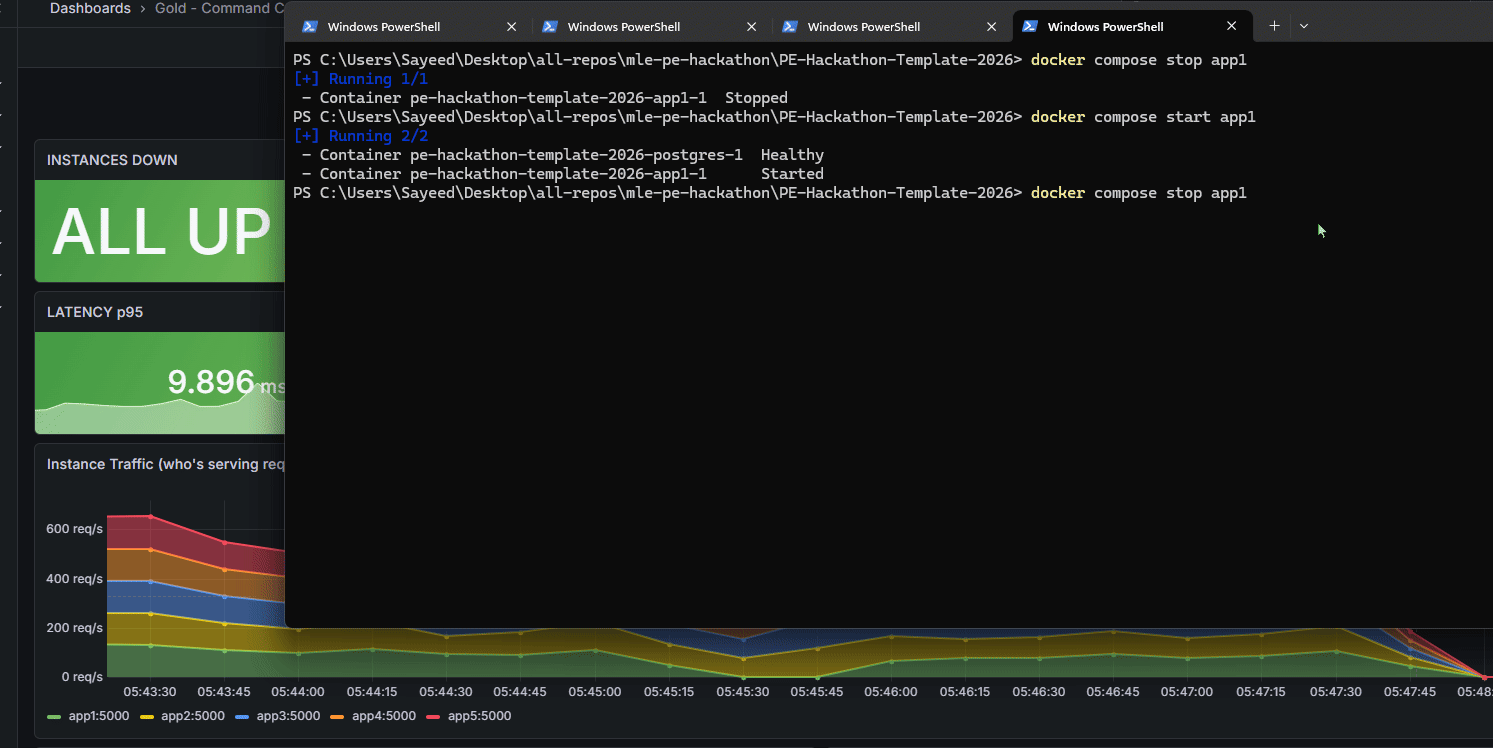
Our application can respond quickly and dynamically to instances going down, and our dashboard makes it very clear.
-
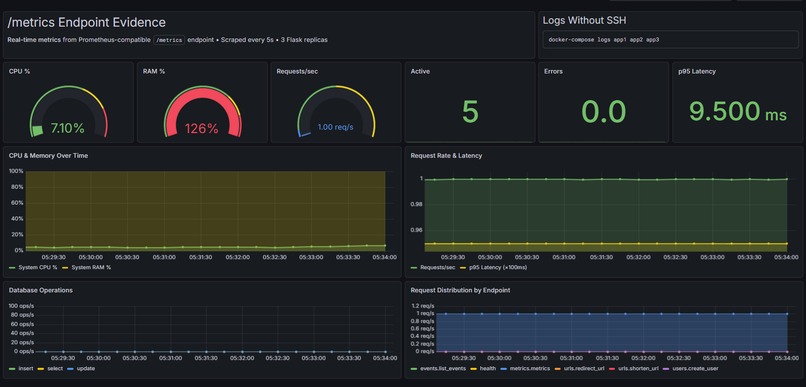
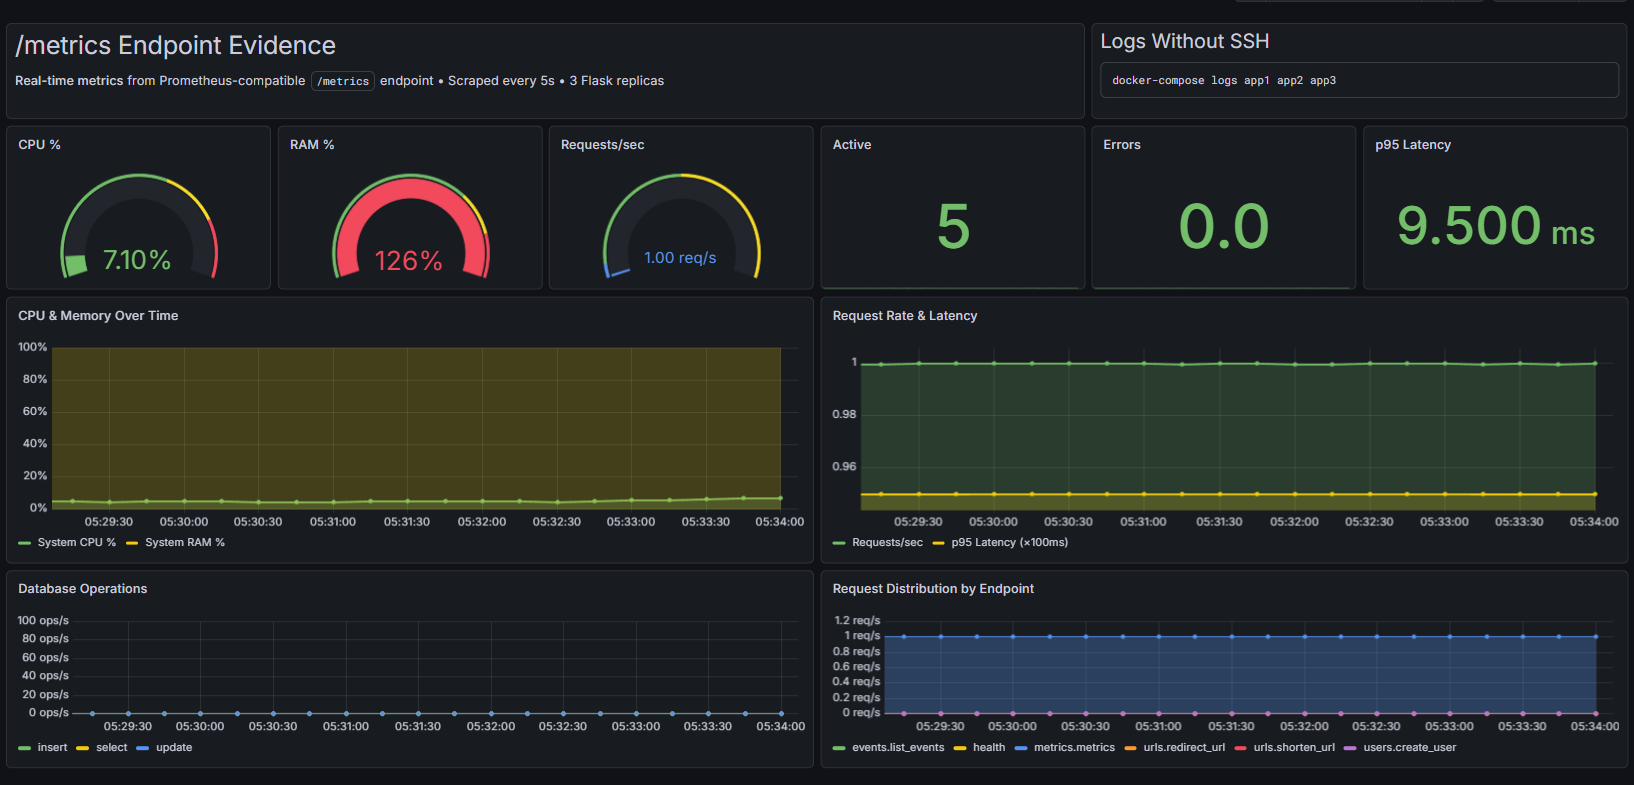
Our metrics dashboard that could visually shows us things like database operations, request distributions
-
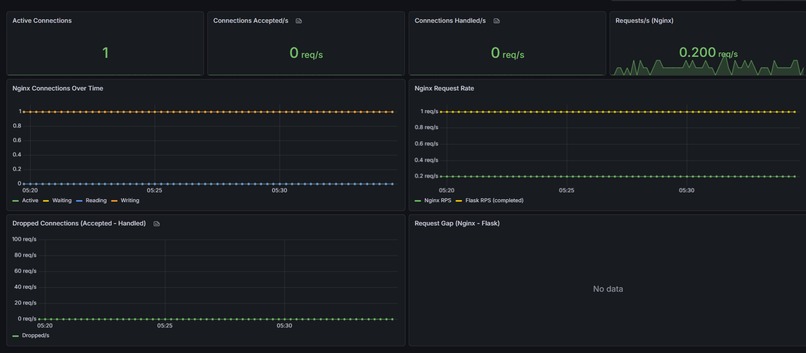
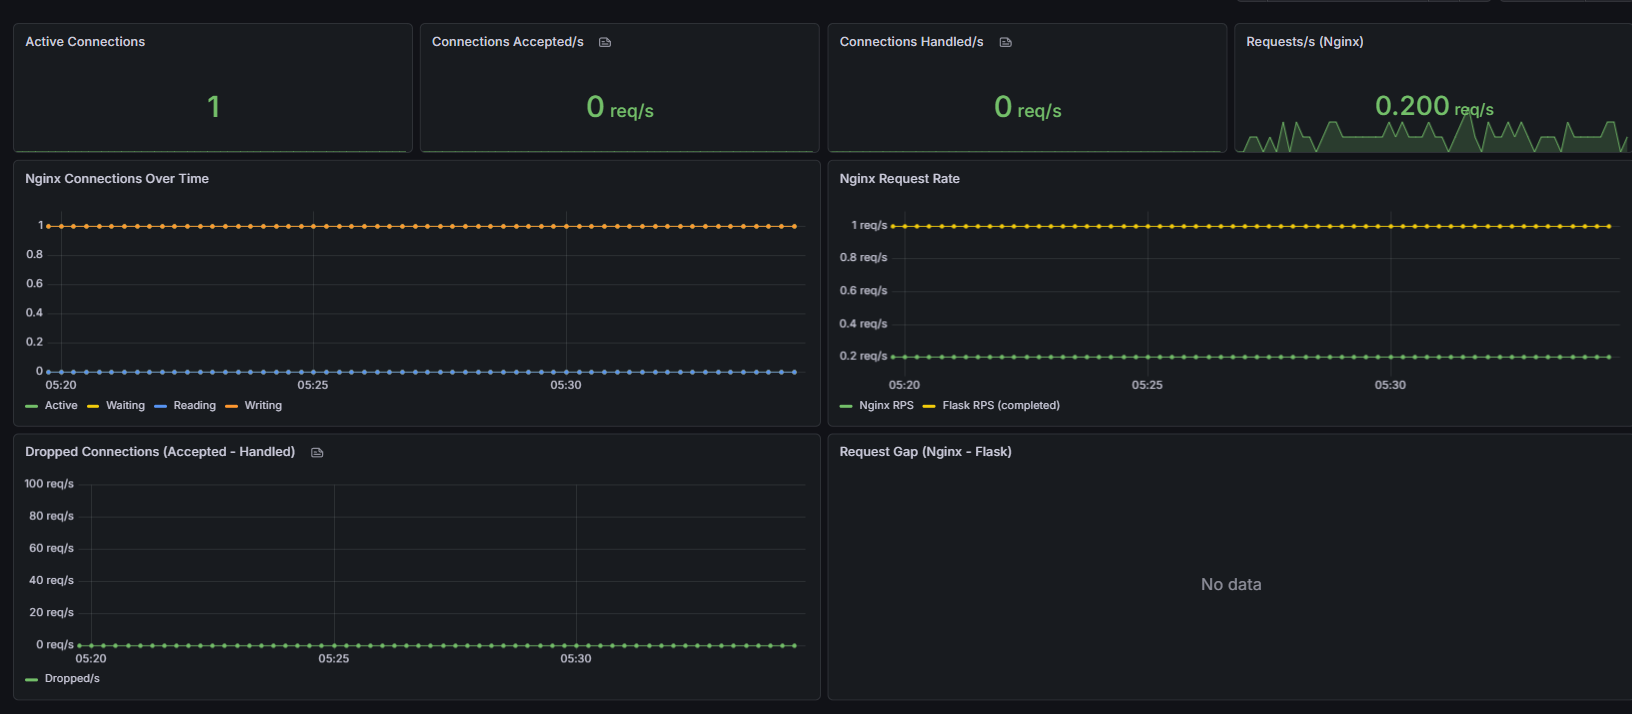
Our nginx dashboard which was critical in determining what issues were caused by nginx and not the application
-
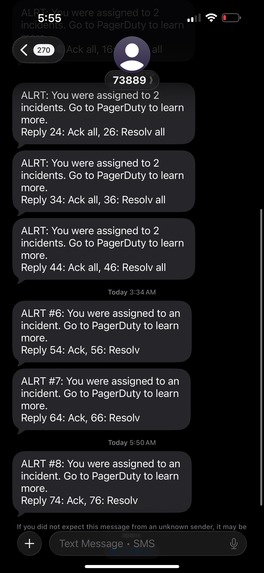
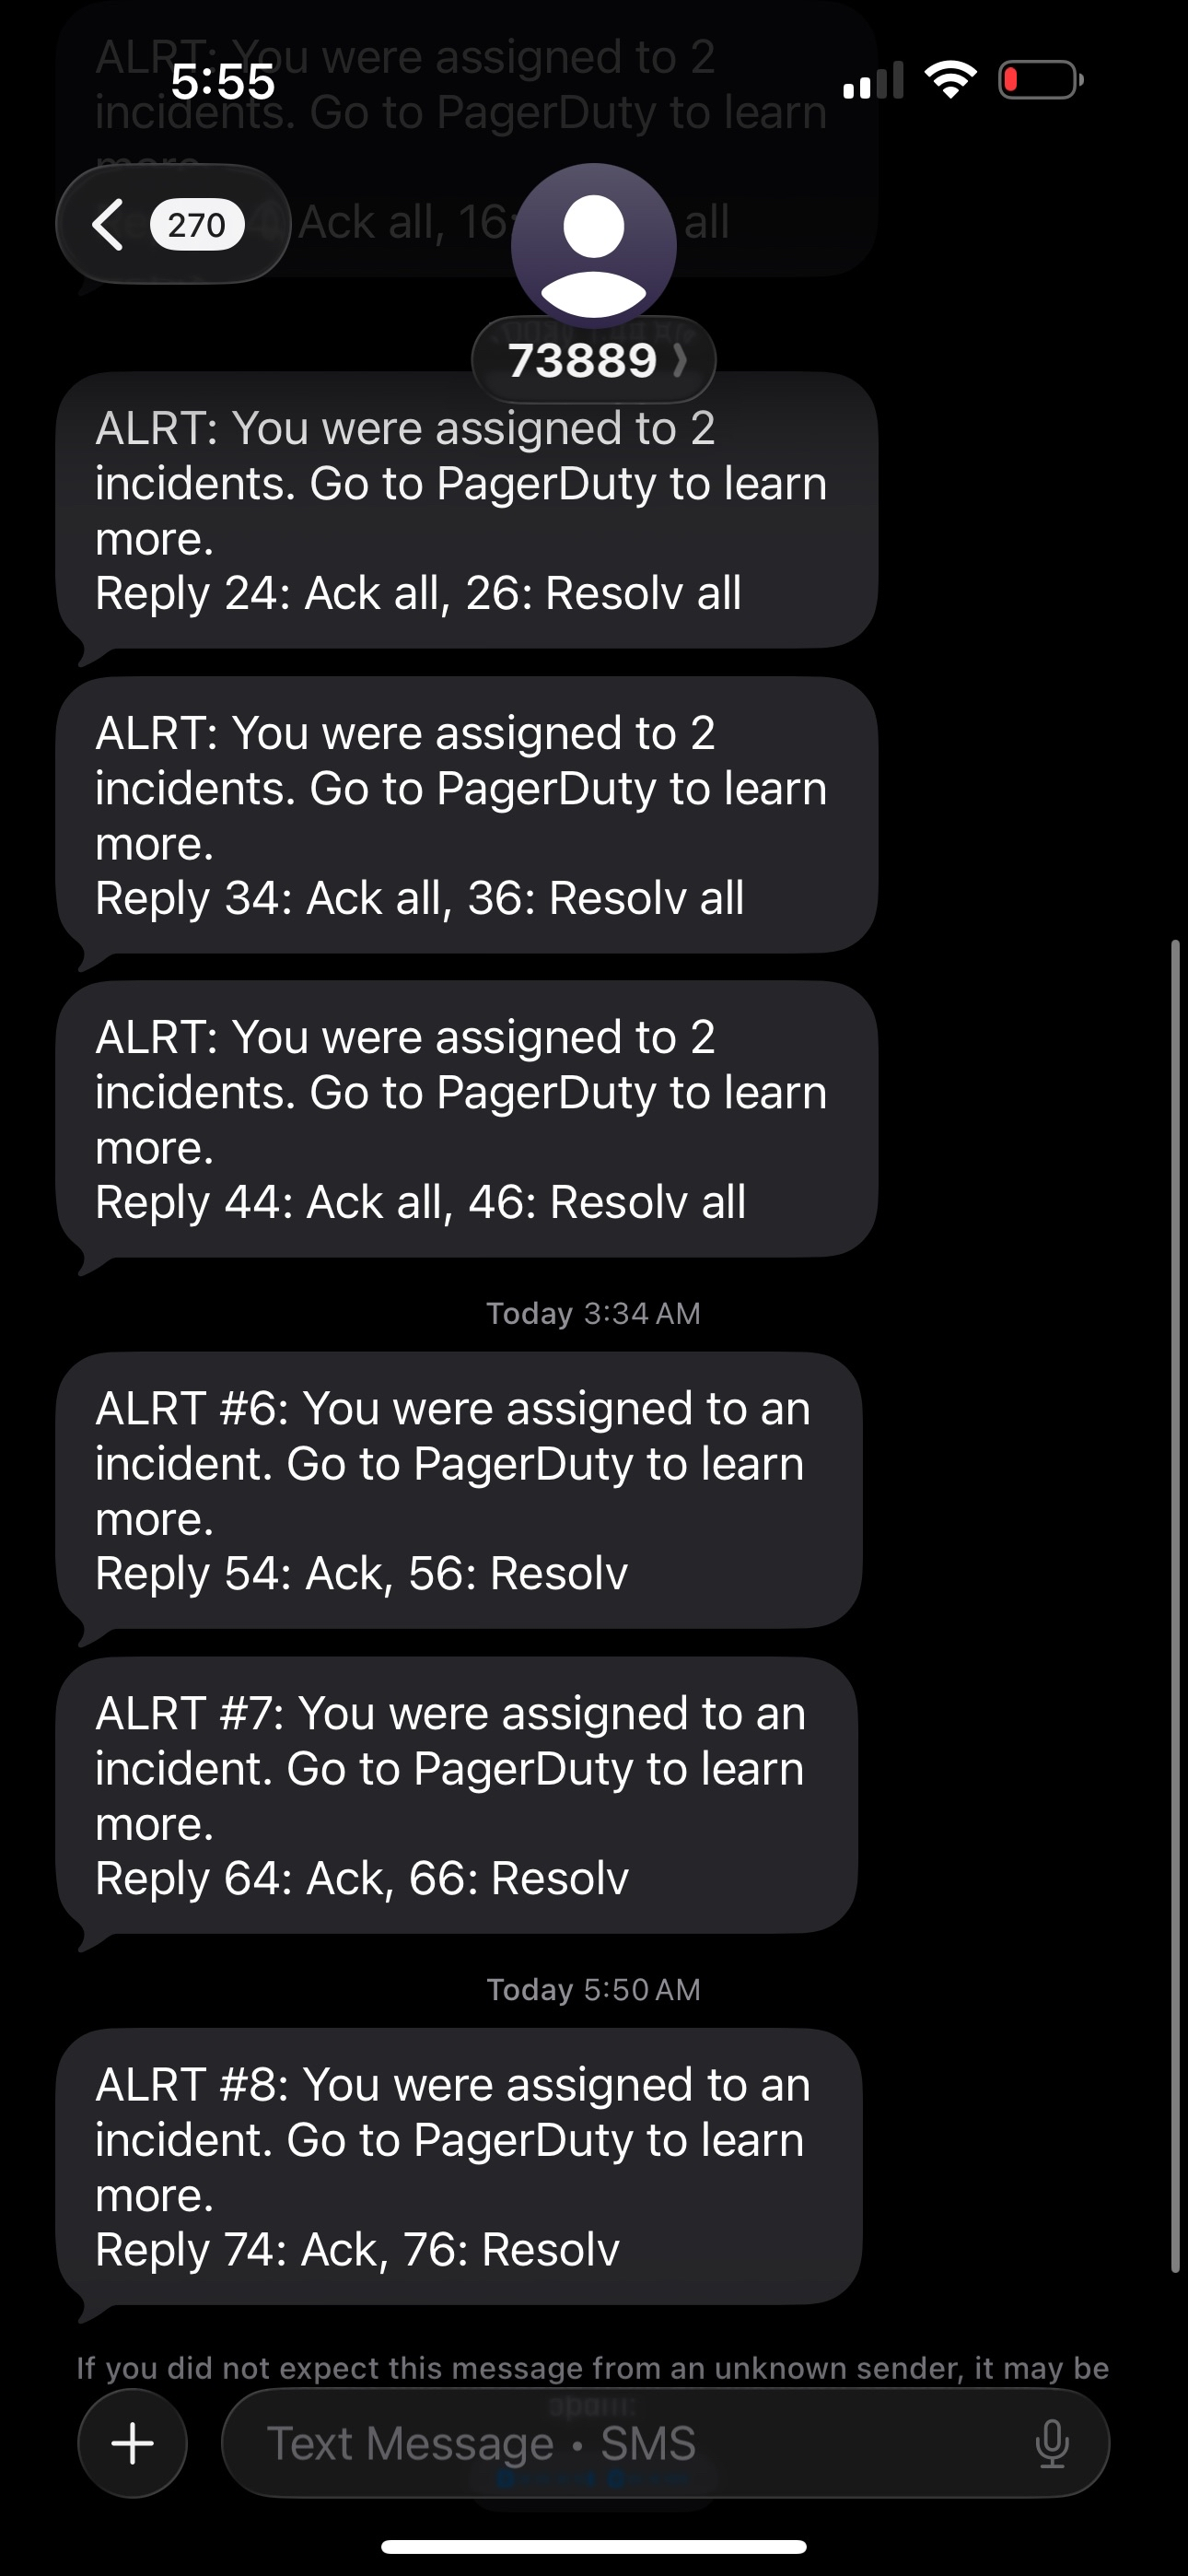
Lots of PagerDuty texts about app1 instance going down
Inspiration
We really wanted to focus on the challenge of actually scaling an application on our local hardware to be able to manage tons of requests, and the challenging process of isolating exactly what breaks our application. To that end, that was what defined our pipeline for building the application. One of us would work on the incident response to diagnose the issues we faced when scaling, and then the other person would figure out the solution that the other person found. It was very interesting working in tandem to detect, diagnose, and scale.
What it does
We have built a URL shortener with comprehensive observability and incident response capabilities:
- Shortens URLs with custom codes, click tracking, and expiration support
- Scales horizontally with 5 Flask app instances behind Nginx load balancer
- Caches aggressively using Redis to reduce database load
- Monitors everything with Prometheus metrics and Grafana dashboards tracking the 4 Golden Signals (Latency, Traffic, Errors, Saturation). We also have multiple other dashboards we integrated because we were facing some niche errors that the regular dashboards just couldn't catch at higher scale, like failed Locust to worker connections.
- Alerts intelligently through a 3-tier system: Discord for info, Email for warnings, and PagerDuty phone calls for critical incidents. We thought hard about what incident response really entails, and to alert only if it was actually critical, and to escalate the level of alert depending on the criticality of the issue.
- Centralizes logs with Loki for quick incident investigation. This let us not worry about SSHing, but also let us index on our logging to be able to quickly find issues. This was critical for isolating the real issues we ran into with scaling, by being able to quickly see which service had ERROR logs via our indexes.
How we built it
Application Layer:
- Python/Flask with Gunicorn workers
- PostgreSQL for persistent storage
- Redis for sub-millisecond caching
- Peewee ORM for clean database interactions
Infrastructure:
- Docker Compose orchestrating 15 services
- Nginx reverse proxy with upstream health checks
- 5 identical app replicas for redundancy
Observability Stack:
- Prometheus scraping metrics from all instances
- Grafana with custom dashboards (Gold Command Center for 4 Golden Signals)
- Loki + Promtail for centralized structured JSON logging
- Alertmanager routing alerts by severity
Alerting Pipeline:
- Critical alerts (ServiceDown, DatabaseDown) → Discord + Email + PagerDuty (phone call)
- Warning alerts (HighLatency, HighErrorRate) → Discord + Email
- Info alerts → Discord only
Challenges we ran into
Identifying what layer of the application errors were actually appearing in. For example, we got a ton of load from locust which resulted in errors, but none of it was at the Flask level. It was actually a layer upstream at the nginx level, but our monitoring had to be more robust to capture that kind of stuff.
Docker on Windows: We hit bizarre issues—a file literally named nul (a Windows reserved name) caused Docker to panic with nil pointer dereferences. Line ending mismatches caused protocol errors during builds. Hours of debugging for issues that wouldn't exist on Linux.
Redis graceful degradation: When Redis goes down, we wanted the app to continue serving from the database. But Redis client retry logic was causing Gunicorn workers to hang and get killed. We had to disable retries entirely and add strict socket timeouts to fail fast.
Chaos engineering tests. Managing the states of our workers was a challenge, and in the end we decided to go with simplicity for a lot of our choices simply because some of the things we wanted to do were stretch goals.
Accomplishments that we're proud of
- True horizontal scaling: Load tested to 2,500 concurrent users at 2,000 requests/second with p95 latency under 50ms
- Complete observability: Every request is tracked, every redirect is logged, every metric is graphed
- Phone call alerts: PagerDuty actually calls and texts your phone for things we defined as critical incidents, you can get an email too for alerts
- Comprehensive documentation: Runbook with step-by-step incident response procedures, architecture decision records, capacity planning guide
- 62 passing tests with full CRUD coverage for users, URLs, and events
What we learned
- Just how difficult observability really is, and to get a pointed insight into where exactly your application is struggling
- Avoiding cascading failures, exponential backoff + jitter to avoid thundering herd issues
- What you actually need in a dashboard to quickly be able to find the relevant information to solve the issue that arises
What's next for MLH-PE-KodeBrotherz
- Host it on a Kubernetes cluster on one of our spare laptops and just see how far we can push the scaling with efficient algorithms
- Distributed tracing, which we tried with Tempo but struggled a lot with and decided to shelve it as a stretch goal

Log in or sign up for Devpost to join the conversation.