Inspiration
I recently re-started the famous Machine Learning course by Andrew Ng on Coursera.
When I saw the visualizations shown in the course, I realized that it's static and I like interactive visualizations a lot. Since I know React and have been working with Data Visualization at my work, I thought of making a web app to take my notes visually.
What it does
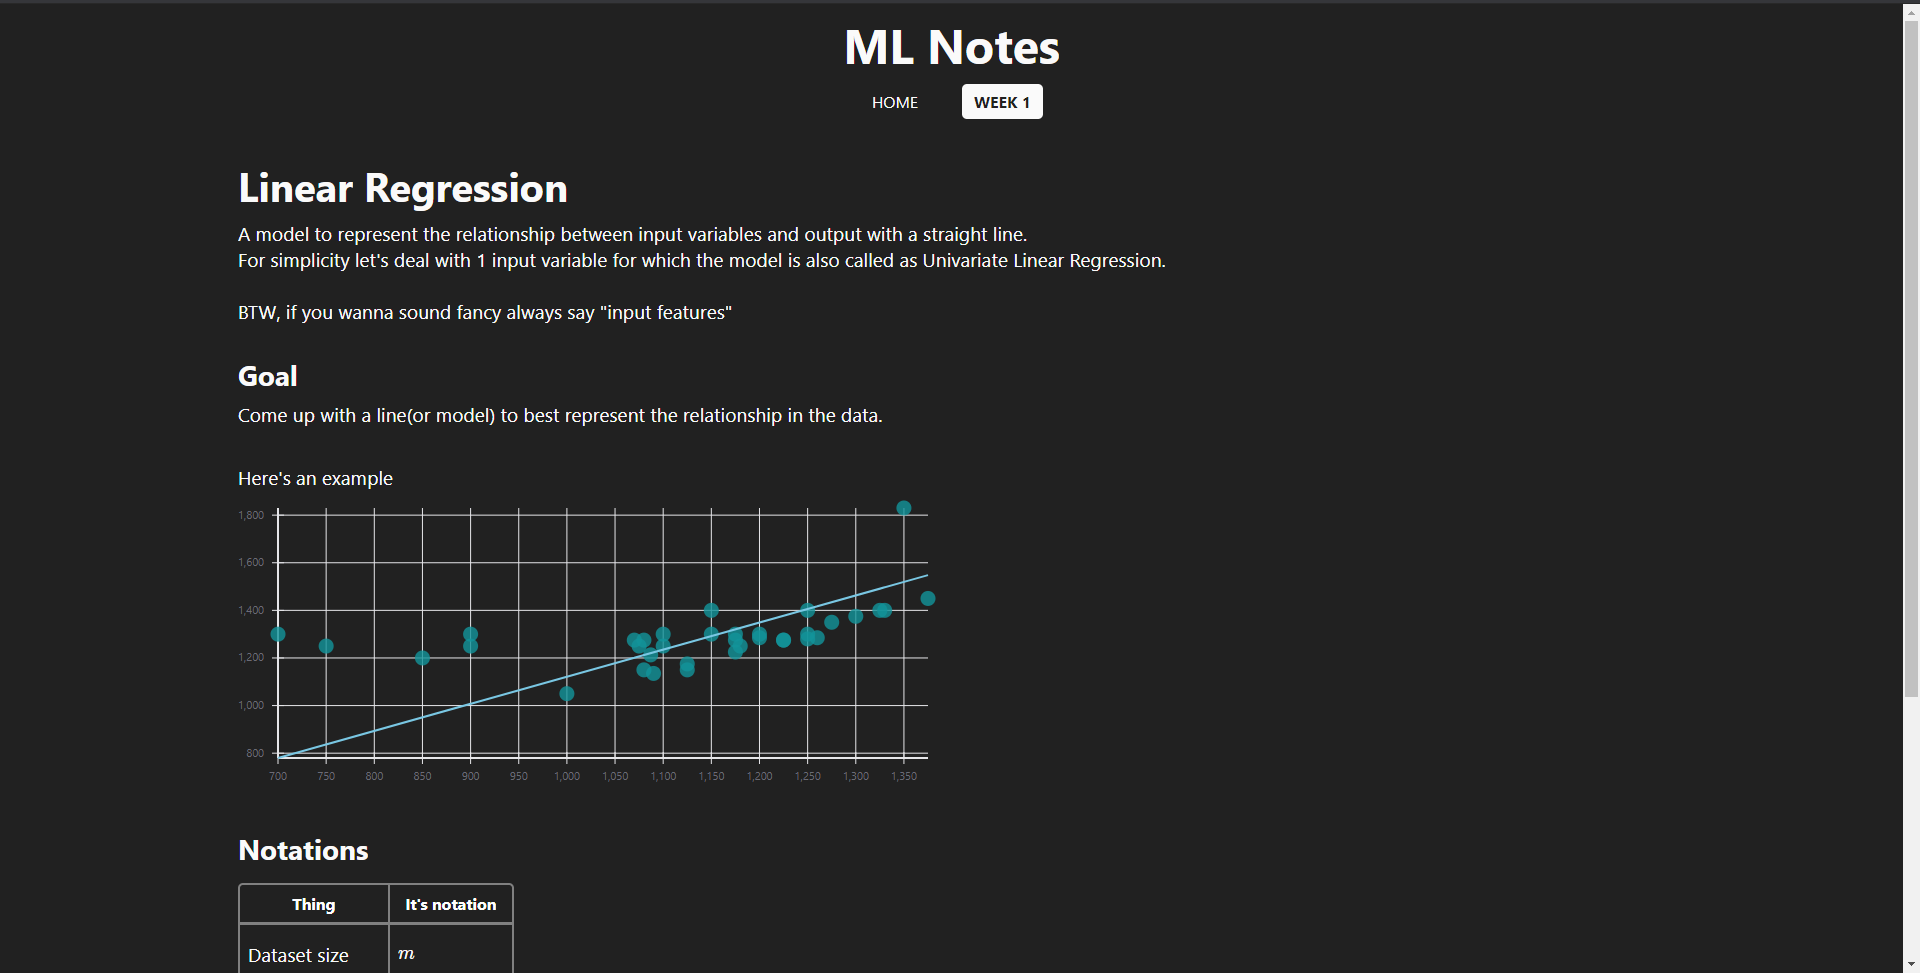
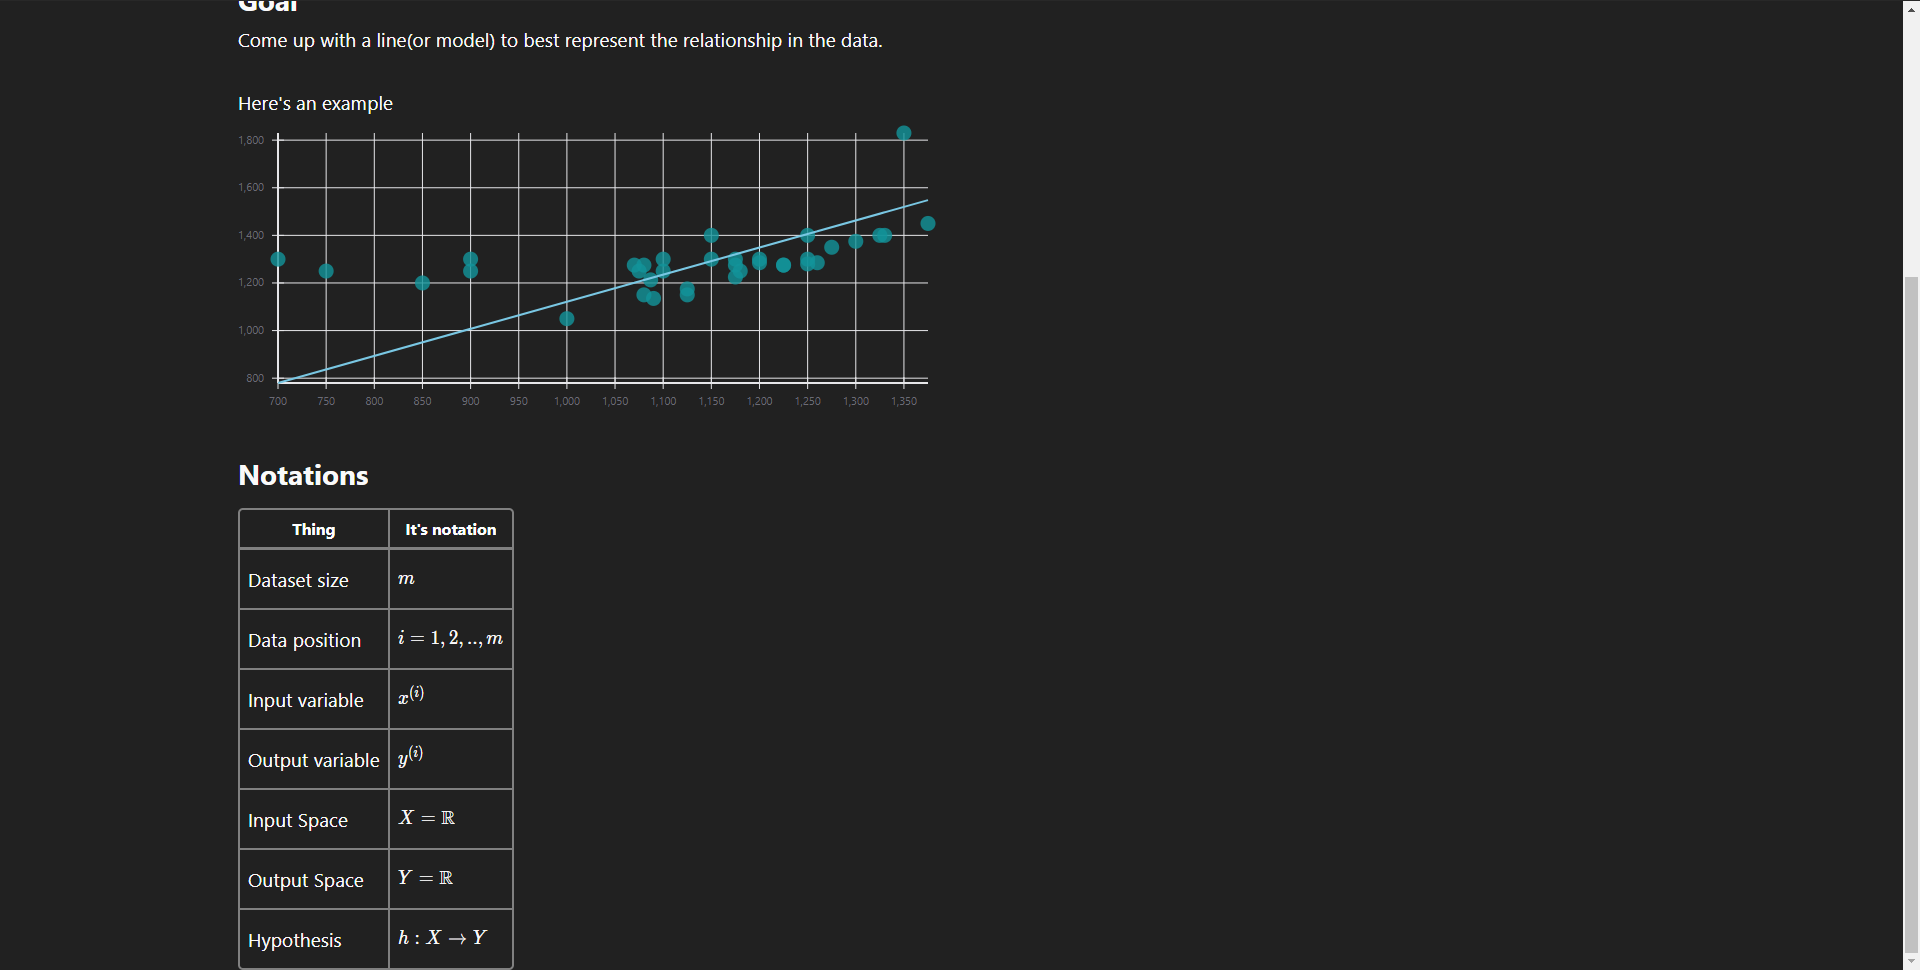
It's a collection of my notes on what I've learnt in ML with various kinds of charts to visualize. The cool part is that you can tweak and interact with the models in your browser to better understand how they work without a lot of hassle.
How I built it
I have built it using React for the app and react-vis for charting.
Challenges I ran into
Finding a good charting library that has charts from the course(mainly contour plots). Using D3 from scratch was difficult so after some searching, I found react-vis.
Accomplishments that I'm proud of
It's still a WIP so nothing yet.
What I learned
Planning is more important than diving headfirst into code.
What's next for ML Notes
Collect my notes for the entire course and maybe even more. If people like it I can make it open source where other learners and experts can contribute their notes in a way that'll help people understand the small details of ML models better.

Log in or sign up for Devpost to join the conversation.