-
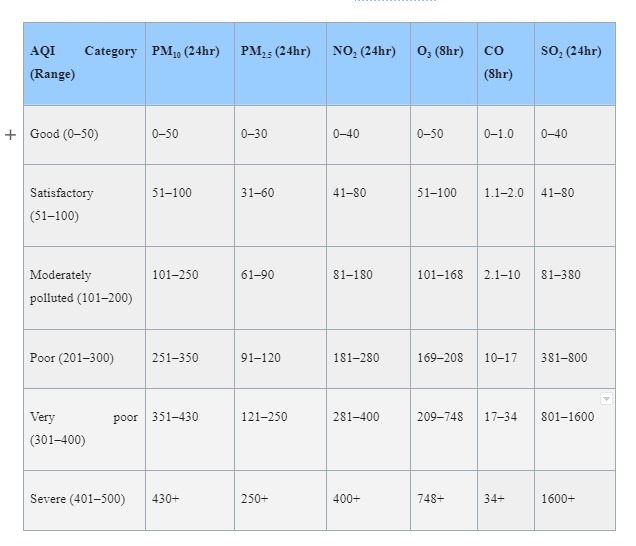
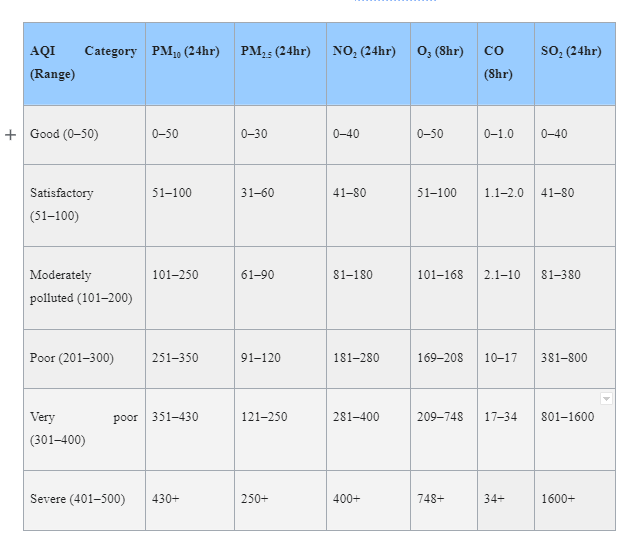
AQI Category, Pollutant Level and Health Break Points.
-
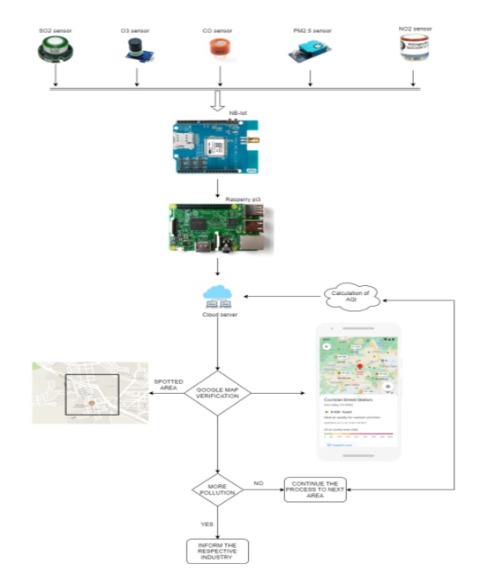
Environmental Air Pollution Monitoring and Rerouting system.
-
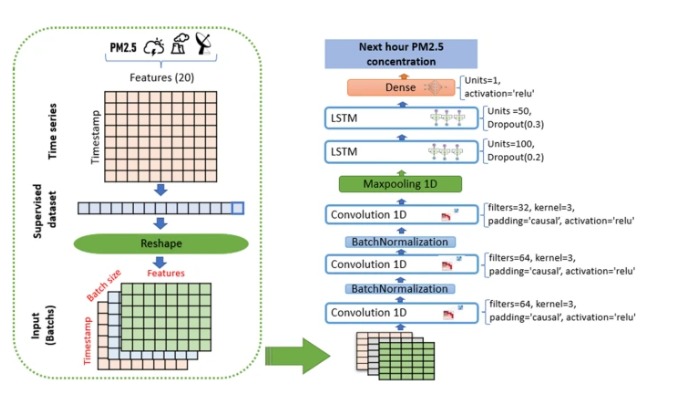
The architecture of the proposed CNN-LSTM
-
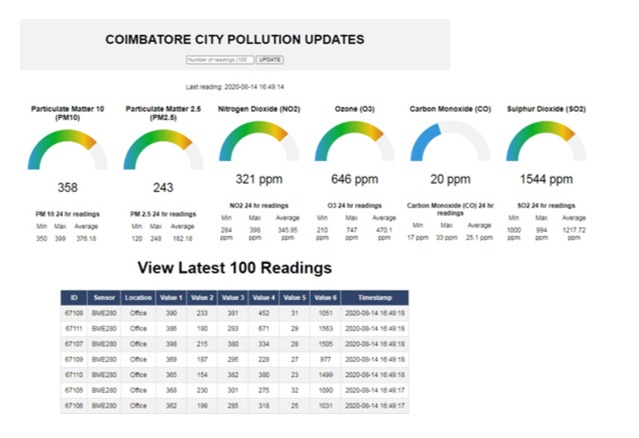
Pollution update for AQI Ranging from 301- 400
-
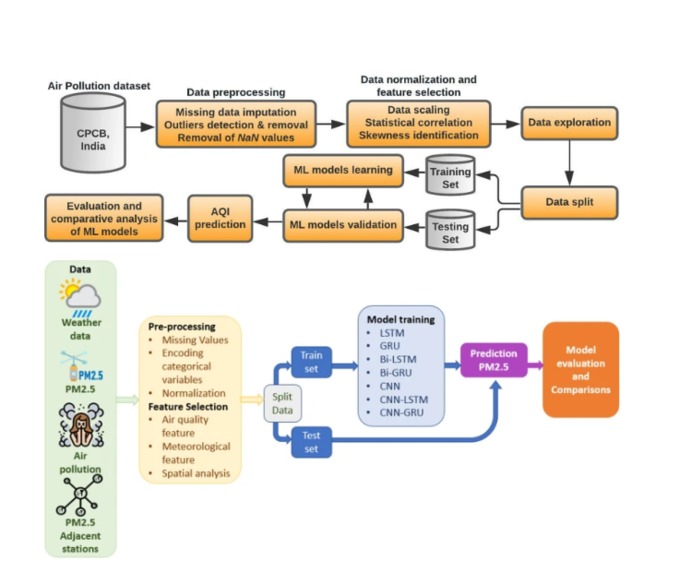
Workflow for predicting the concentrations of Air Quality Index


Inspiration
The main objective of this invention is to provide a cost effective and reliable method of detecting the air pollution in the environment and identify the cause of pollutants in that area using a machine learning model. Pollution sensor systems used for data acquisition are currently used in all major cities around the world to monitor the degree of air pollution. Implementing a machine-learning algorithm to process the data purchased from these sensors can provide solutions to maintain the optimal parameters for the global temperature.
What it does
Air pollution has become the most important issue concerning human evolution in the last century, as the levels of toxic gases and particles present in the air create health problems and affect the ecosystems of the planet. The present invention deliberates the implementation of cloud based IoT system for air quality monitoring in which the sensors are used to calculate CO, PM2.5 and PM10, O3, SO2 and NOx pollution level with environmental condition like temperature and humidity. In order to determine the exact value of AQI and to detect which air pollutants are responsible for this disaster, various sensors from several categories currently available could be used. With the help of ML, one also can create forecasts regarding air pollution and prevent further increase in the Air Quality Index.
How we built it
Monitoring the air pollution levels implies the existence of a scale of the air quality, which can be measured with the help of sensor technology. The Air Quality Index (AQI) is based on the measuring of the liquid droplets and solid particles found in the air, which consists mostly of nitrogen dioxide (NO2), ozone (O3), sulphur dioxide (SO2) and carbon monoxide (CO). The key pollutants to calculate AQI are particulate matter (PM2.5 and PM10), which determines the class of air quality level (goof, satisfactory, moderately, poor, very poor and severe), with a range from 0 to 500; each category of AQI has an impact on human health and the environment. Each air pollutant has its own source and effects; thus, managing to get an image of the air pollution sources in an area based on the highest-level polluting particle, for example, a high level of nitrogen dioxide, tells us that in that area fossil fuel burning occurs, possible due to heavy traffic in the area, etc. To decide air quality in a zone, contamination fixations are truly estimated and detailed. The AQI is determined dependent on the normal centralization of a specific toxin estimated over a standard time span (24 hours for most poisons, 8 hours for carbon monoxide and ozone). For instance, the AQI for PM2.5 depends on 24-hour normal fixation and processed.
Challenges we ran into
The air is polluted by a different mixture of small particles with a diameter less than 10µm and this refers to a term called particulate matter. This is of most concern because the particles with a diameter of less than 10 µm can be inhaled by a human being and enter into the lungs which cause serious health effects. This can be measured by an optical dust sensor module which transcends the dust particles in air by the transmission of light. In this sensor light is transmitted in air and this light gets reflected, refracted and scattered to bite the dust particles present in the air. Depending upon the measure of scattering property, reflective index and absorption of light the particle count can be measured and the size of particles can be estimated. Ozone is a colorless and highly irritating gas and is considered as a secondary pollutant that is formed when the pollutant emitted by car, power plant, industrial boilers and other resources react chemically in presence of sunlight. MQ131 Ozone Sensor detects and measures Ozone (03) Concentration from 10ppb to 2ppm which is ideal for monitoring air quality or for use in environment and research experiments.
Oxides of nitrogen are mixed in the air from the emissions of car trucks, bus power plants and due to the burning of fuels. Breathing and with the high concentration of nitrous oxide can cause some respiratory diseases which leads to wheezing and asthma problems. Carbon monoxide is a poisonous gas which is produced due to burning of gasoline, wood, propane, charcoal and other fuels. Breathing carbon monoxide regularly can cause many uncomfortness in the human body and death may occur if the humans are exposed to higher levels. MQ7 is a low cost sensor which can be able to measure the concentration of carbon monoxide in air. Due to the burning of coal and oil in power plants Sulphur dioxide is released in the air. This can also be emitted from trains, large ships and some diesel equipment that burns high Sulphur fuel. When humans are exposed to such air pollution the respiratory system may be affected and cause irritation to the eyes. 110-602 Sulphur dioxide electrochemical sensors can be used to send the amount of gas mixed with air and it provides easy integration into wireless solutions.
Data preprocessing In numbers, AQI is represented between 0 to 500 with 0 representing good air and 500 representing hazardous air. The AQI is calculated based on the average concentration of a particular pollutant measured over a standard time interval (24 hours for most pollutants, 8 hours for carbon monoxide and ozone). For example, the AQI for PM2.5 is based on 24-hour average concentration and computed. The goal of an AQI is to rapidly scatter air quality data (nearly progressive) that involves the framework to represent contamination's which have momentary effects. It is similarly significant that the majority of these toxins are estimated persistently through a web based observing system. An example of AQI calculation and description for Coimbatore (online air quality monitoring network) is presented here. The sub-index (Ip) for a given pollutant concentration (Cp), as based on ‘linear segmented principle’ is calculated as: Ip= [{(IHI - ILO)/ (BHI -BLO)} * (Cp-BLO)] + ILO BHI= Break point concentration greater or equal to given conc. BLO= Break point concentration smaller or equal to given conc. IHI = AQI value corresponding to BHI ILO = AQI value corresponding to BLO The AQI framework ought to have web-based AQI spread which ought to be intended for online count and show off across the nation AQI. The website should deliver a snappy, straightforward and an exquisite looking reaction to an AQI inquiry. The other features of the website should include reporting of pollutants responsible for index, pollutants exceeding the standards and health effects. Quality of data is the first and most important prerequisite for effective visualization and creation of efficient ML models. The preprocessing steps help in reducing the noise present in the data which eventually increases the processing speed and generalization capability of ML algorithms. Outliers and missing data are the two most common errors in data extraction and monitoring applications. The data preprocessing step performs various operations on data such as filling out not-a-number (NAN) data, removing or changing outlier data, etc.
Using the Results Obtained after Processing with Machine Learning The data collected and processed via the algorithms presented earlier can be used to create a forecast of the weather and the AQI. Since we live in the era of technology and every device is connected to the internet, no matter its dimensions or purpose, IoT technology became the main picture in the eyes of developers, companies and scientists. By connecting the system presented in this paper to the cameras inspecting the traffic and the big sources of air pollution, such as factories and landfills, one can create a complex system that can warn against and combat air pollution. For example, if near an atmospheric station an increase in the NO2 particles, one can conclude that these particles originated from the burning of fossil fuels, whose main source is from the use of automobiles. From these data one can suppose that a traffic jam takes place near the station.
The system can further check via the traffic cameras that this can really be the source of the air pollutant. If yes, the system can start searching for a way of manipulating the traffic lights so that the circulation can be improved, eventually warning other traffic participants to take other routes. Another example would be when high levels of CO2 are detected. This can further indicate a potential fire somewhere near the station. The source of the particles could be everywhere in a fairly wide radius. To limit the space, wind sensors can help find the source. By tracking the wind speed and direction, the system can create a map of possible sources for the pollutant. It can then search for the source visually with the help of the cameras, eventually warning the authorities of a potentially detected fire. All the missing values are filled with the median values against each feature to solve the missing data problem. Next, a normalization process has been applied to standardize the data, ensuring that the significance of variables is unaffected by their ranges or units. The data normalization process helps to bring different data attributes into a similar scale of measurement. This process plays a vital role in the stable training of ML models and boosts performance. The datatypes of all the variables are also examined during normalization. A correlation-based feature selection method has been exploited in the present work to determine the optimal number of input variables (pollutants) when developing a predictive model. Statistical correlation-based feature selection algorithms compute correlations between every pair of the input variable and the target variable. The variables possessing the strongest correlation with the target variable are then filtered for further study. Since many ML algorithms are sensitive to outliers, any feature in the input dataset which does not follow the general trend of that data must be found. For the present dataset, a correlation-based statistical outliers detection method has been applied to identify the outliers. To select significant features, the correlation analysis of the AQI feature has been exercised with features of other pollutants.
Accomplishments that we're proud of
Predicting air quality is a complex task due to the dynamic nature, volatility, and high variability in time and space of pollutants and particulates. At the same time, being able to model, predict, and monitor air quality is becoming more and more relevant, especially in urban areas, due to the observed critical impact of air pollution on citizens’ health and the environment. The quality of air can be measured by using a parameter named Air quality index. The Key pollutants to calculate Air quality index are particulate matter (PM2.5 and PM10), Ozone (O3), Nitrogen Dioxide (NO2), Sulphur Dioxide (SO2) and Carbon Monoxide (CO). This work deliberates the implementation of cloud based IoT systems for air quality monitoring in which the sensors are used to calculate CO, PM2.5 and PM10, O3, SO2 and NOx pollution levels with environmental conditions like temperature and humidity. The obtained information can be updated in cloud platforms using Lora nodes and Lora Gateway.
What we learned
The main objective of this invention is to provide a cost effective and reliable method of detecting the air pollution in the environment and identify the cause of pollutants in that area using a machine learning model. A dataset has been formed by combining all the major industries with their pollution status and the types of Harmful gasses that they emit. These informations were recorded from each area based on the information collected for 8 hour concentrations and these informations are stored in the cloud for further processing. The database has the role of collecting the data offered by the sensor nodes and creating reports of the AQI and weather status. By maintaining the data in an organized form, one can see the evolution of the AQI and create algorithms that can offer us a better understanding of the air pollution status and forecasts to prevent possible natural disasters or health warnings. Implementing a central processing unit with the use of machine learning technology can offer us all the information we need to combat air pollution. This unit can read the reports collected in the database and compare the data, creating a forecast of the AQI and offering information to find possible sources of pollution based on the data, such as the possibility of a fire, or to alert high levels of harmful particle in the air coming from a factory, or to control traffic lights in order to drain congested traffic.
What's next for ML ALGORITHM TO MEASURE AIR QUALITY AND CAUSE OF DEGRADATION
Predicting air quality is a complex task due to the dynamic nature, volatility, and high variability in time and space of pollutants and particulates. At the same time, being able to model, predict, and monitor air quality is becoming more and more relevant, especially in urban areas, due to the observed critical impact of air pollution on citizens’ health and the environment. The quality of air can be measured by using a parameter named Air quality index. The Key pollutants to calculate Air quality index are particulate matter (PM2.5 and PM10), Ozone (O3), Nitrogen Dioxide (NO2), Sulphur Dioxide (SO2) and Carbon Monoxide (CO). This work deliberates the implementation of cloud based IoT systems for air quality monitoring in which the sensors are used to calculate CO, PM2.5 and PM10, O3, SO2 and NOx pollution levels with environmental conditions like temperature and humidity. The obtained information can be updated in cloud platforms using Lora nodes and Lora Gateway. The main objective of this invention is to provide a cost effective and reliable method of detecting the air pollution in the environment and identify the cause of pollutants in that area using a machine learning model. A dataset has been formed by combining all the major industries with their pollution status and the types of Harmful gasses that they emit. These informations were recorded from each area based on the information collected for 8 hour concentrations and these informations are stored in the cloud for further processing. The database has the role of collecting the data offered by the sensor nodes and creating reports of the AQI and weather status. By maintaining the data in an organized form, one can see the evolution of the AQI and create algorithms that can offer us a better understanding of the air pollution status and forecasts to prevent possible natural disasters or health warnings. Implementing a central processing unit with the use of machine learning technology can offer us all the information we need to combat air pollution. This unit can read the reports collected in the database and compare the data, creating a forecast of the AQI and offering information to find possible sources of pollution based on the data, such as the possibility of a fire, or to alert high levels of harmful particle in the air coming from a factory, or to control traffic lights in order to drain congested traffic.
Built With
- cloudservices
- databases
- iot

Log in or sign up for Devpost to join the conversation.