-
-
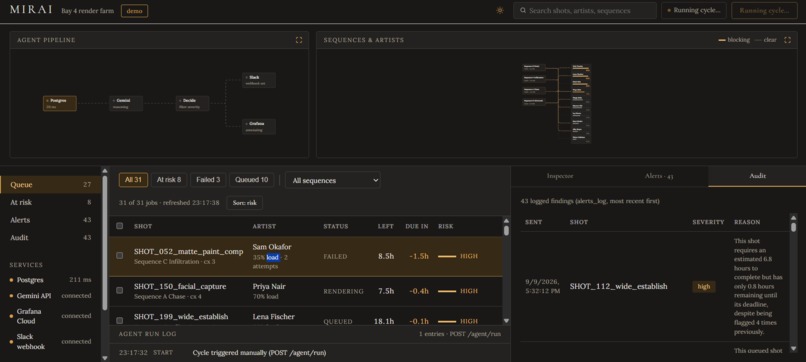
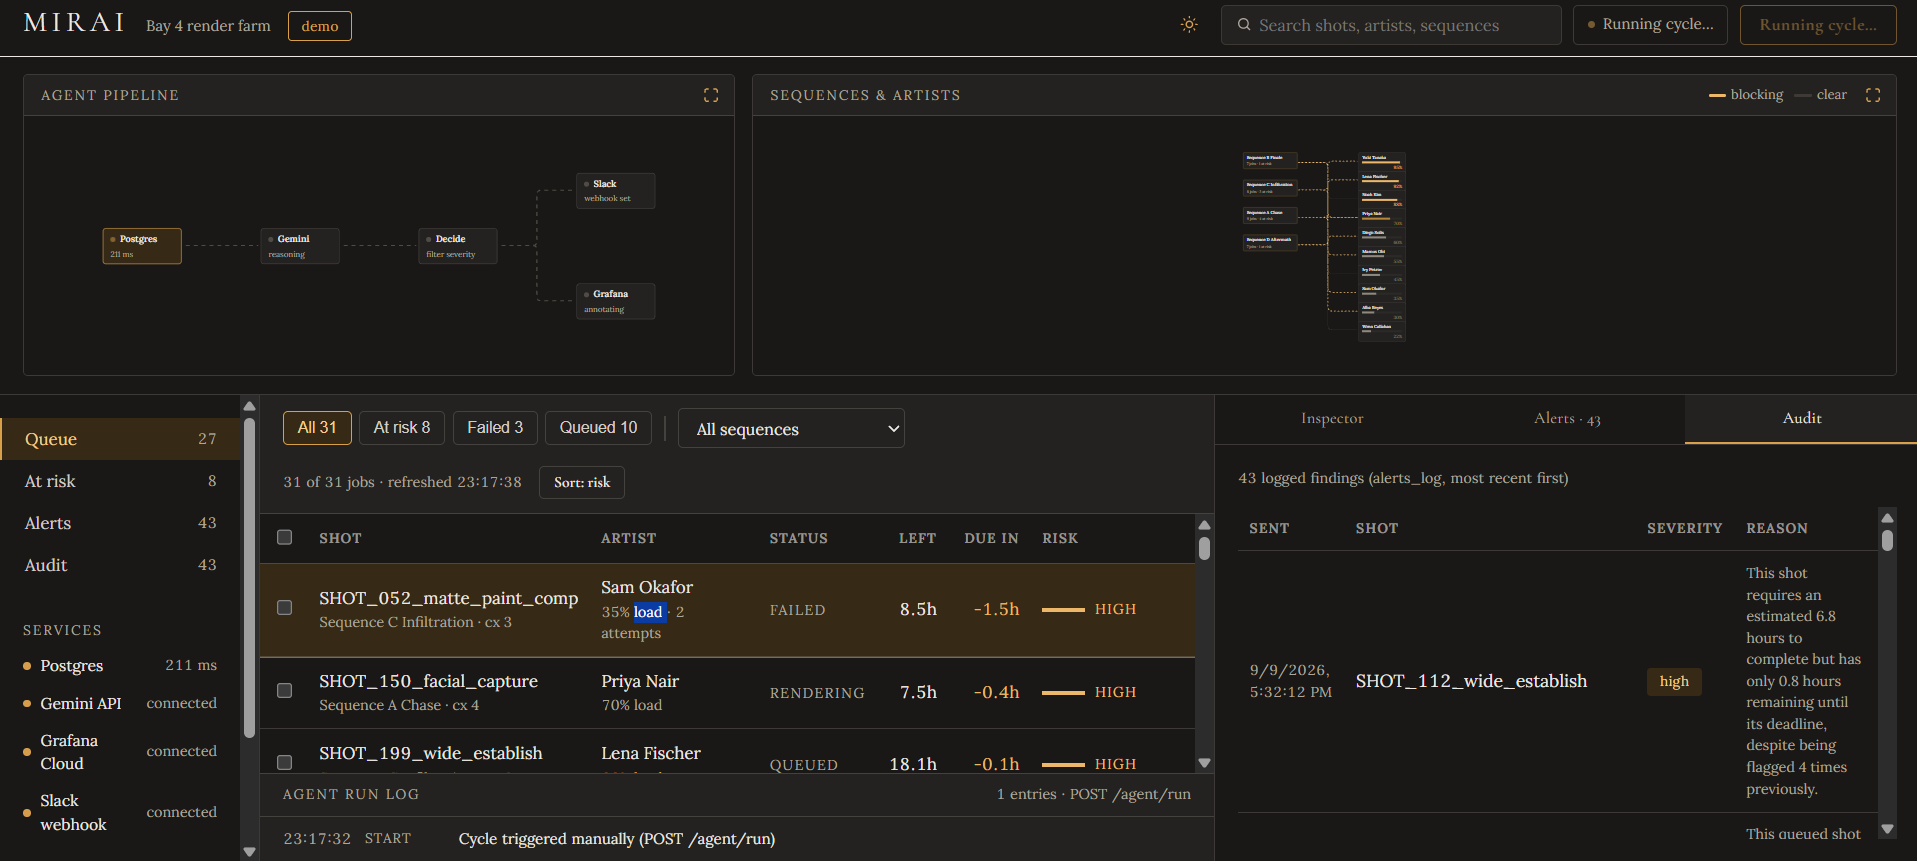
MIRAI Dashboard showing all the different analytics
-
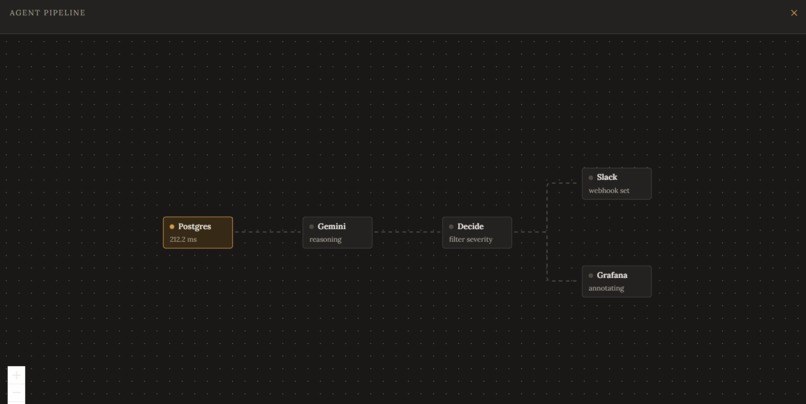
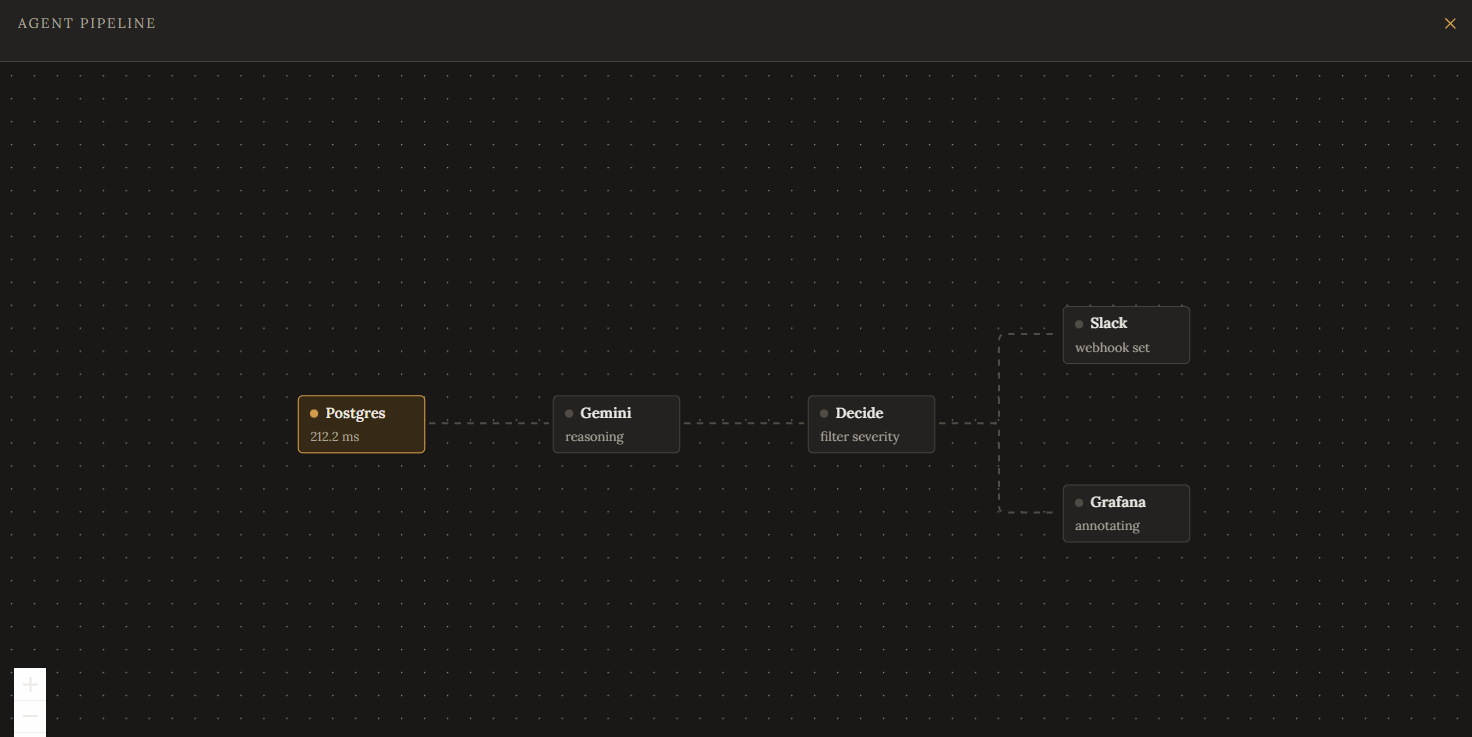
Agentic Pipeline
-
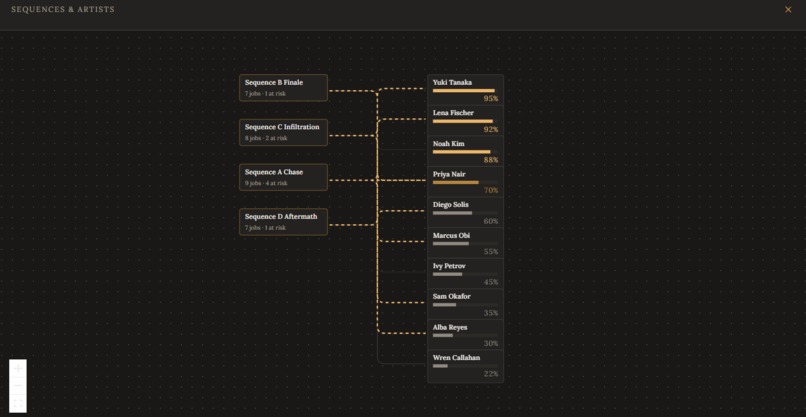
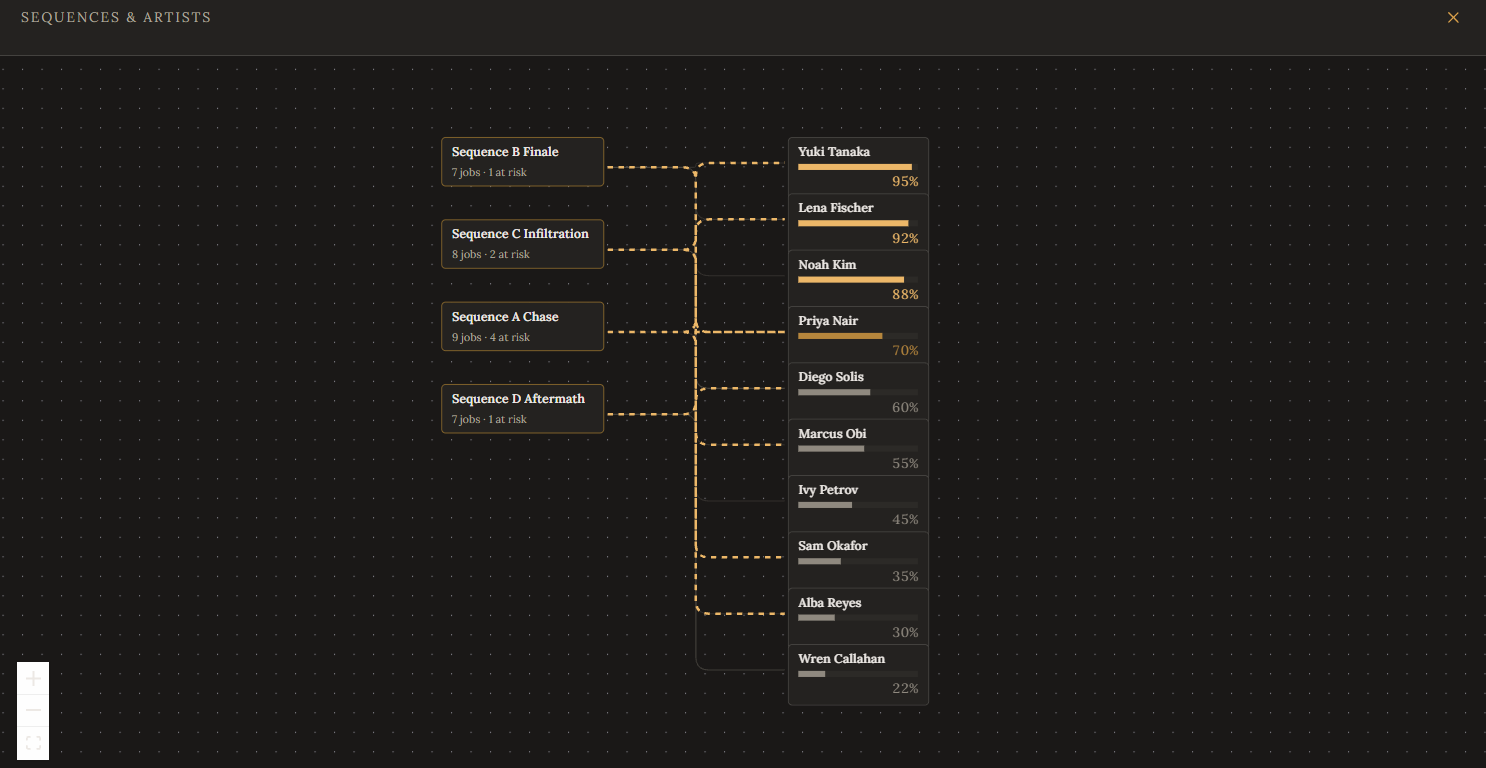
Sequence and Artists Connected Graph to show the dependencies and blocking factor easily
-
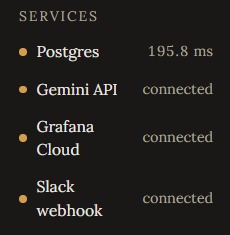
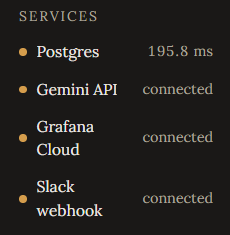
Services Health/Status
-
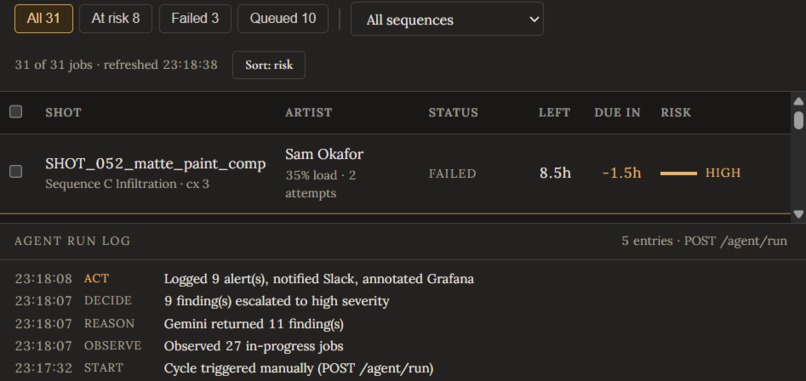
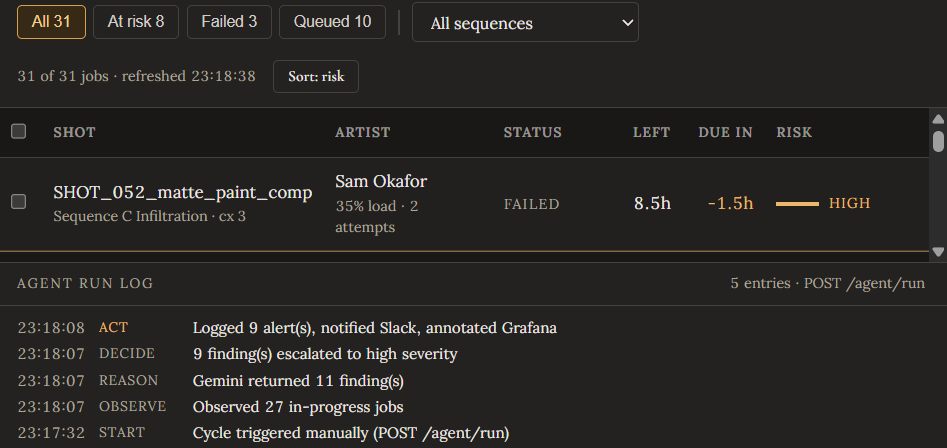
Dashboard component showing shot sequence and all the factors, agent run log
-
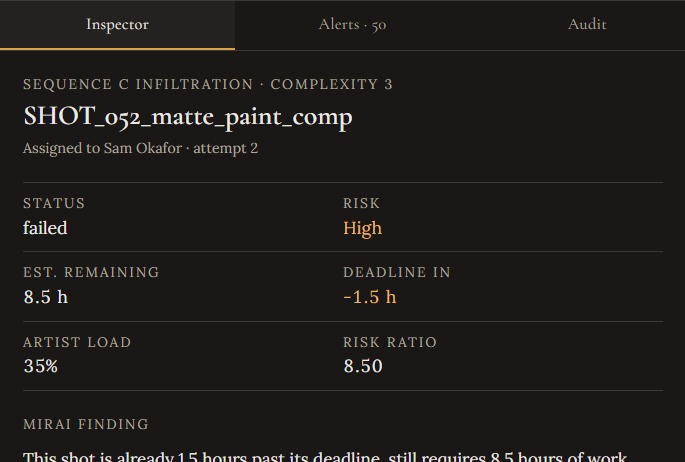
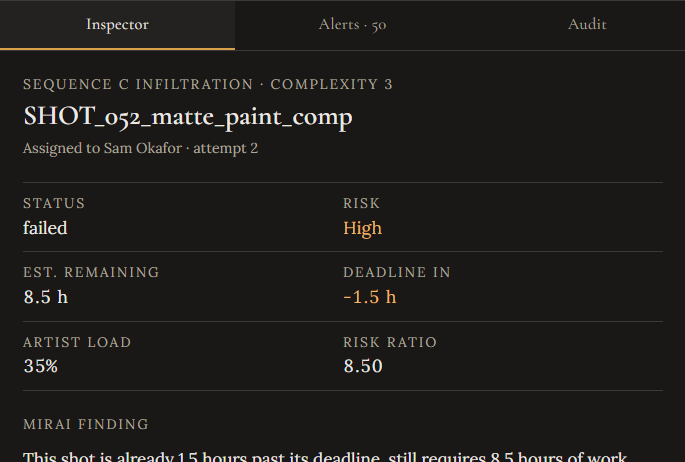
Inspection of a Shot Sequence getting its analytics in a simple way
-
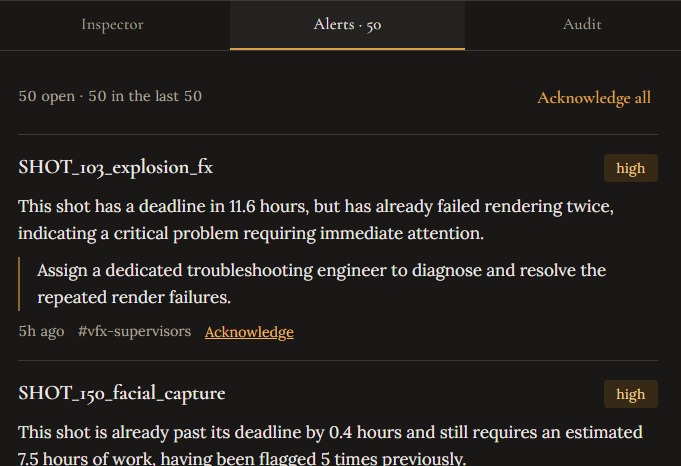
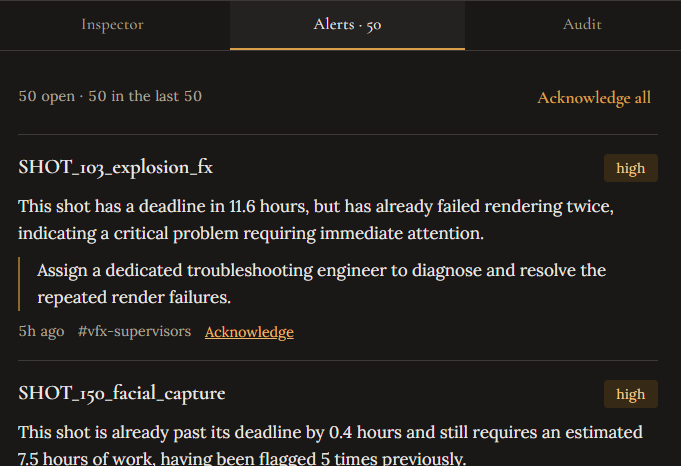
Alerts for high risk bottlenecks and also a acknowledge button when solved
-
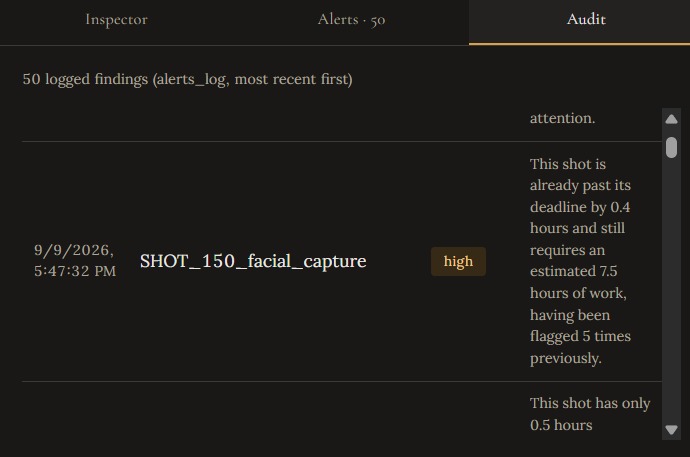
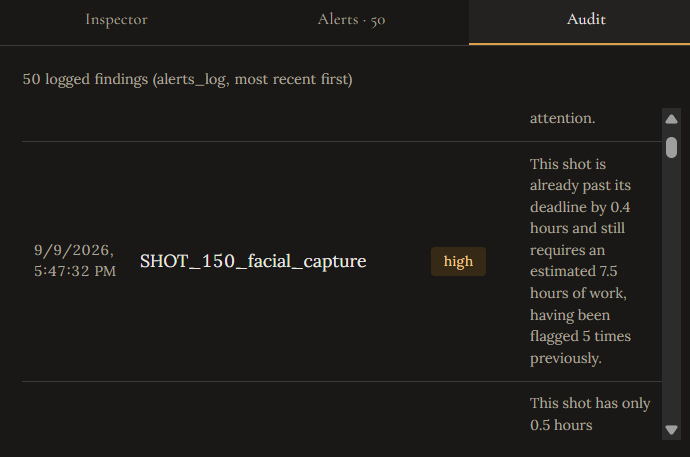
Detailed Audit of the Shot Sequence with time, date and an alert
Inspiration
Post-production is where deadlines quietly slip. VFX and render pipelines involve dozens of shots moving through queues, artists juggling multiple tasks at once, and render farms that can fall behind schedule silently — often invisible to supervisors until it's too late to course-correct. We wanted to build something that doesn't just show this data, but actively watches it, reasons about risk, and tells someone before a deadline is missed. That's where MIRAI came from — an AI production assistant that never sleeps.
What it does
MIRAI is an agentic monitoring system for a VFX render farm. It ingests render job data — queue status, artist assignments, render attempts, complexity, and deadlines — from Postgres, and runs a real observe → reason → decide → act loop on demand or on a schedule.
When a shot is falling behind — a stalled render, an overloaded artist, an underestimated complexity score — MIRAI doesn't just flag it. Gemini reasons about the specific causal reason it's at risk and recommends a concrete fix ("reassign SHOT_042 from Artist B at 95% capacity to Artist D at 30%"). Crucially, MIRAI also asks Grafana's own MCP server what it flagged in past cycles, so a shot that's been warned about three times and still isn't fixed gets escalated instead of repeating the same generic warning. High-severity findings are logged, pushed to Slack, and annotated directly onto a live Grafana dashboard — without a human asking.
The risk math itself is simple but drives everything downstream:
$$\text{risk_ratio} = \frac{\text{estimated_hours_remaining}}{\text{hours_until_deadline}}$$
A ratio above 1 means the remaining work literally cannot fit in the time left — that, combined with artist overload and failed-render history, is what Gemini reasons over.
How we built it
- Data layer: A Postgres database (
render_jobs,artists,alerts_log), seeded by a synthetic-but-plausible generator (seed_data.py) that deliberately assigns some high-complexity shots to already-overloaded artists and fails a few renders, so there's a real causal story for the agent to find. Hosted on Neon. - Observability: Three live Grafana Cloud panels backed by the same Postgres data source — a render-queue-status bar chart, a deadline-risk table color-coded red/orange/green by hours remaining, and an LCD bar gauge of artist capacity.
- Agent layer: The reasoning loop (
agent.py) calls Gemini directly via Google'sgoogle-genaiSDK. It talks to Grafana two ways: a REST call pushes an annotation onto the dashboard for every finding, and — because the hackathon's Grafana track specifically asks for MCP usage, not just any API call — a second integration spawns Grafana Cloud's official MCP server (mcp-grafana) over stdio and calls itsget_annotationstool every cycle, feeding "this shot has already been flagged N times" back into Gemini's prompt as a real signal. - Alerting: A Slack Incoming Webhook posts a formatted message the moment a finding is decided high-severity.
- Frontend: React + Vite, with two always-visible interactive node graphs (built on React Flow) — one showing the live agent pipeline (Postgres → Gemini → Decide → Slack/Grafana) animating in real time as a cycle runs, and one showing the artist/sequence workload topology with color-coded "blocking" edges. Both expand into a full pan-and-zoom view. Light/dark theme included.
- Deployment: Backend on Render, frontend on Vercel, kept warm with an external health-check ping — chosen deliberately because the rules don't require Google Cloud hosting, only that Google Cloud and the partner service are genuinely called at runtime.
Challenges we ran into
- The Grafana track's real requirement wasn't obvious at first. We initially built only a REST annotation push, which is genuinely "active use of the Grafana stack" — but the official rules specifically call out the Grafana Cloud MCP server as the expected integration path. We had to research
mcp-grafana's actual architecture (it's self-hosted over stdio, not a remote endpoint Grafana Cloud exposes per-stack), get a Python MCP client talking to it, and wire its output into the agent's actual reasoning — not just bolt it on unused. - A silent dependency conflict almost broke FastAPI. Installing the official
mcpSDK pulled in a newerstarlettethat broke FastAPI's app initialization outright. Since we only needed the MCP client (stdio transport), we pinnedstarletteback to a compatible range rather than upgrading FastAPI. - React Flow's
fitViewsilently failed on our custom nodes, clipping or mis-sizing the graphs depending on render timing. We ended up writing our own deterministic viewport calculator instead of trusting the library's auto-fit. - A Grafana rate limit once took down an entire agent cycle — a 429 on the annotation call was throwing before the database commit, silently dropping alerts that had nothing to do with Grafana. Fixed by making both the Slack and Grafana calls best-effort.
- Three hours before the deadline, we still needed a live URL. A GUI-only
gcloudinstaller hung with no way to script past it, so we pivoted to Render + Vercel — both GitHub-connected, zero local install — and verified a full end-to-end agent cycle in production before submitting.
Accomplishments that we're proud of
- A genuinely agentic loop — not a chat wrapper — where Gemini's own output changes cycle-to-cycle based on real history pulled live from Grafana's MCP server.
- Real, verified runtime integration with both Google Cloud (Gemini) and Grafana (REST + MCP), confirmed live in production, not just in local dev.
- A supervisor UI that makes the agent's reasoning visible and legible at a glance instead of hiding it in logs — the pipeline graph literally animates as the agent thinks.
What we learned
- How to build a real MCP client from scratch against an official MCP server — most tutorials cover the reverse.
- The practical difference between "imported" and "actually called at runtime" — and why hackathon judges (rightly) check for the latter.
- That a dashboard shows you a problem; an agent tells you why it happened and what to do about it.
What's next for MIRAI
- Integrating with real render farm software (Deadline, Tractor, etc.) instead of synthetic data
- Predictive risk scoring based on historical shot complexity and artist performance
- Expanding beyond VFX into editorial and sound post-production pipelines
Built With
- agent-builder
- cloud-functions
- gemini
- gemini-enterprise
- google-cloud
- grafana
- grafana-cloud
- postgresql
- python
- react
- rest-api
- slack-api

Log in or sign up for Devpost to join the conversation.