-
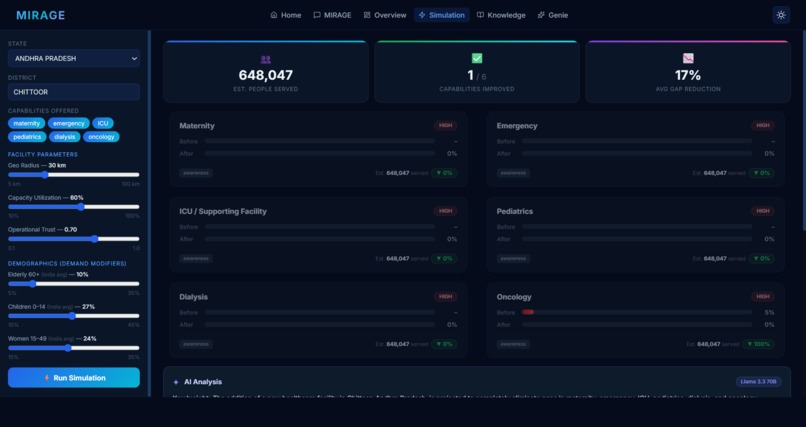
Simulation
-

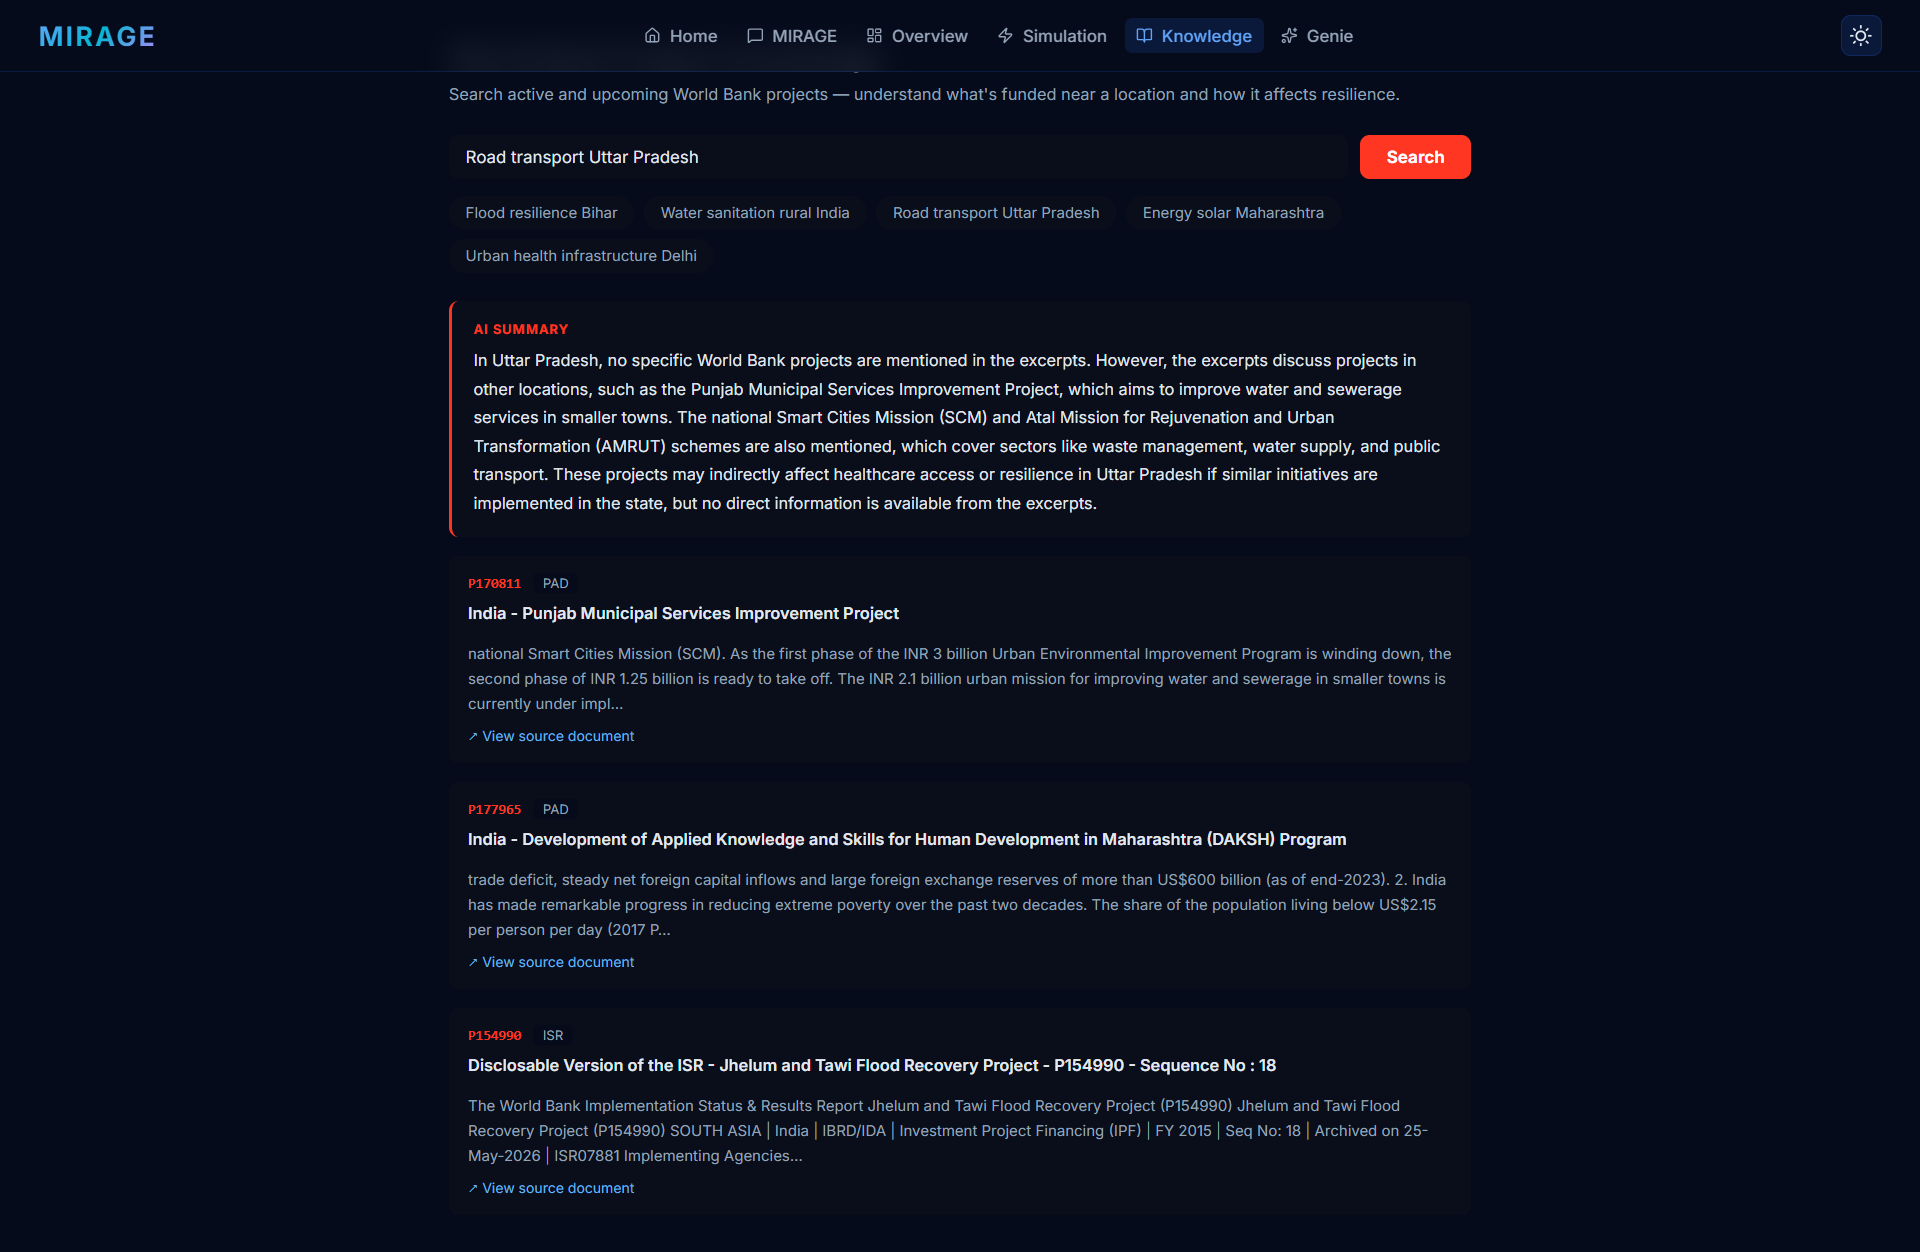
Knowledge_Worldbank projects
-
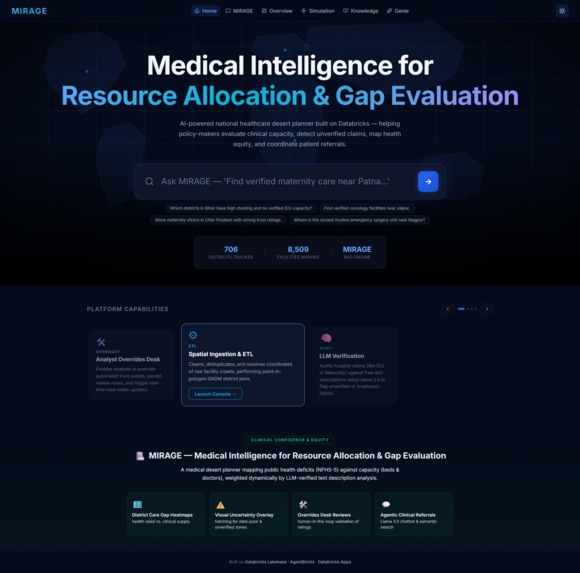
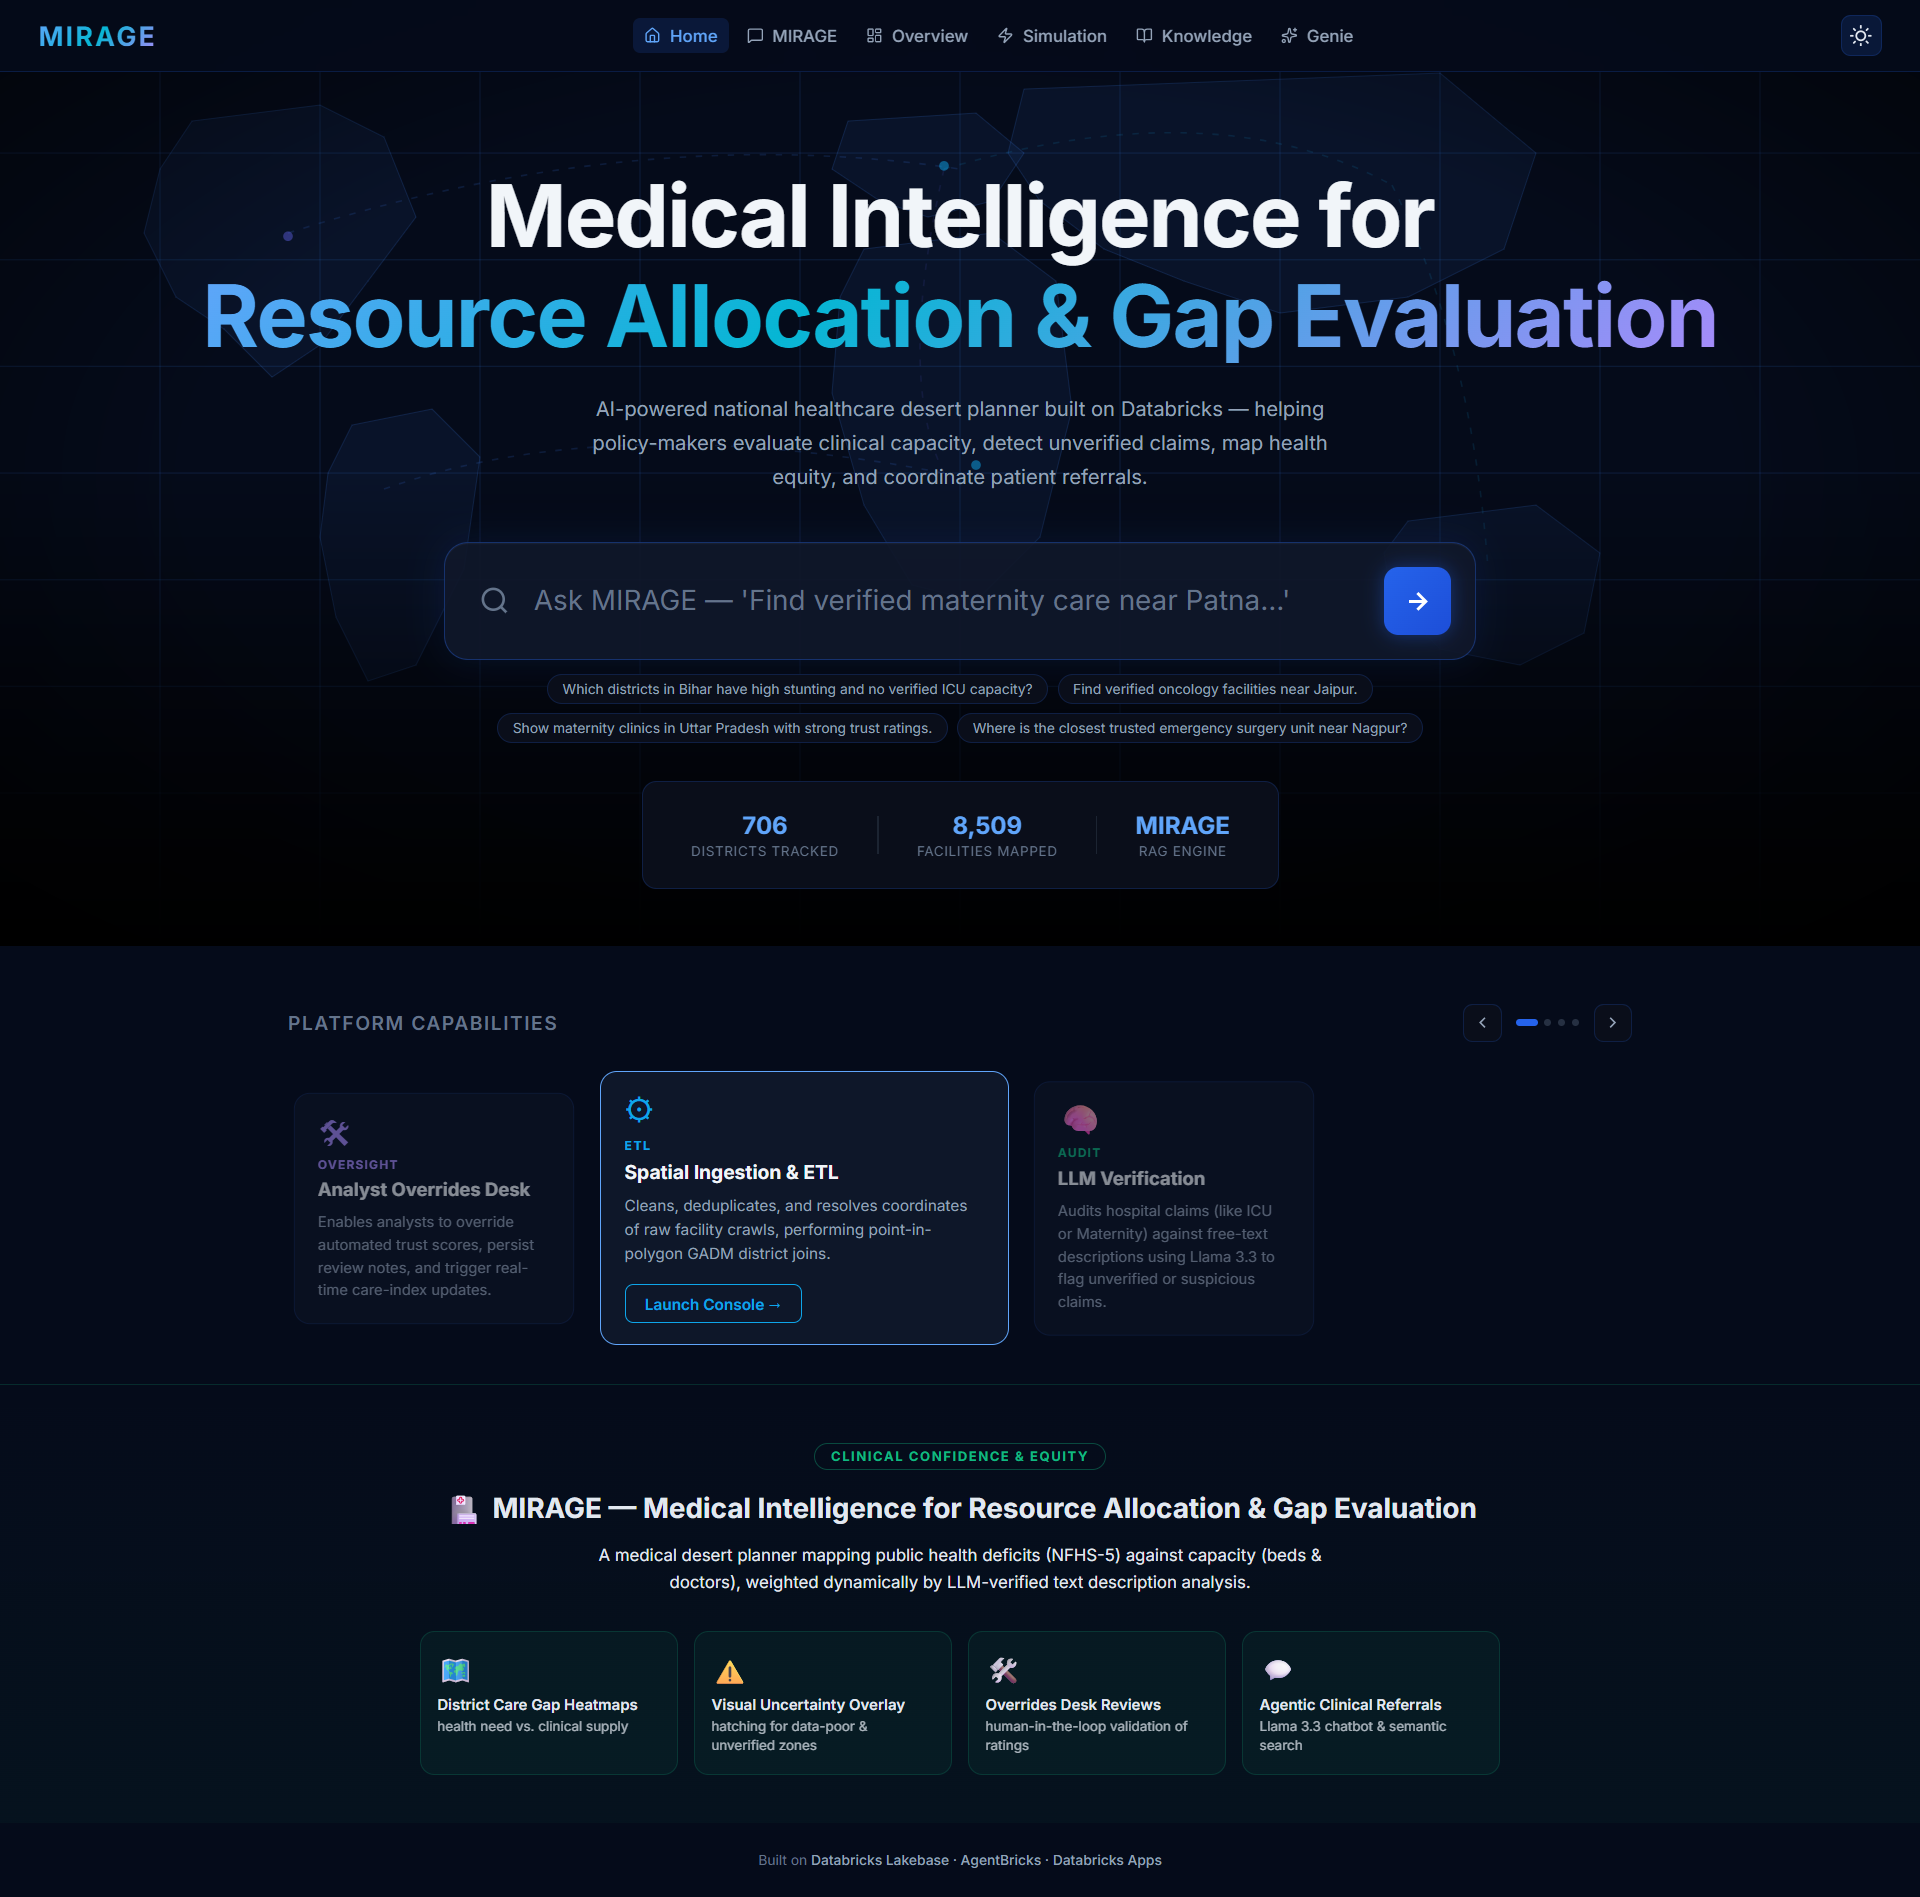
Home page
-
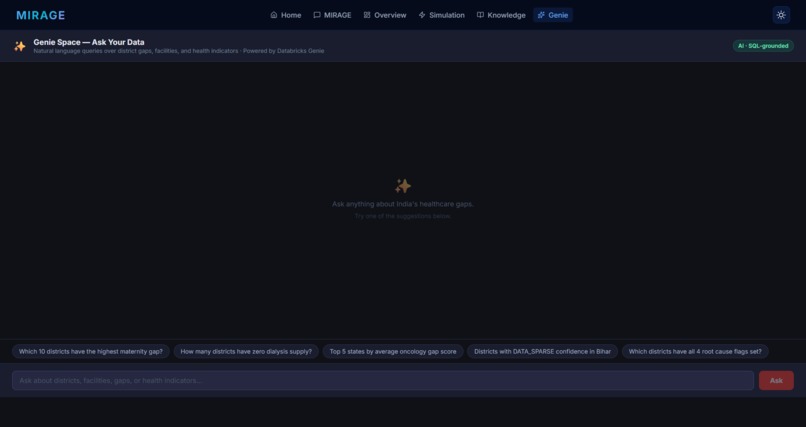
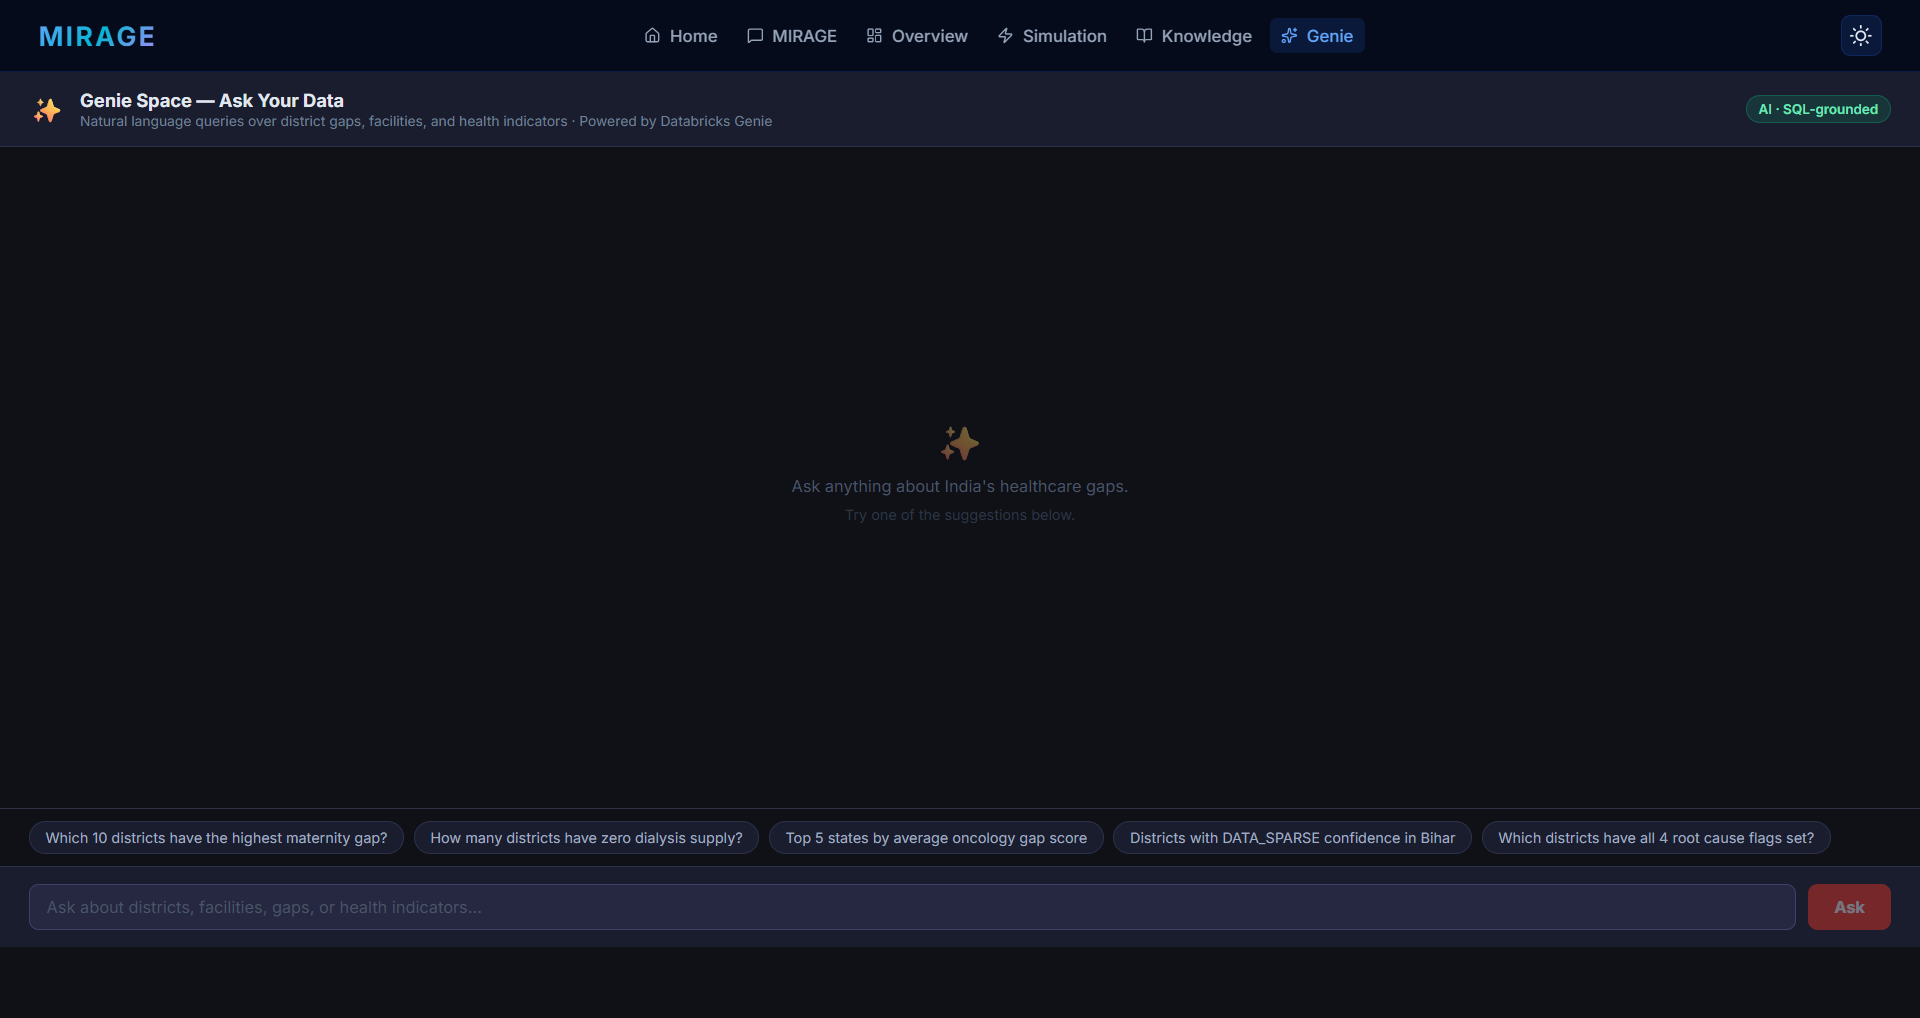
Genie Space
-

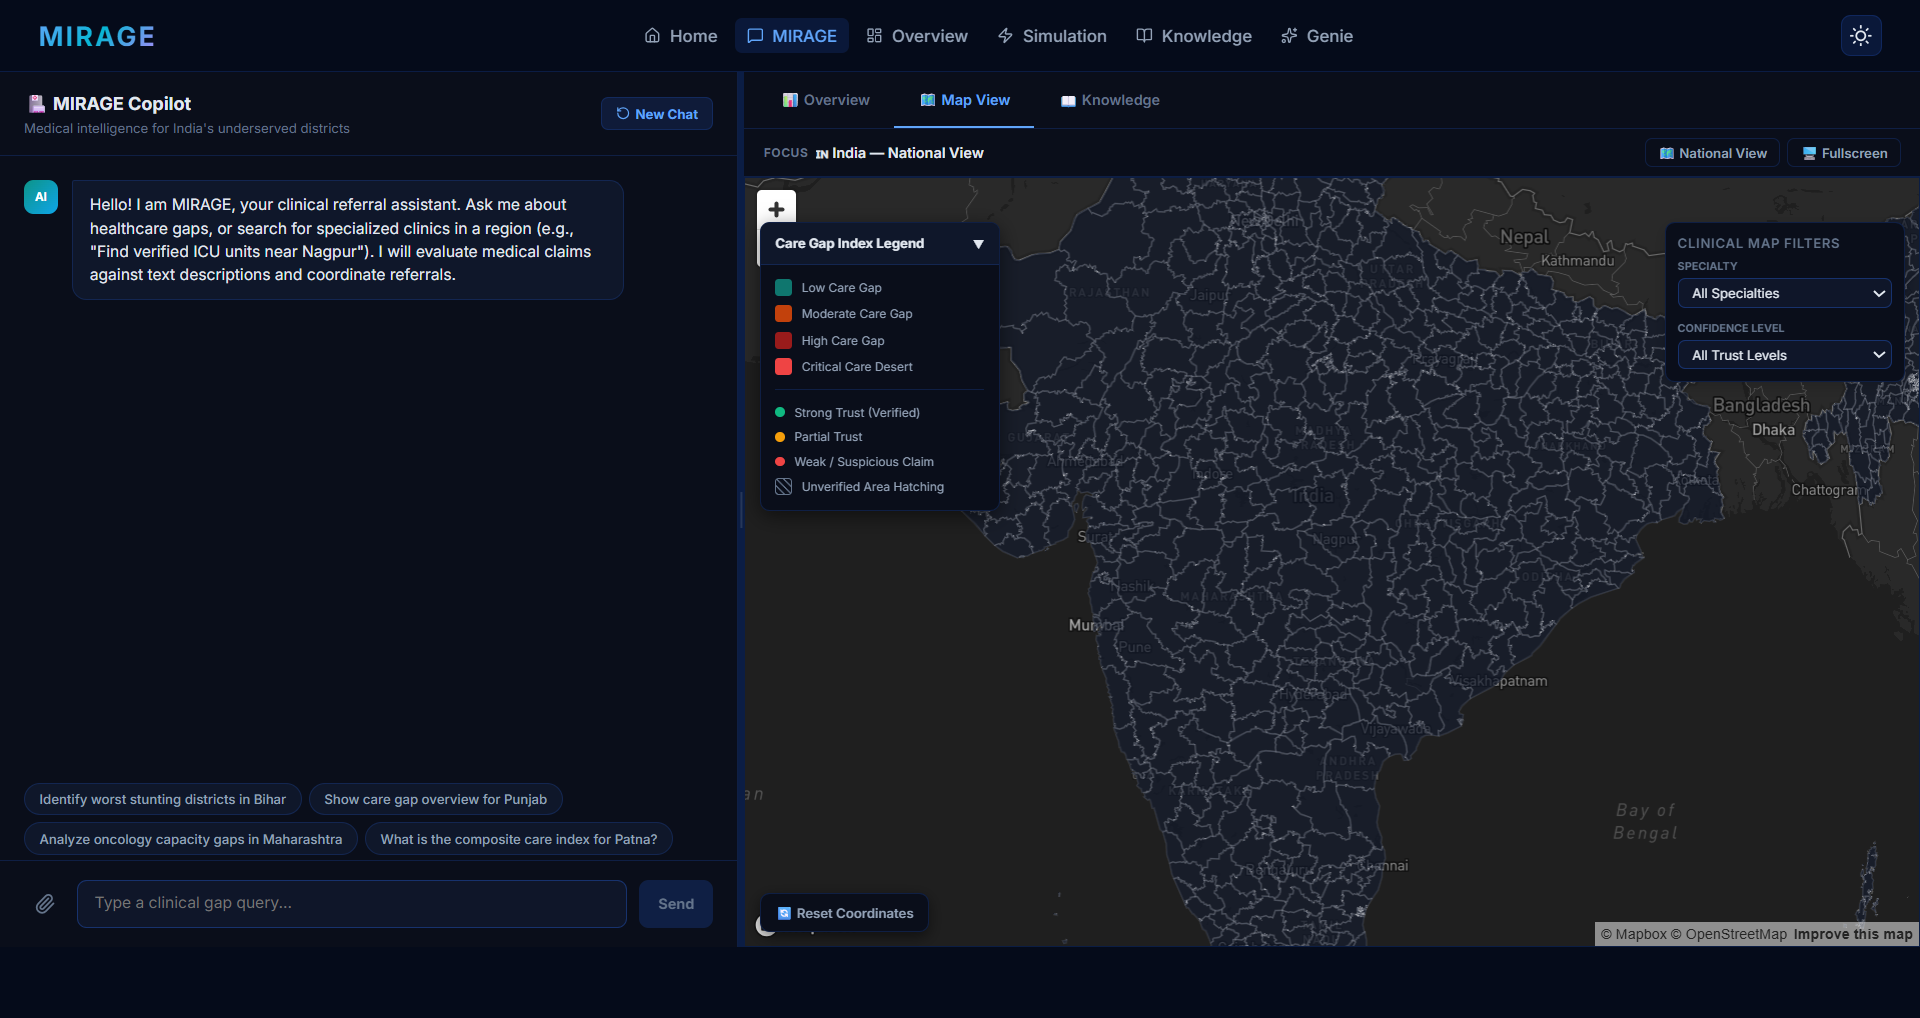
Map

Inspiration
Every year, healthcare planners allocate millions in infrastructure funding based on a dangerous illusion — a blank data field looks identical to a real medical desert. Funding flows to regions simply because no one measured them, while genuine crises go unaddressed.
We asked: what if the map itself could tell you when it doesn't know?
That question became MIRAGE — Medical Intelligence for Resource Allocation & Gap Evaluation — built entirely on Databricks, for planners who need to act on evidence, not assumptions.
What It Does
MIRAGE gives health system planners a trustworthy, evidence-grounded view of healthcare gaps across India's districts — distinguishing real care deserts from data deserts.
| Feature | Description |
|---|---|
| Interactive District Map | Trust-weighted facility coverage overlaid with NFHS-5 demand signals, color-coded by confidence tier |
| Drill-Down Panel | Per-district facility list with evidence trail, trust score, and gap reasoning |
| Genie Chat | Natural-language Q&A grounded in cited data rows — never free-floating AI claims |
| What-If Simulator | Model the impact of a new facility with all assumptions shown transparently |
| Root-Cause Diagnosis | Evidence-gated barrier labels (affordability, access, quality, awareness) |
| Knowledge Tab | Semantic vector search over World Bank projects for relevant past interventions |
How We Built It
Built entirely on the Databricks platform using a medallion architecture:
$$\text{Raw Sources} \xrightarrow{\text{Bronze}} \text{Ingested} \xrightarrow{\text{Silver}} \text{Validated & Joined} \xrightarrow{\text{Gold}} \text{Gap Scores & Confidence}$$
Data Pipeline
| Layer | What Happens |
|---|---|
| Bronze | Raw ingestion — ~10,000 facility records, India Post pincode directory, NFHS-5 district indicators |
| Silver | Spatial point-in-polygon joins; per-facility trust scoring |
| Gold | District gap scores, confidence tiers, root-cause tables, planning metrics |
Trust Scoring
Each facility receives a composite trust score \( T_f \):
$$T_f = w_1 \cdot s_{\text{source}} + w_2 \cdot s_{\text{staff}} + w_3 \cdot s_{\text{social}} + w_4 \cdot s_{\text{recency}}$$
where \( w_1 + w_2 + w_3 + w_4 = 1 \) and each \( s_i \in [0, 1] \).
District Gap Score
The supply-side weighted coverage for a district \( d \) is:
$$C_d = \frac{\sum_{f \in d} T_f \cdot \mathbb{1}[\text{service} \in f]}{P_d / R}$$
where \( P_d \) is district population and \( R \) is the reference population-per-facility ratio. A gap is flagged when \( C_d < \theta \) and the NFHS-5 burden indicator \( B_d > \phi \).
Databricks Capabilities Used
- Delta Lake — versioned, ACID-compliant data foundation
- Lakebase — operational Postgres layer powering live app queries
- Unity Catalog — governed access with full data lineage
- Mosaic AI / Agent Framework — orchestrates planning chat and root-cause pipeline
- Genie Spaces — natural-language Q&A grounded in verified district data
- Vector Search — semantic retrieval over World Bank knowledge base
- Databricks Apps — full-stack deployment of React frontend + Python backend
Challenges We Ran Into
The 77% String-Match Problem
Naively joining NFHS-5 district names to the pincode directory by string matching succeeded only \( \approx 77\% \) of the time due to transliteration inconsistencies and abbreviations. We replaced this with a spatial point-in-polygon join using ST_Contains(polygon, ST_Point(lon, lat)) — robust, unambiguous, and aligned with the hackathon's own data guidance.
Resisting the Temptation to Hallucinate
It is trivially easy to have an LLM generate a root-cause explanation for any district. The hard engineering challenge was preventing it — building evidence gates so the system stays silent rather than guessing when no supporting data column is present:
$$\text{Diagnosis} = \begin{cases} \text{label} & \text{if } \exists \text{ column } c \text{ s.t. } c_d > \tau_c \ \textit{"insufficient evidence"} & \text{otherwise} \end{cases}$$
GeoJSON District Boundary Alignment
Canonical alignment of \( \sim 700 \) district polygons across multiple boundary sources with inconsistent naming and coordinate projections required significant preprocessing before spatial joins were reliable.
Demo-Time API Risk
Live Google Maps calls for sparse districts risked quota failures during judging. We pre-cached responses for all known DATA_SPARSE districts to make the live demo bulletproof.
Accomplishments We're Proud Of
A three-tier confidence system that most coverage maps skip entirely:
$$\text{Confidence} = \begin{cases} \textbf{HIGH} & B_d > \phi \text{ and } C_d < \theta \text{ and clean spatial match} \ \textbf{MEDIUM} & \text{partial data — one signal present, not both} \ \textbf{DATA_SPARSE} & \text{district absent from NFHS-5 or no geo-matched facilities} \end{cases}$$
- Evidence-gated recommendations — every root-cause label requires a specific NFHS-5 column to clear a threshold \( \tau \) before surfacing
- ~97% geolocation usability across 10,000 facility records after spatial validation
- Cited AI answers — Genie chat traces responses to source rows, not free-text generation
- Full Databricks stack integration — Delta Lake, Lakebase, Vector Search, Unity Catalog, Agent Framework, Genie Spaces, and Databricks Apps unified in one planning workflow
What We Learned
Uncertainty is a feature, not a bug. The most valuable output isn't the gap score — it's the
DATA_SPARSEtier. Knowing where you don't know is as actionable as knowing where gaps exist.Spatial joins are non-negotiable for India health data. String matching is a trap; coordinates don't lie. The gain is measurable:
$$\text{Match rate: string} \approx 77\% \quad \longrightarrow \quad \text{spatial} \approx 97\%$$
Evidence gates make AI trustworthy in high-stakes domains. An LLM that says "I don't have enough data to diagnose this" builds more trust with a health planner than one that confidently generates an explanation every time.
Databricks as a full-stack platform — data engineering, vector search, agent orchestration, operational database, and app hosting can all be unified without leaving the platform.
What's Next for MIRAGE — Health Care Compass
- Census 2021 integration — replace the 2011 population denominator \( P_d \) with updated figures, with explicit staleness warnings until then
- Global rollout — the confidence-scoring framework is geography-agnostic; next target is Sub-Saharan Africa using WHO SARA survey data
- Longitudinal gap tracking — compare \( C_d^{\text{NFHS-4}} \) vs \( C_d^{\text{NFHS-5}} \) to surface improving vs deteriorating districts, not just current snapshots
- Facility verification workflow — field workers submit ground-truth updates that flow back into trust scoring via Lakebase
- Policy scenario library — save and share what-if simulations across planning teams, with full version history in Delta Lake
- Real-time HMIS integration — connect to national health management data streams for near-live facility operational status
Built With
- agents
- fastapi
- lakebase
- llm
- machine-learning
- medallion
- pyspark
- react
- unitycatalog

Log in or sign up for Devpost to join the conversation.