Celonis TOHacks Challenge
Part 1
Question) Let’s take a minute to get our bearings. If you’ve been poking around the tool, navigate back to “Pizza Carbon Emissions- large dataset” in the business views section at the top of our home page (hint: refer to the image above). Let's start with our home page, the CO2 Dashboard Tab (also known as the first workspace tab for Pizza Carbon Emissions). Here, we can see all the different modes of pizza transportation that Pizzeria Mamma Mia takes, and the different locations that the Pizza shop can deliver to. Let’s filter out by the pizzas that get delivered to Munich District 1 - the closest district to the pizzeria. What method of transportation does the pizza take to Munich District 1, and how much Co2 emissions does this mode of transport generate yearly?
Answer: a. Bike, 236 kg
Question) Navigate to our Co2 Drill Down tab on the bottom of the screen. Navigate to the variant explorer. How many different variants are there for Pizzeria Mamma Mia?
Answer: d. 207
Question) Let’s look at some of the different variants. Of the first 5 variants, which has the longest throughput time?
Answer: c. 3
Question) What do you think happens in Variant 5 that delays the pizza making process?
Answer: Variant 5 seems to be one of the faster variants. The longest step is between “Starting baking pizza” and “Payment customer”. I think the bottleneck at this step is the time it takes for the pizza dough to get fully cooked. The baking and customer payment steps should happen in parallel to avoid any unnecessary delays.
Question) For Variant 4, how many trees would Pizzeria Mamma Mia have to plant to offset their emissions? *Hint, you’ll have to filter by variant 4, then change tabs to find your answer
Answer: c. 19
Question) Navigate to the “Rework Rate” tab. What is the rework rate* for January 2018?
Answer: b. 39%
Question) Navigate to the Co2 Drill Down tab. Look at which of the customer groups generates the most revenue (adult, teenager, senior, student). Filter out this user group with the highest revenue generated. Take 5 minutes to explore the variants for this user group, and the breakdown of carbon emission coming from this customer group’s orders. Then, write below 2-3 ideas on ways to keep these loyal customers, while cutting down on their carbon footprint.
Answer: Students generate the most revenue. I was surprised to see that variant 1 is 41 minutes long, in which the “Pizza arrives at customer” to “Payment customer” step takes the longest. To speculate it appears that customers are either not aware that the pizza has arrived or take a very long time to pick it up in their lobby/front door. This long delay is likely contributing to the high carbon footprint despite students predominantly living nearby in District One where the delivery time is on average 5 minutes. To keep these loyal customers, and cut down on their carbon footprint a few ideas come to mind:
It would be great for Pizzeria Mamma Mia to provide notifications when the Pizza has departed and arrived. A mobile application or even a phone call telling the customers to meet them at the lobby would speed up the process.
An option to pay through a web application or mobile application and simply drop off the pizza at the customers doorsteps would also speed up the process.
A way to incentivize customers to pick up the pizza themselves and altogether avoid the pizza delivery process would be ideal. Some sort of points system that encourages customers to pick up the pizza in person (2 points), or awards customers for paying for pizza quickly upon arrival (1 point) and get one free pizza every 10 or 20 purchases. This would encourage more pizza purchases, because customers would want to acquire more points and reduce the carbon footprint.
Challenge OPTIONAL Part 2: Make your own Workspace
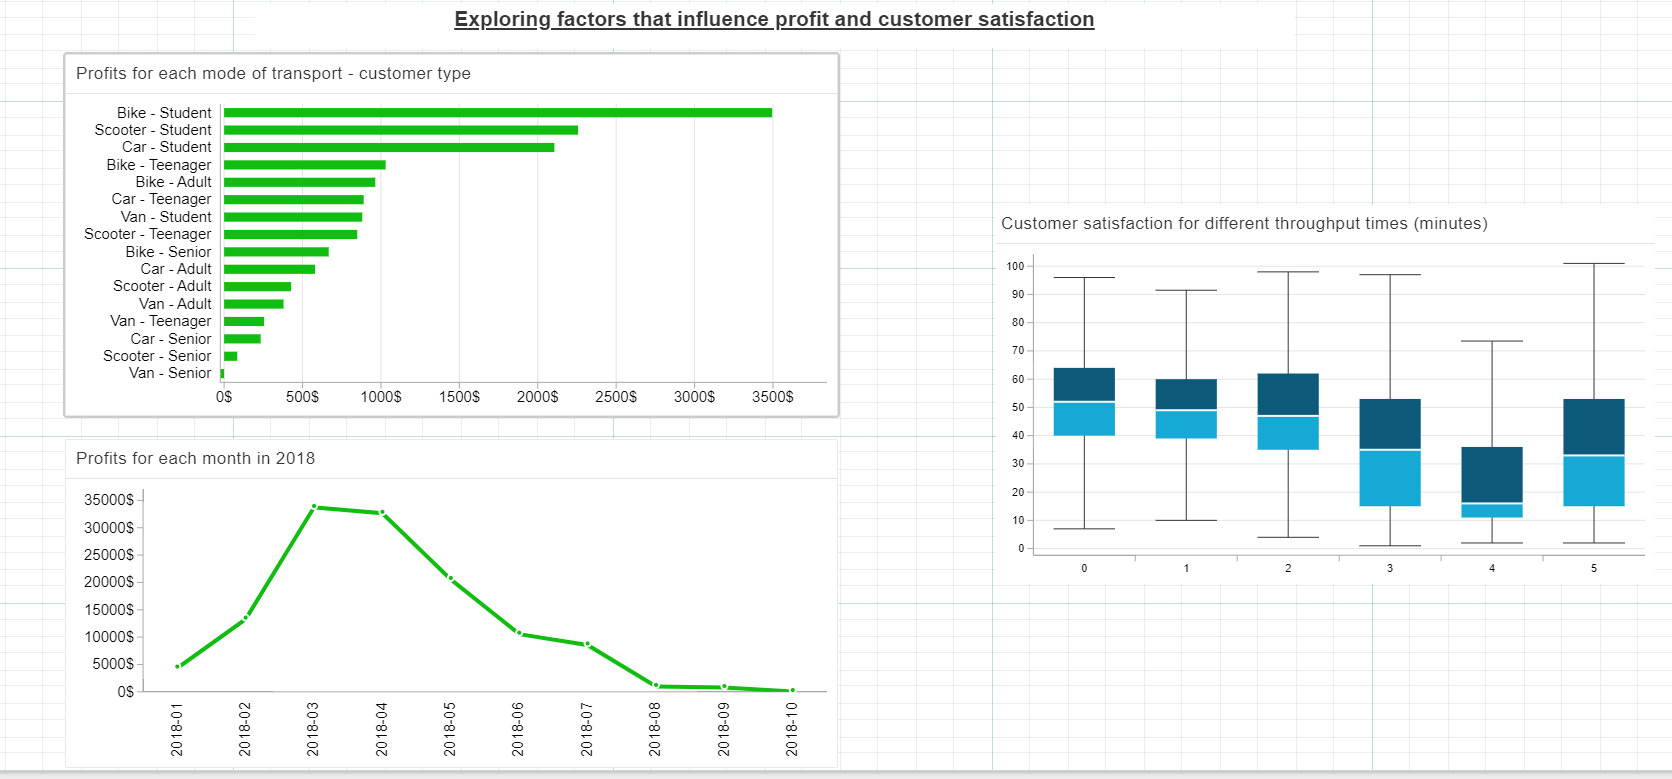
The carbon footprint of a van is the highest among the different modes of transportation. Additionally seniors order the least number of pizzas. In the first figure I identified that this pattern also translates to the smallest profit for the business. Vans are the least profitable mode of transportation for each customer type. Seniors are also the least profitable customers. I think it would improve profit, and the carbon footprint if vans were altogether removed, and cars were used instead for distant deliveries. Also introducing a healthy pizza with fresh vegetables, that may be more costly to produce (sold at a higher price as well) may improve sales with seniors.
I also explored Pizza Mamma Mia's profit throughout the year. March and April stand out as having by far the most profit, whilst the months August, September and October generated close to $0 in profit. It would be worthwhile to further examine if there are less customers in these latter months and/or the costs of operations are much higher during these months.
Lastly the customer satisfaction rating from 0-5 was explored against the throughput time of a pizza order. As expected customers were least satisfied when the throughput time on average was from 45 to 55 minutes long (rating of 0 to 2). An average throughput time under 15 minutes resulted in very satisfied customers (rating of 4). Throughput time is not the only factor influencing customer satisfaction, which is clear if we compare the average throughput time for rating 3 and rating 5, which are both around 35 minutes.
What it does
Explores the Pizza Mamma Mia dataset
How we built it
Celonis
Challenges we ran into
Writing custom PQL commands
Accomplishments that we're proud of
Identified factors that influence profit and customer satisfaction, which are worth exploring further!
What we learned
How to utilize Celonis for process data mining!
What's next for Mining_Pizzeria_data
Exploring the data further to identify the least profitable and most environmentally damaging aspects of Pizza Mamma Mia's business in order to fix them.
Built With
- celonis
- pql

Log in or sign up for Devpost to join the conversation.