Inspiration
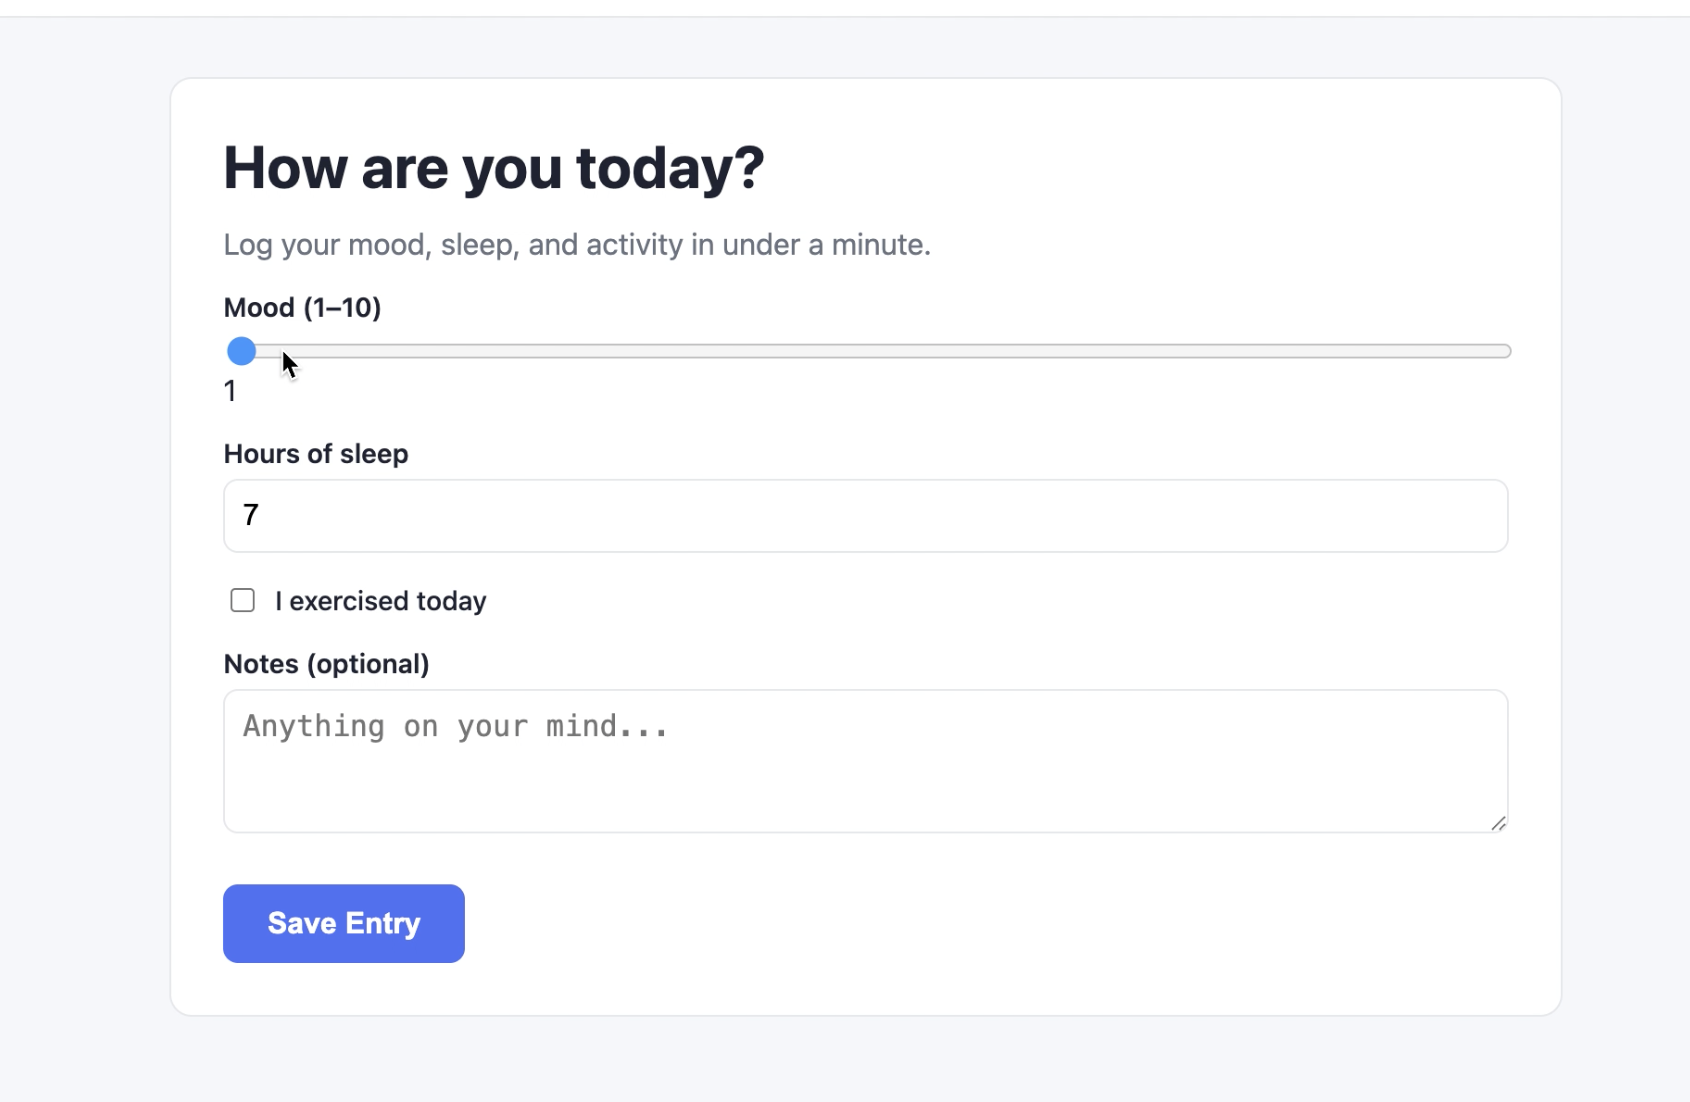
Mental health check-ins often get skipped because they feel like a chore. We wanted logging your mood to take under a minute, while still surfacing insights people actually act on.
What it does
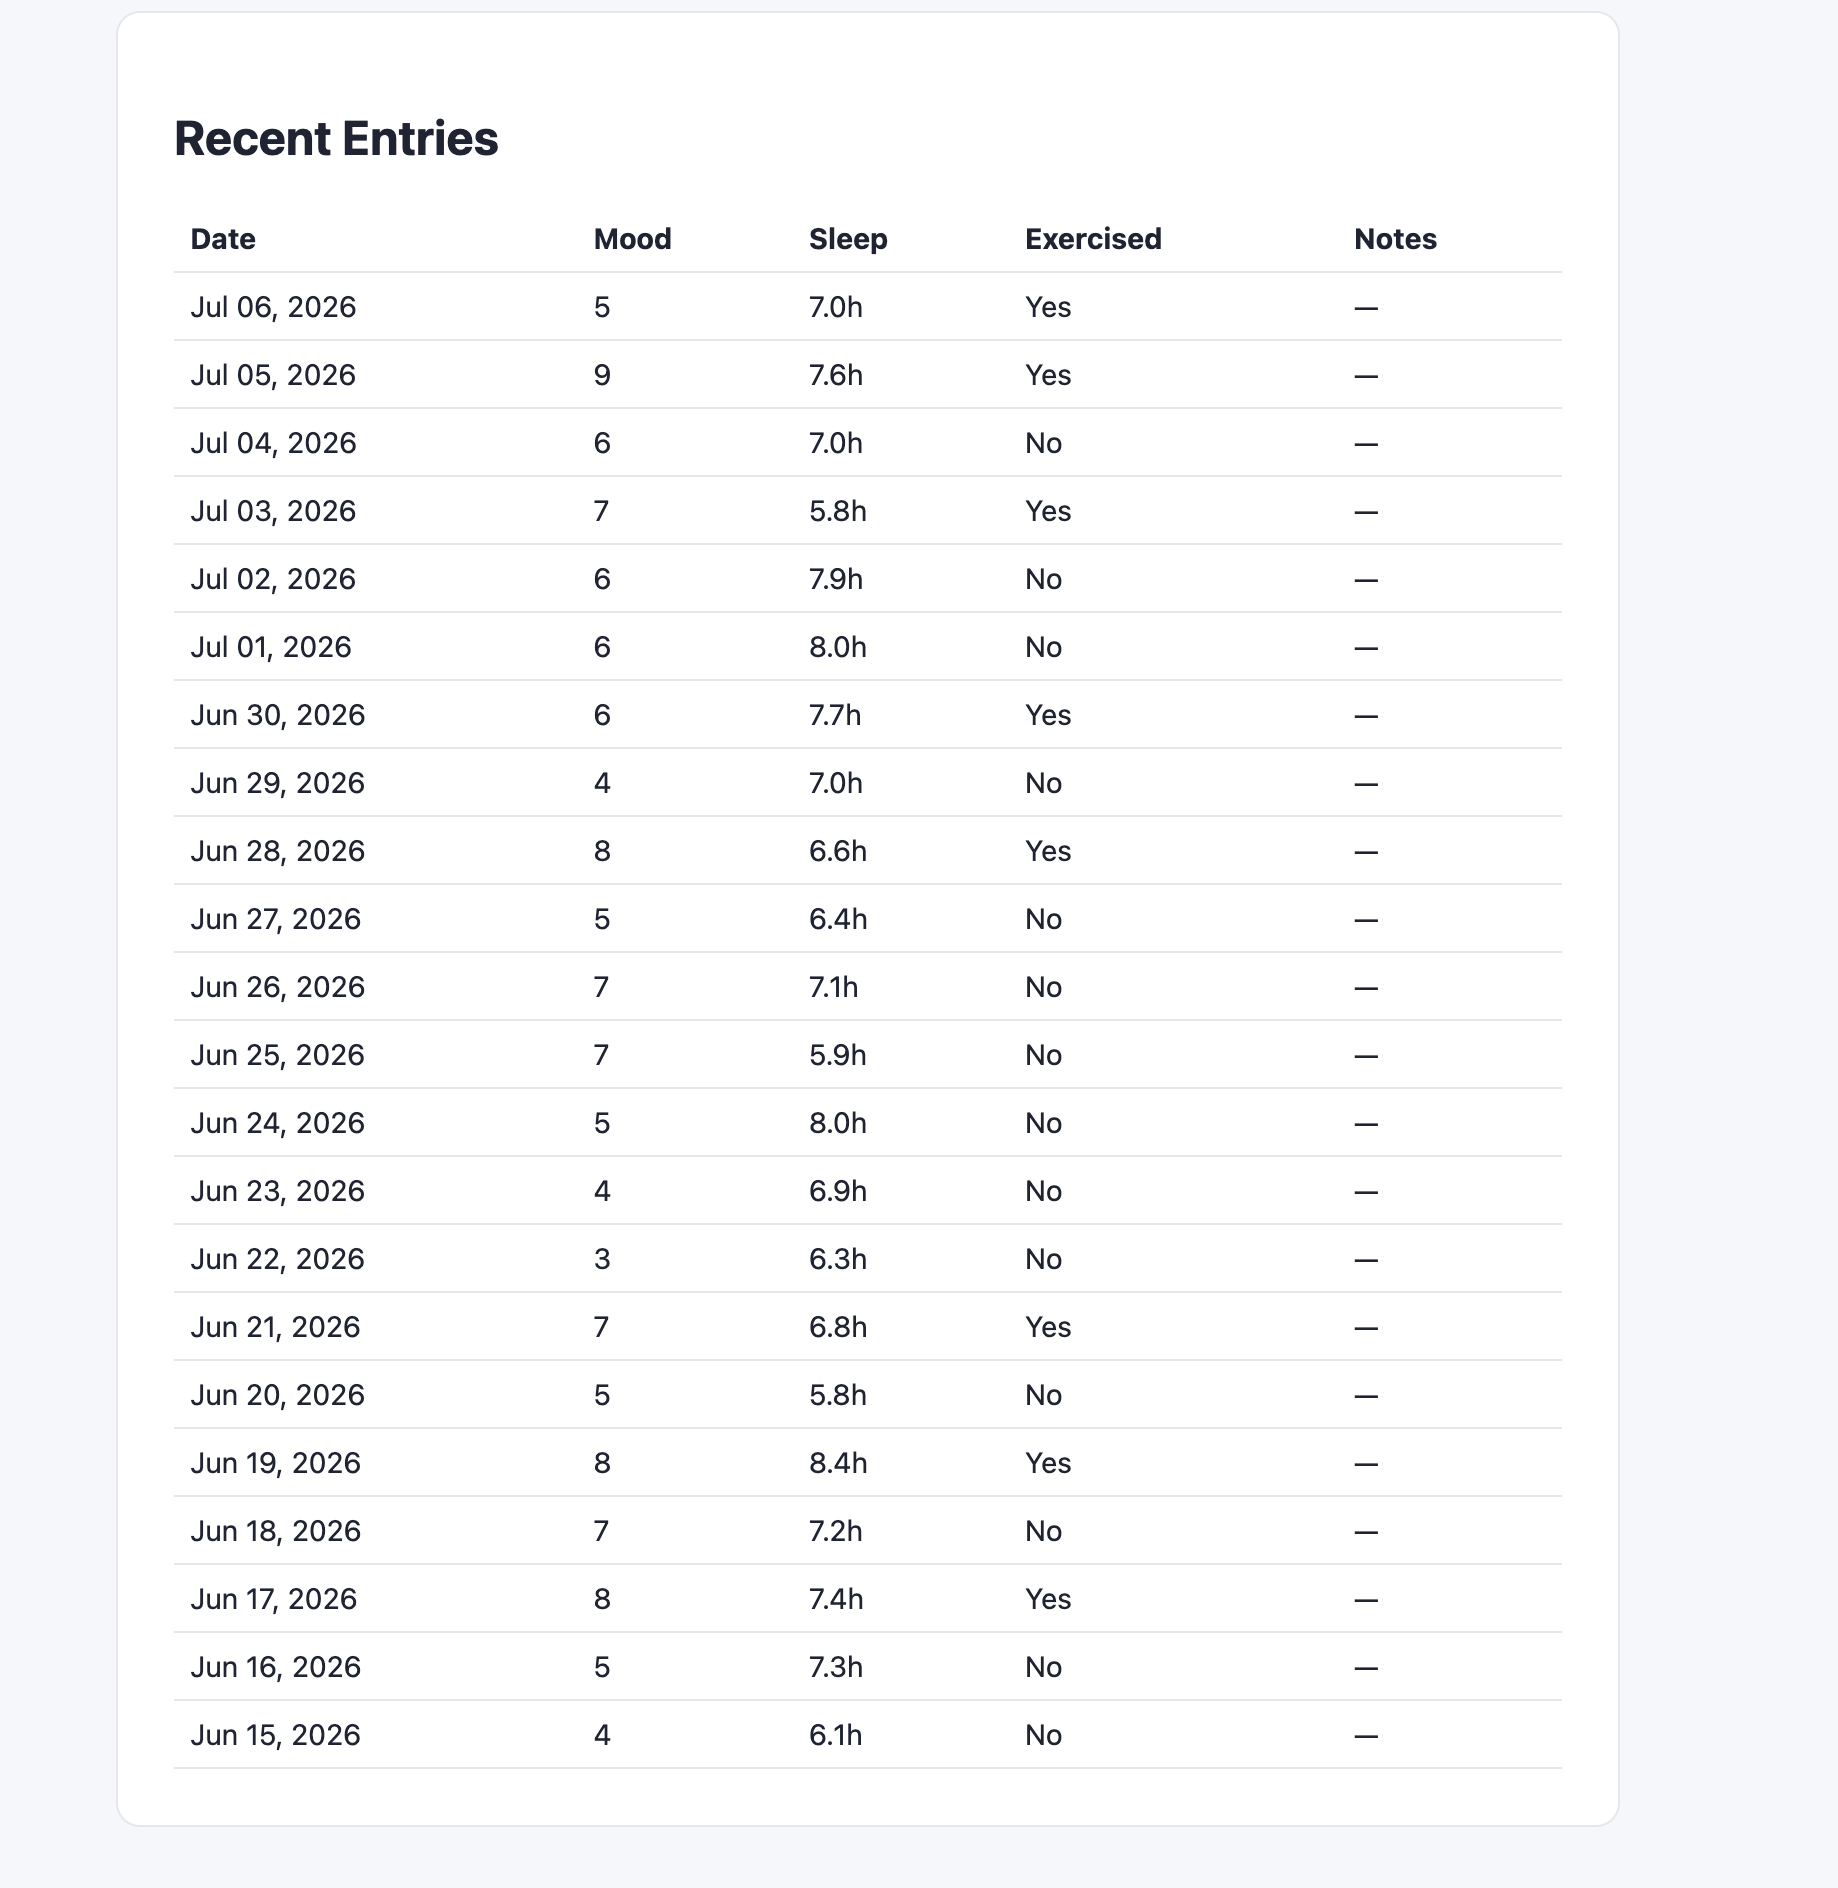
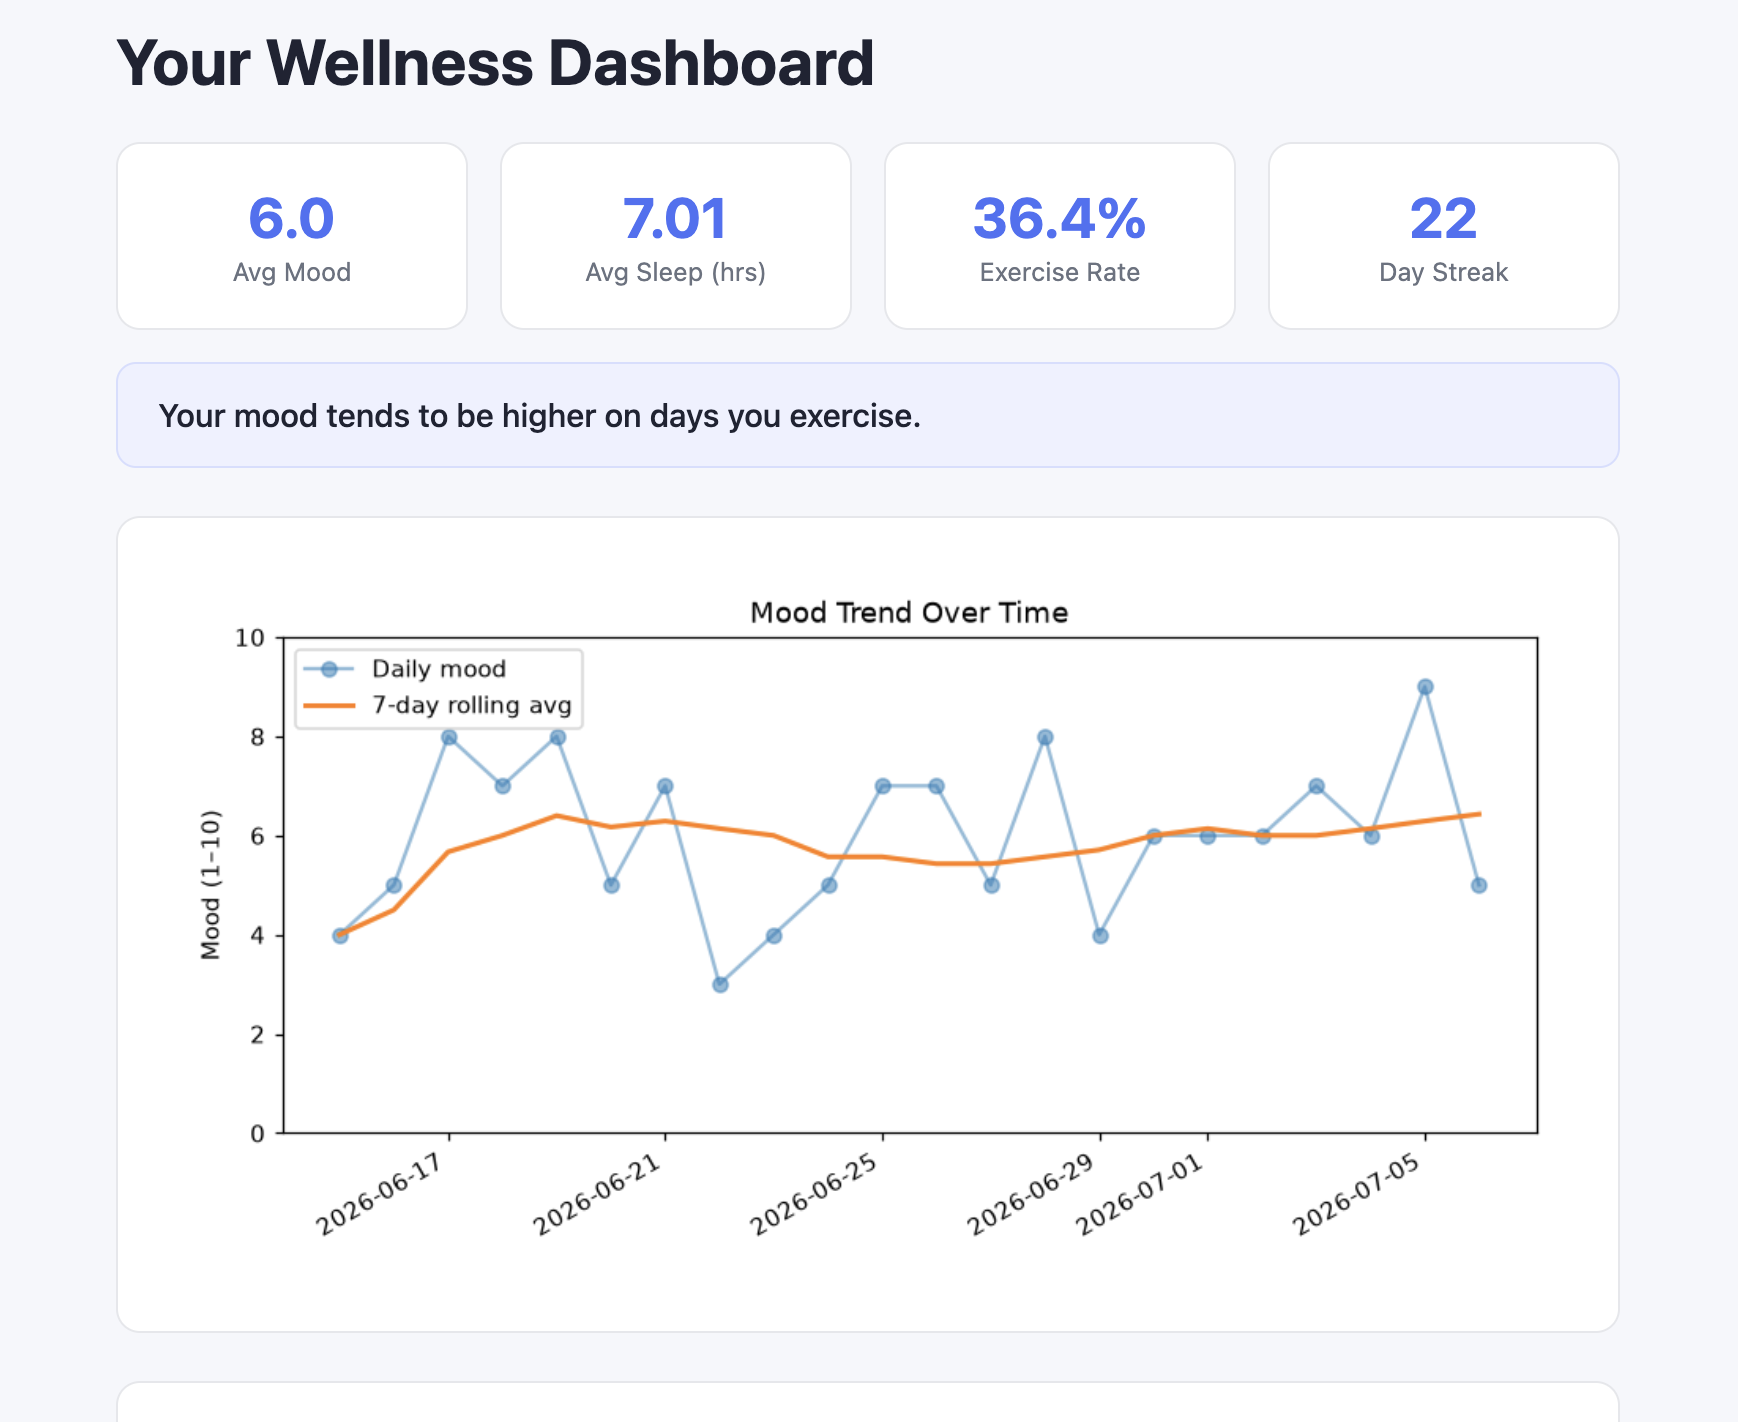
MindTrack lets users log daily mood, sleep hours, and exercise. It then computes rolling mood/sleep averages, tracks a daily logging streak, and generates a simple insight — like whether mood tends to be higher on days the user exercises.
How we built it
Built with Flask and SQLite for the backend, Pandas for trend analysis, and Matplotlib for the embedded mood trend chart. The codebase is split into clear modules — db.py for storage, analytics.py for trend/streak logic, charts.py for visualization, and routes.py for the web layer — keeping each concern independent and testable.
Challenges we ran into
Balancing simplicity (a form that takes seconds to fill out) with useful analytics (rolling averages, streaks, correlation-style insights) without over-engineering the tool.
What's next
Mood-tag categorization, weekly email summaries, and exportable health reports for use in therapy or doctor visits.

Log in or sign up for Devpost to join the conversation.