-
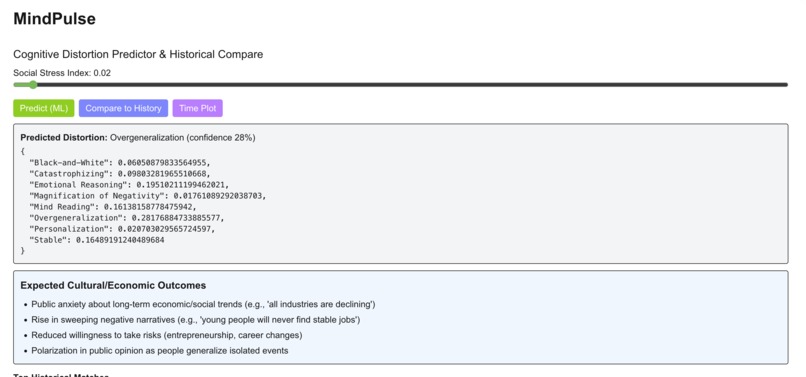
When stress index is 0.02
-

plotting and historical compare
Inspiration
The idea for MindPulse emerged from a simple observation: most mental health-focused data projects fixate on individual well-being, but collective psychological patterns—shaped by societal stressors like economic downturns, wars, or pandemics—have equally profound impacts on culture, policy, and daily life. I was particularly drawn to the UN Sustainable Development Goals (SDGs) #3 (Good Health and Well-Being), #10 (Reduced Inequalities), and #16 (Peace, Justice, Strong Institutions) and realized that collective cognitive distortions act as a hidden link between social stress and these global goals. For example, periods of high polarization often erode social cohesion, while catastrophizing during crises can hinder rational policy-making.
What it does
MindPulse is an interactive, data-driven tool that bridges collective psychology, history, and social science to turn "social stress" into actionable insights. Its core purpose is to help users understand how societal pressure shapes shared ways of thinking—and what those thought patterns mean for culture, economics, and policy. Here’s its key functionality:
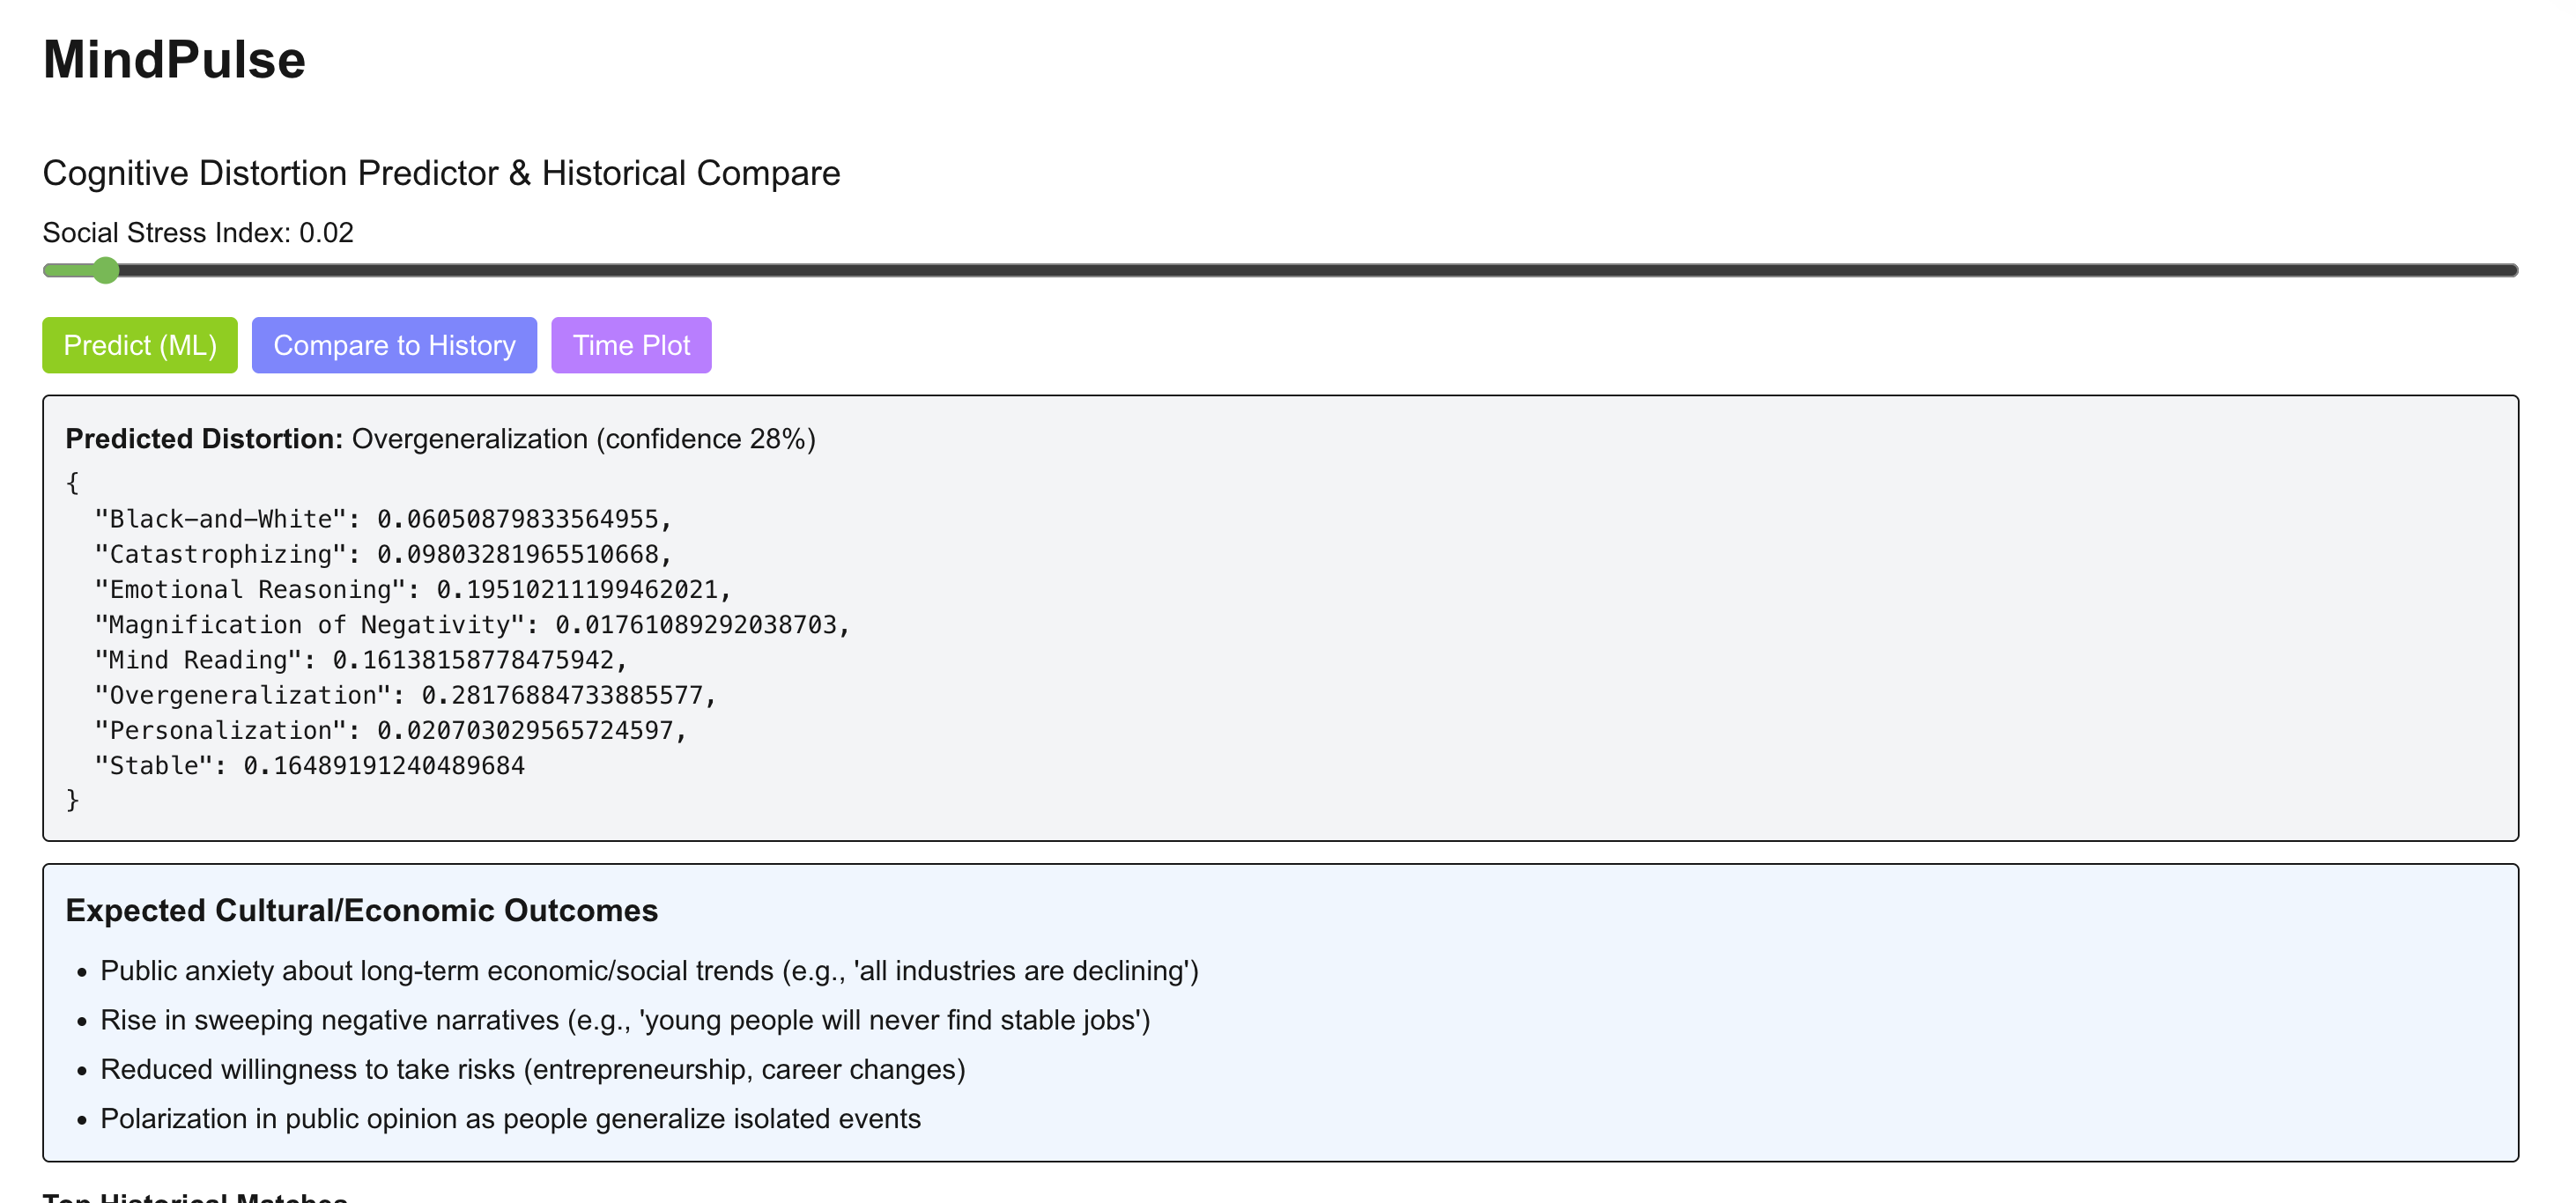
Stress Input & Distortion Prediction: Users adjust a "Social Stress Index" slider (0–1) or input metrics like unemployment, news negativity, or social media sentiment. The tool outputs the dominant collective cognitive distortion (e.g., catastrophizing, black-and-white thinking) via a machine learning model or rule-based fallback, complete with confidence scores.
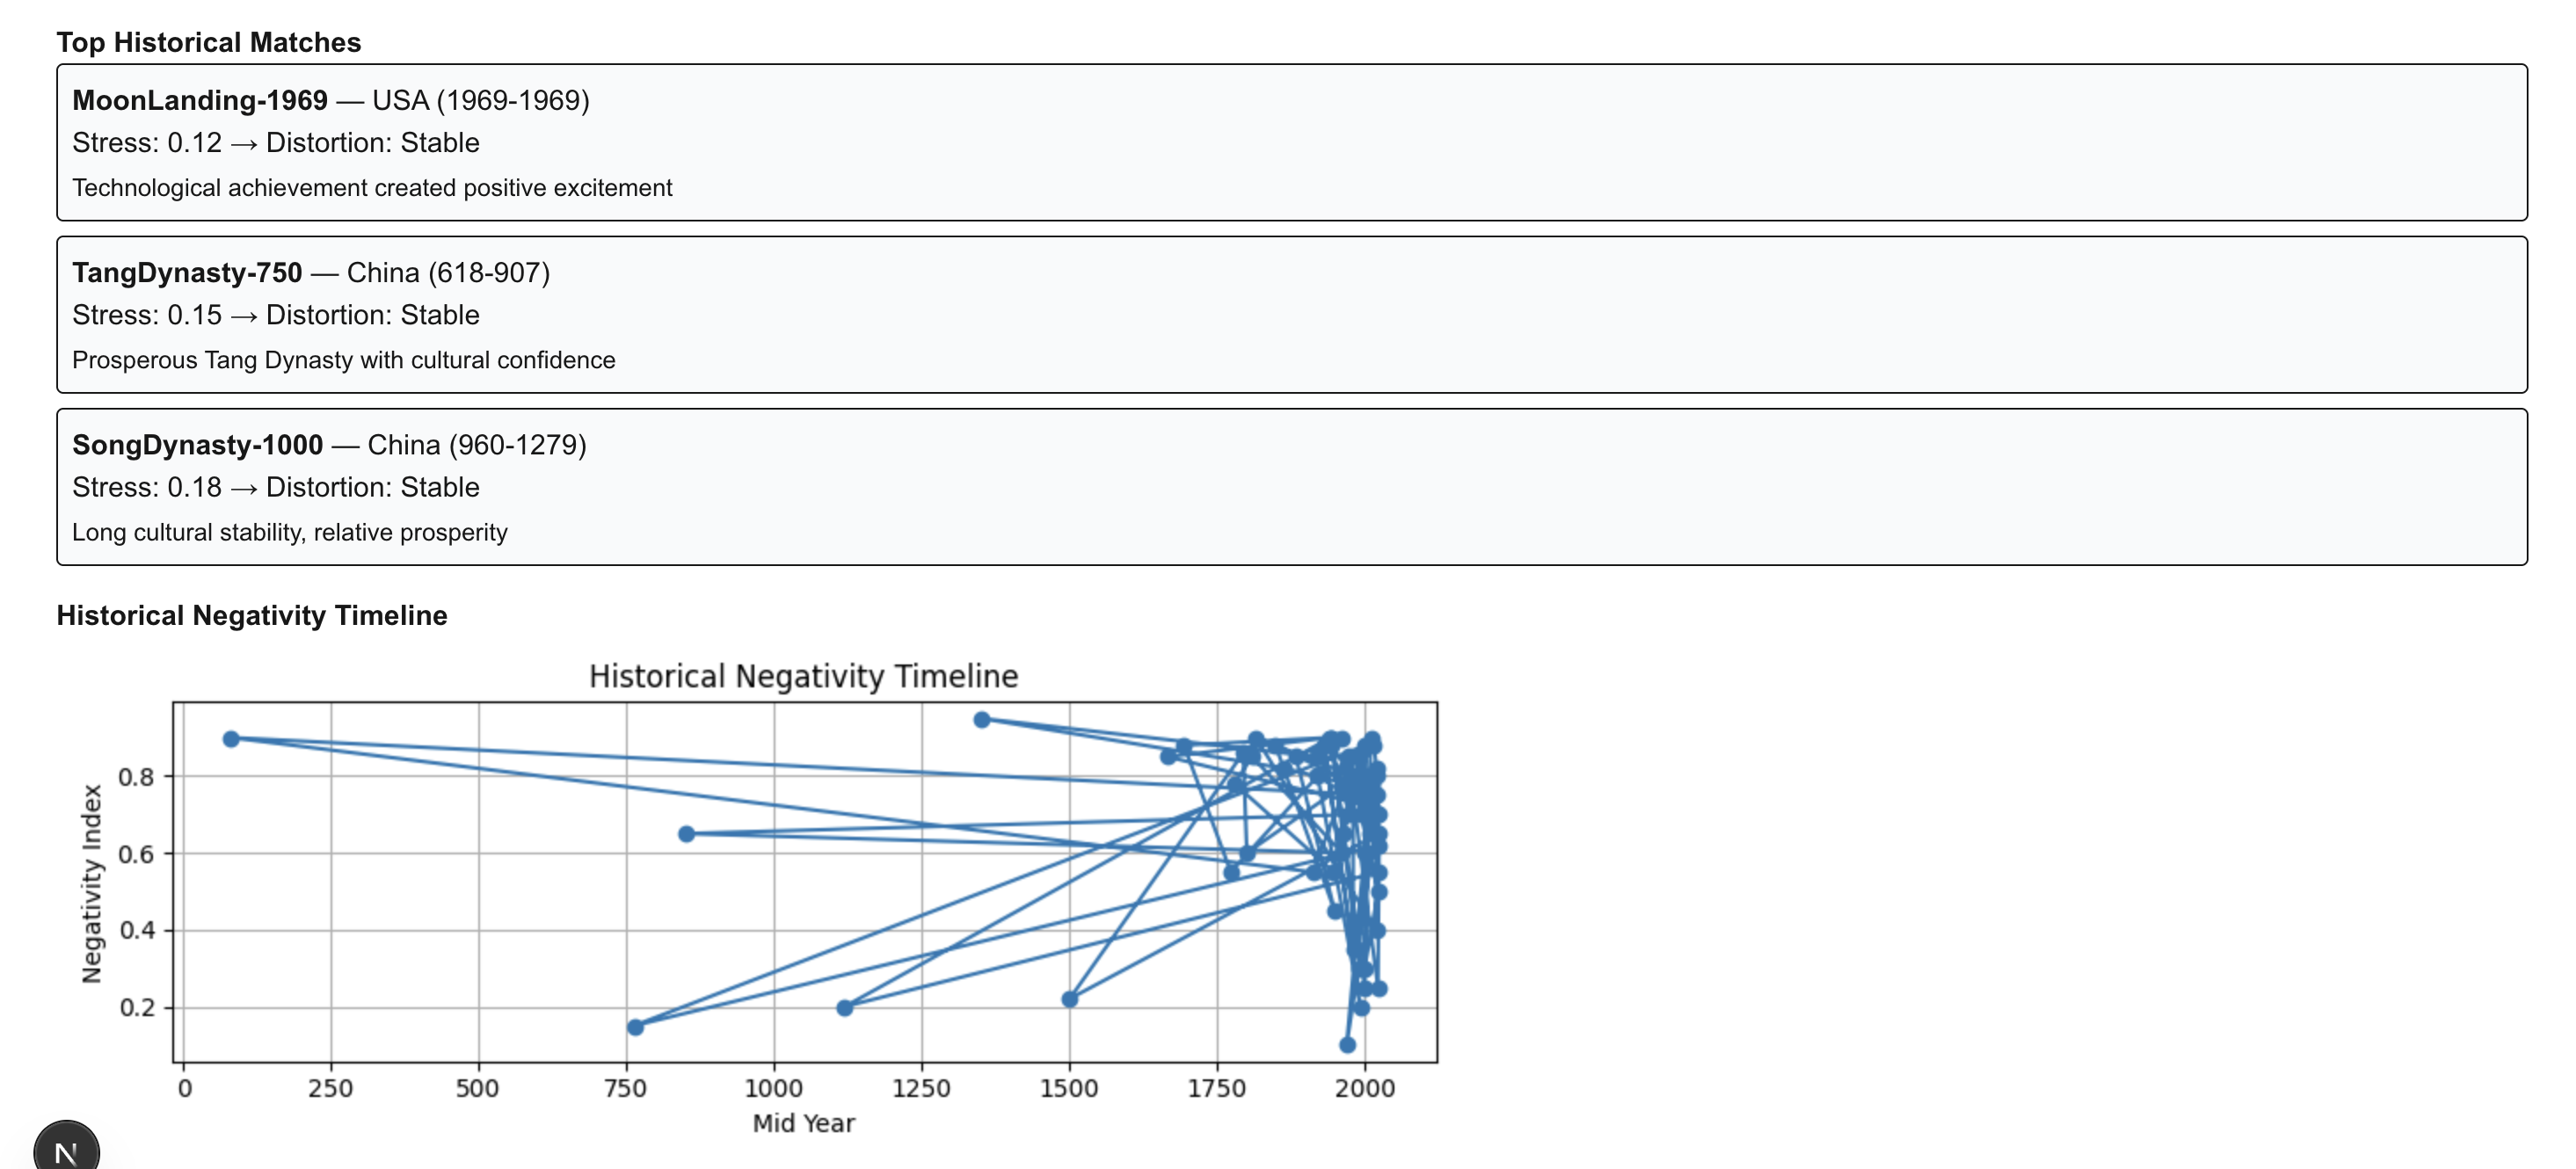
Historical Parallels: It identifies the top 3 historical eras with matching stress levels (e.g., 2023 tech layoffs ↔ 2008 financial crisis) and shares details like the era’s distortion, region, and context (e.g., "2008: Overgeneralization due to widespread economic fear").
Outcome Forecasting: Unique to the tool, it links predicted distortions to real-world consequences (e.g., "Catastrophizing → surge in safety-product demand; government risk-aversion").
Data Visualization: An interactive timeline plots historical "negativity indices" (1–1900 CE to present) to show how stress and cognitive patterns repeat across centuries.
Transparency: Users can access raw historical/modern datasets to validate predictions or explore trends independently.
How I built it
Data Layer — Open, Cross-Temporal Sources I used only public, non-sensitive datasets so the system could run smoothly during a 48-hour datathon. Historical data included global event timelines and cultural trends; modern data included economic indicators, GDELT protest/sentiment metrics, and Google Trends signals. Each time period was labeled with a cognitive distortion category using CBT-based frameworks.
Model Layer — Fast Dual System I built two predictors:
Logistic Regression (scikit-learn): trained on 80+ labeled periods using features like stress index, negativity score, and unemployment.
Rule-Based Fallback: simple thresholds to guarantee predictions even if the ML model fails.
Backend — Lightweight Flask API A small Flask server exposes five endpoints: /predict_ml, /predict, /compare, /plot_timeline, and /historical. It uses flask-cors, serves Matplotlib plots from in-memory buffers, and handles all data processing for the frontend.
Frontend — React/Next.js Dashboard The UI includes a stress slider, prediction panel (with confidence map), historical similarity results, a forecast section, and an interactive timeline plot fetched from the Flask /plot_timeline endpoint.
Challenges we ran into
Accomplishments that I am proud of
Cross-Disciplinary Innovation: MindPulse merges clinical psychology (cognitive distortions), data science (ML classification), and history (cross-temporal patterns)—a rare blend in datathons, where projects often focus on single domains like sentiment analysis.
Actionable, Not Just Analytical: Unlike most "social good" tools that stop at predictions, MindPulse links cognitive distortions to real-world outcomes (e.g., "Emotional Reasoning → surge in self-help content"). This turns data into insights policymakers or creators can use.
Dual Predictive Reliability: The ML + rule-based system ensures the tool works even if the model fails—critical for a datathon demo, where technical glitches are common. User-Centric Design: The dashboard is intuitive enough for non-technical users (e.g., policymakers) but transparent enough for researchers (raw data access, confidence scores).
Working Full-Stack Pipeline: In 24 hours, I built an end-to-end system that handles user input, processes data, and returns visual/text insights for the first time as a solo developer.
What I learned
What's next for MindPulse
Currently, MindPulse is a proof of concept—here’s how to expand its impact:
- Data Expansion: Real-Time & Global
- Add real-time data feeds: Twitter/X sentiment (via Tweepy API), real-time protest counts (GDELT live), and up-to-date economic indicators (FRED API). -Include more non-Western regions (e.g., Indian dynastic history, Latin American political crises) to improve generalizability beyond China/Global North data.
- Model Enhancement
- Train a more robust classifier (e.g., random forest) with additional features: policy uncertainty indices, social media polarization metrics
- Add "distortion trend forecasting"
- Predict how cognitive patterns will shift over weeks/months
Ultimately, MindPulse could evolve from a datathon demo to a tool that helps societies prepare for stress-driven cognitive shifts—turning historical lessons into future resilience.
Built With
- flask
- intellij-idea
- metablib
- python


Log in or sign up for Devpost to join the conversation.