-
-
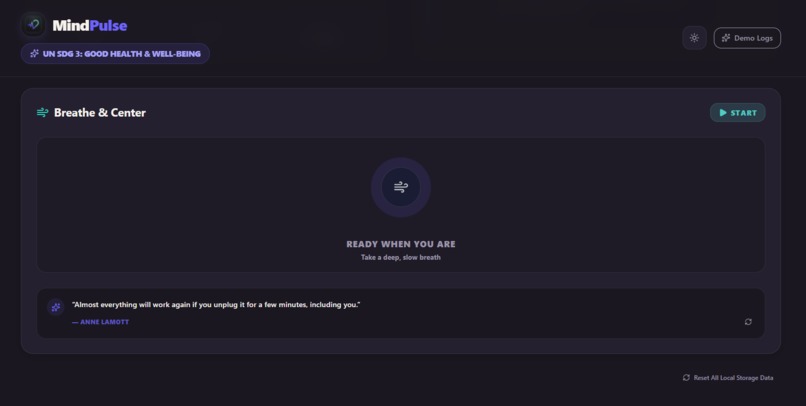
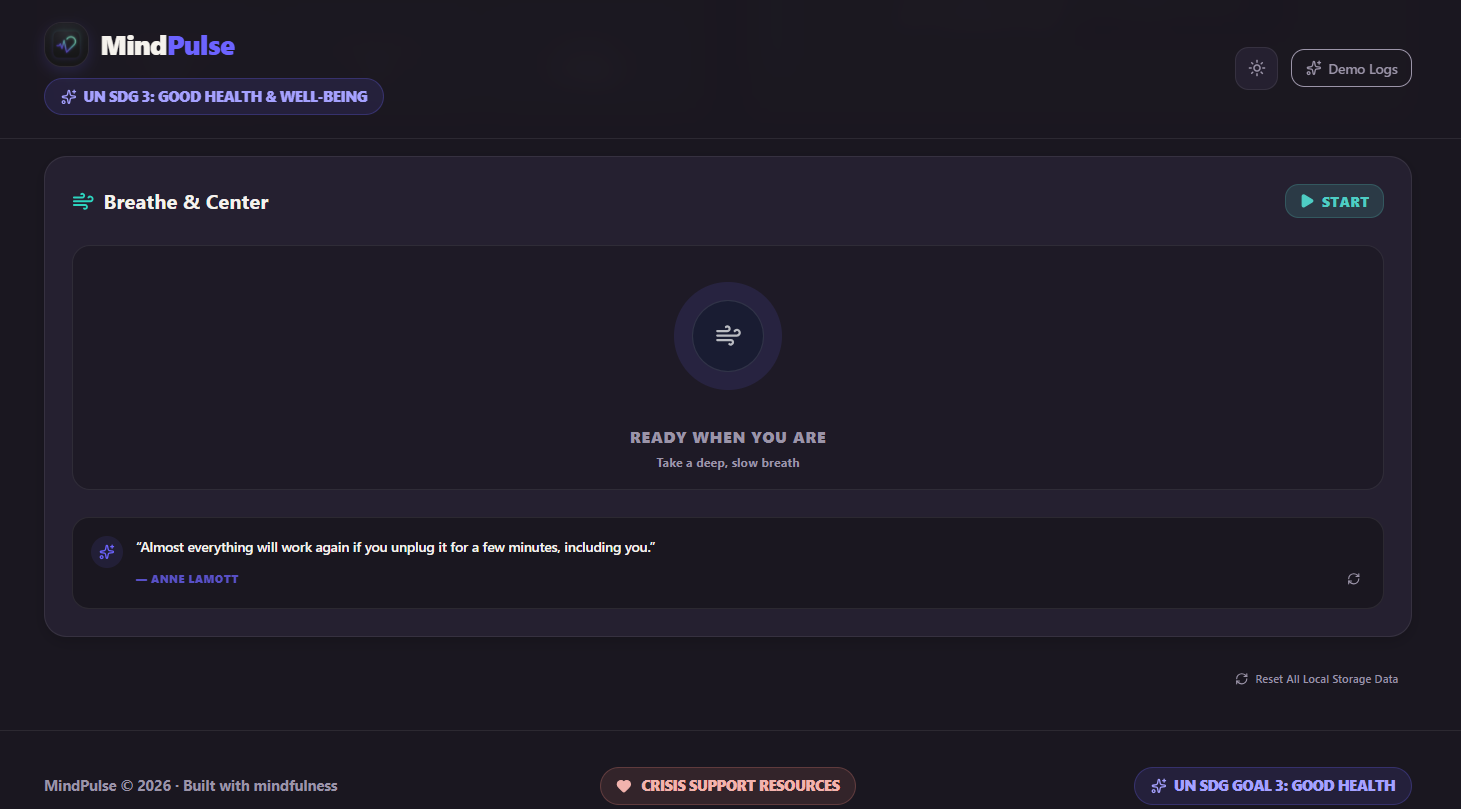
Breathe & Center widget, narrower view (dark mode).
-
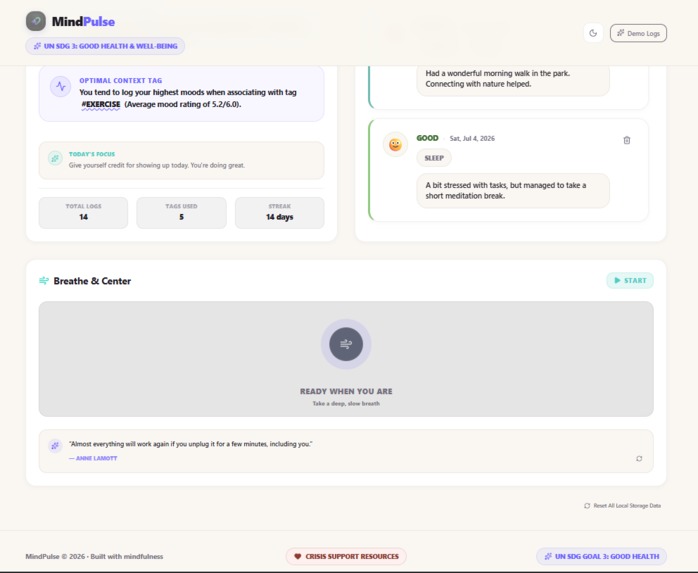
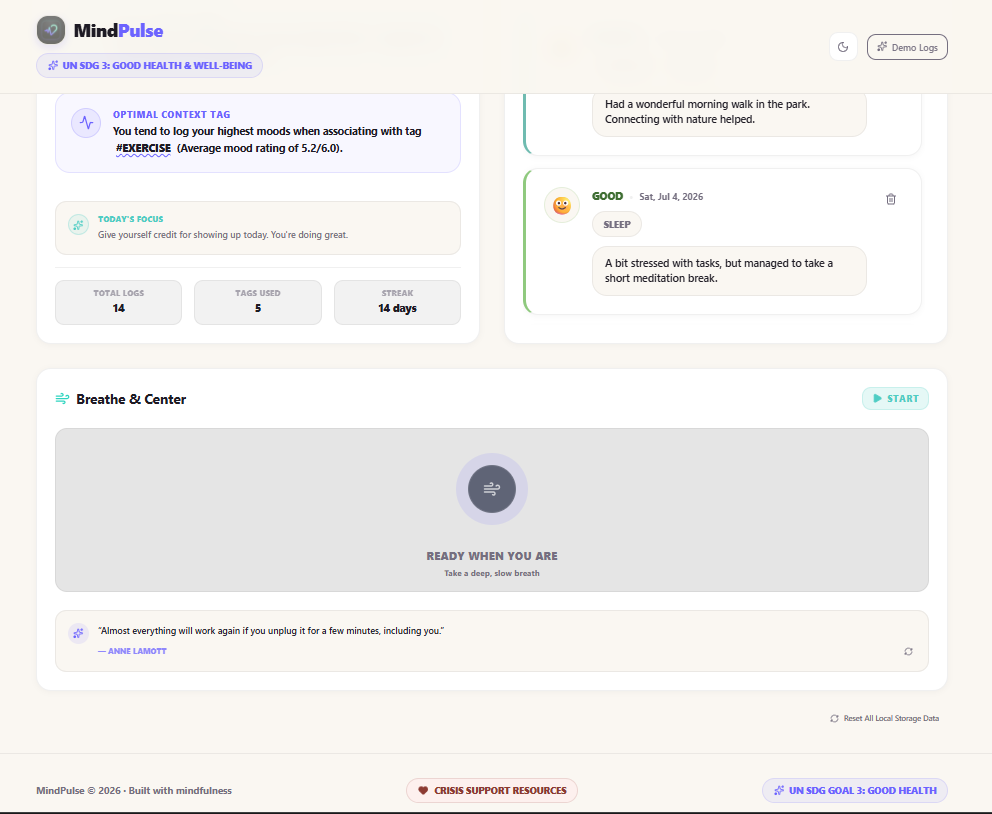
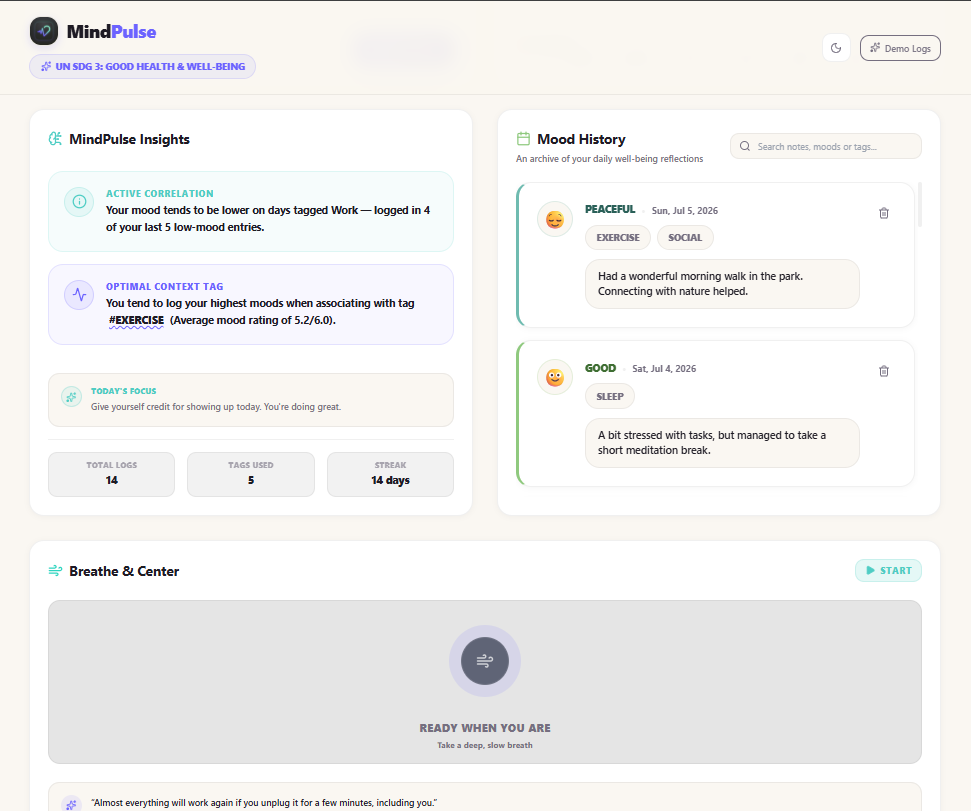
Insights + Breathe & Center widget (light mode).
-
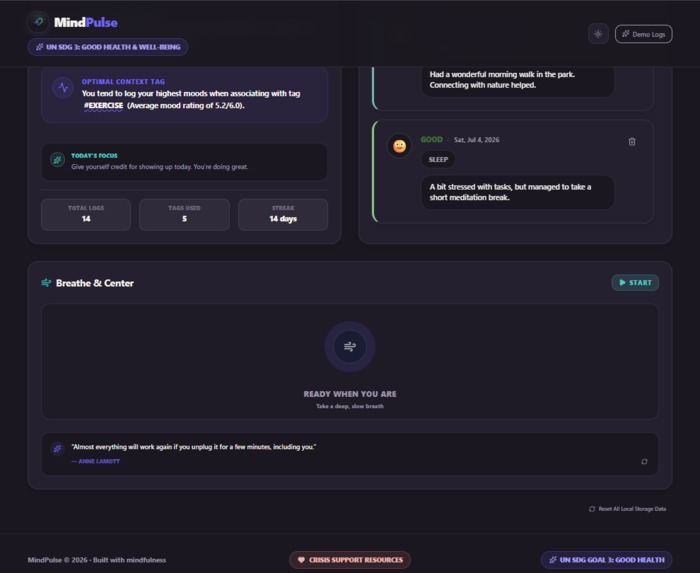
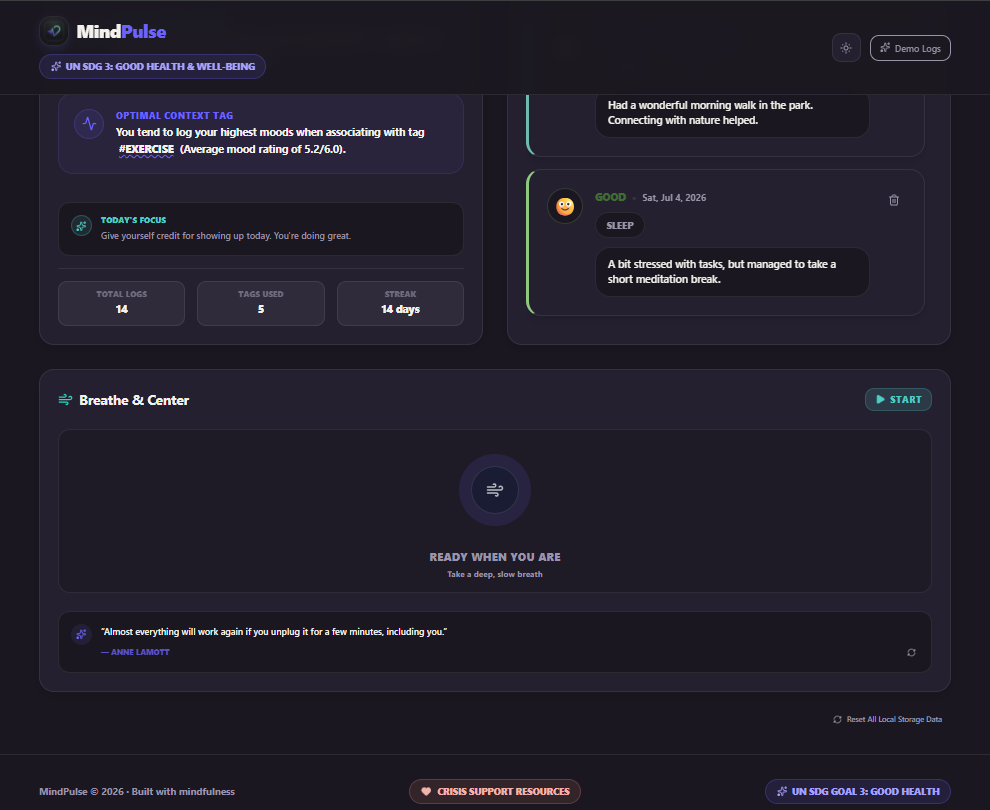
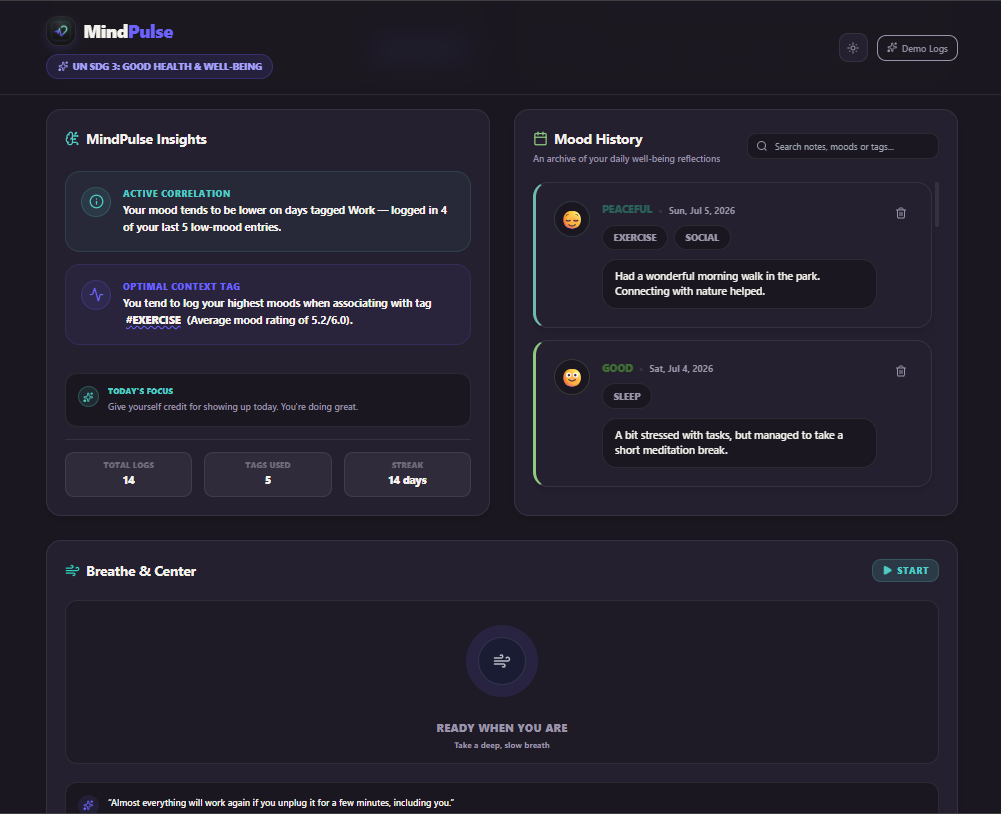
Insights + Breathe & Center widget (dark mode).
-
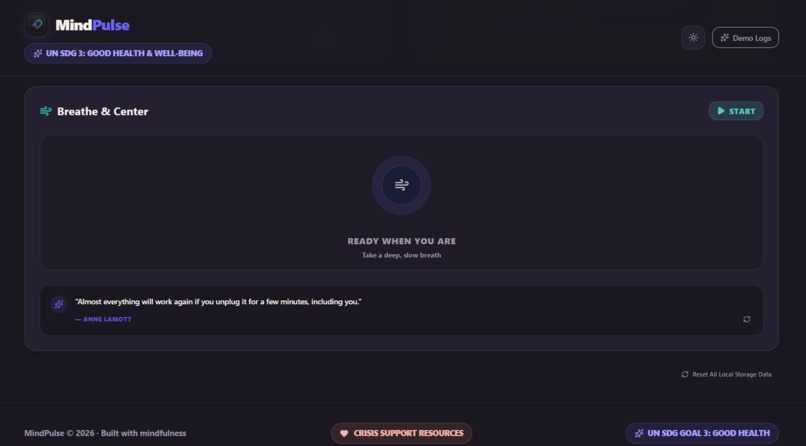
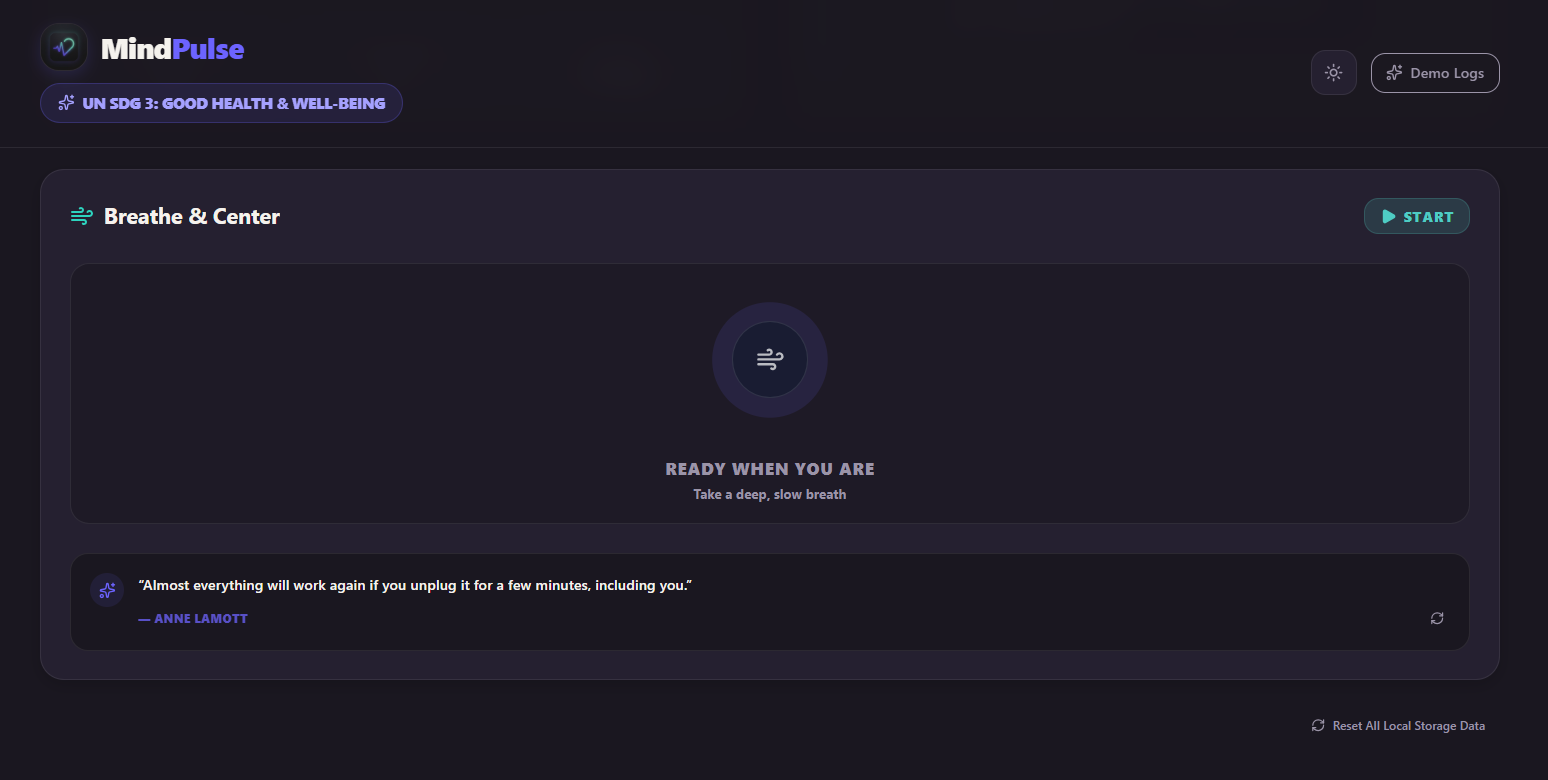
Breathe & Center widget close-up (dark mode).
-
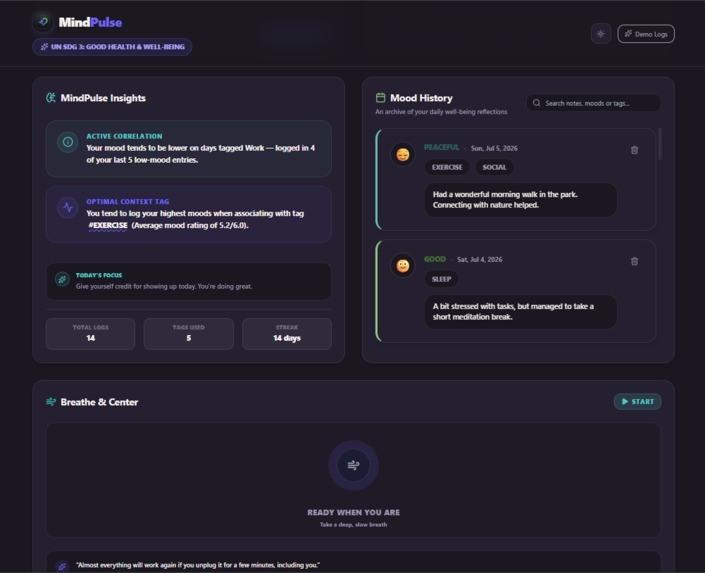
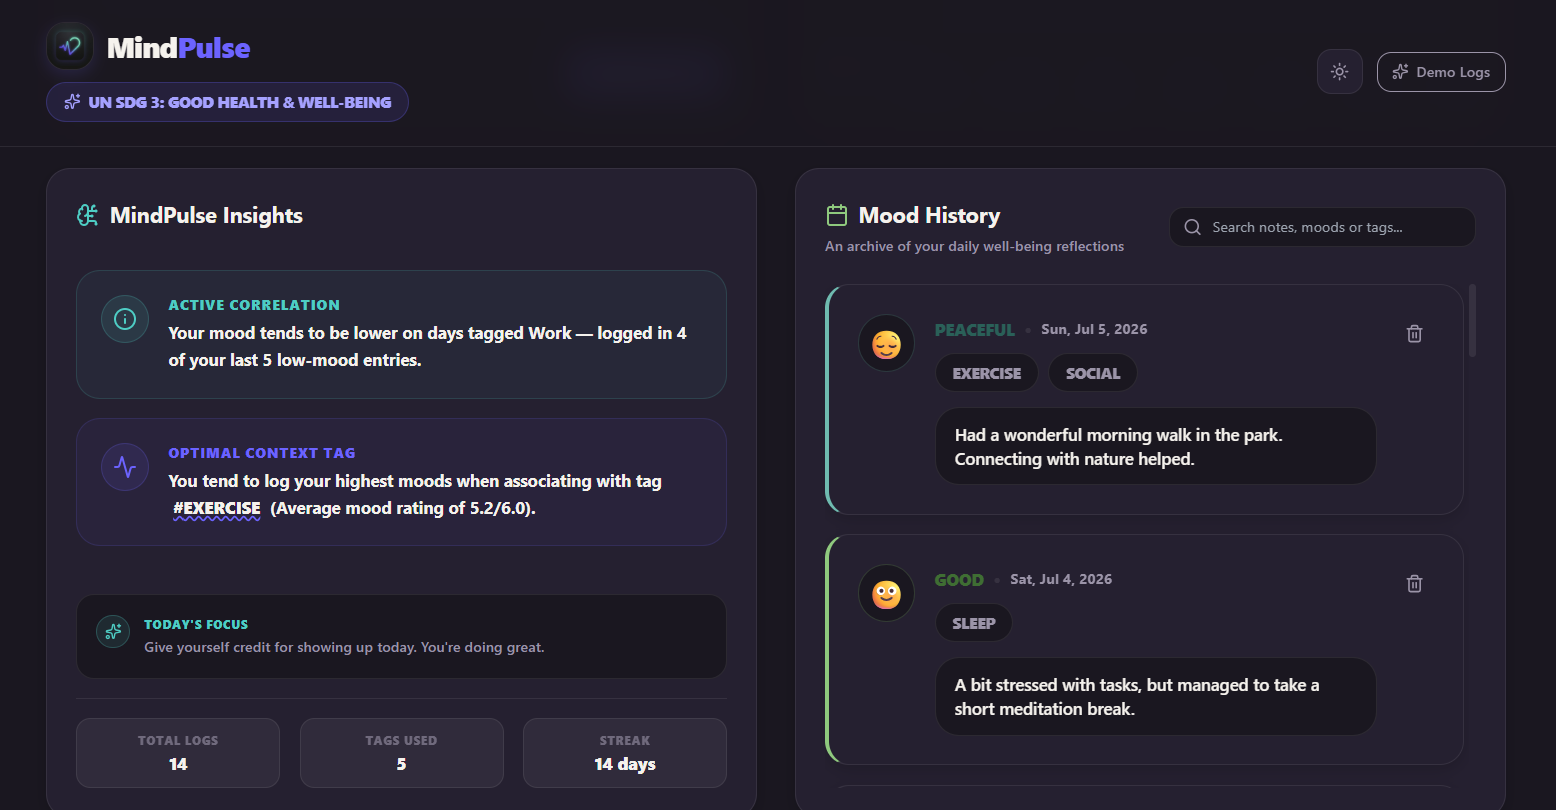
Insights panel and Mood History side-by-side (dark mode).
-
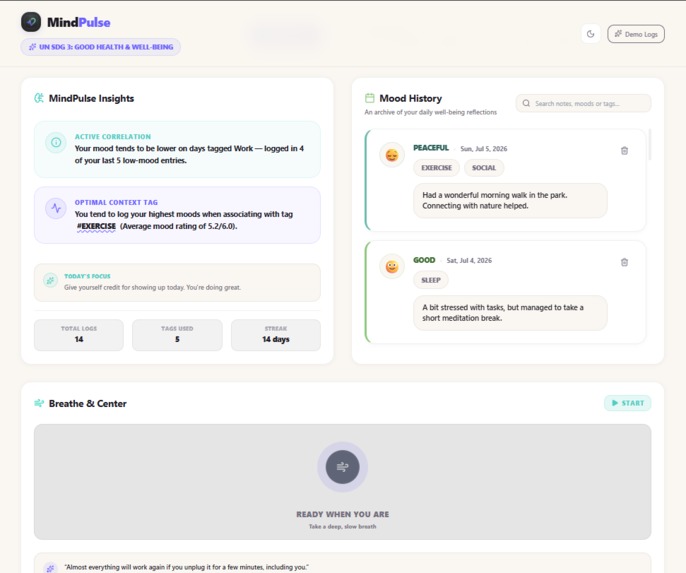
Insights panel and Mood History side-by-side (light mode).
-
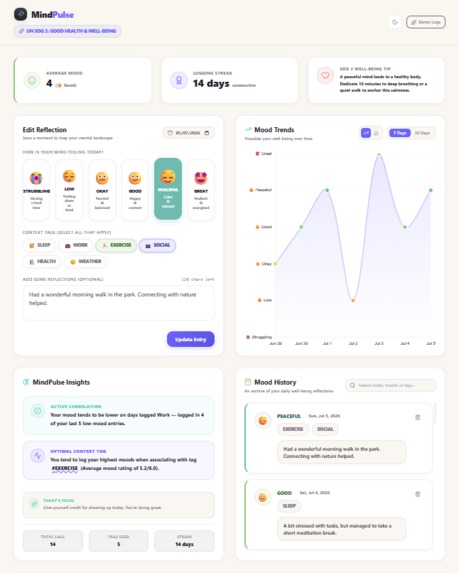
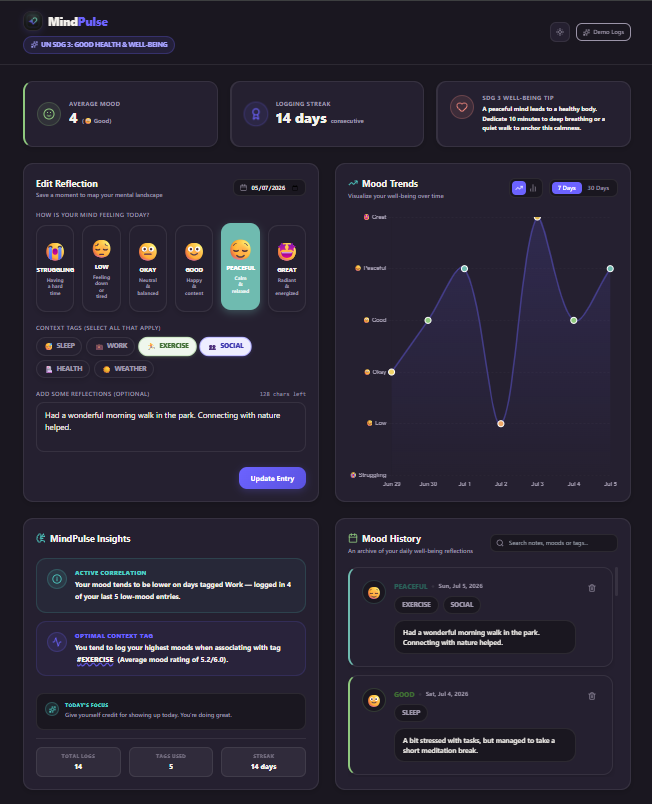
Full dashboard (light mode) — includes Insights panel and Mood History.
-
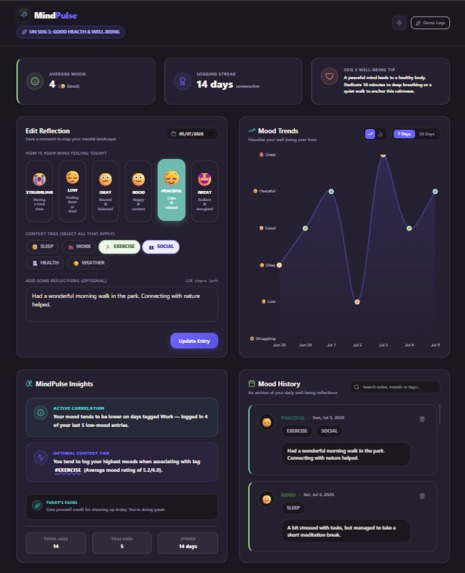
Full dashboard (dark mode) — same layout as Image 2.
-
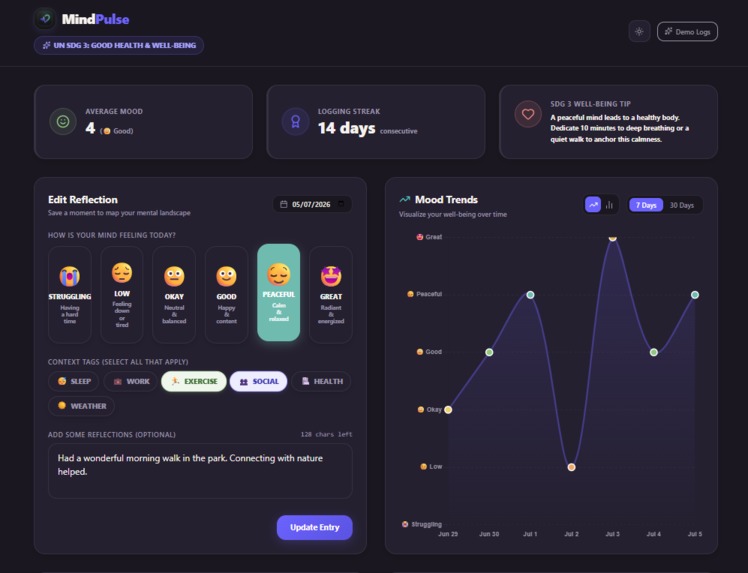
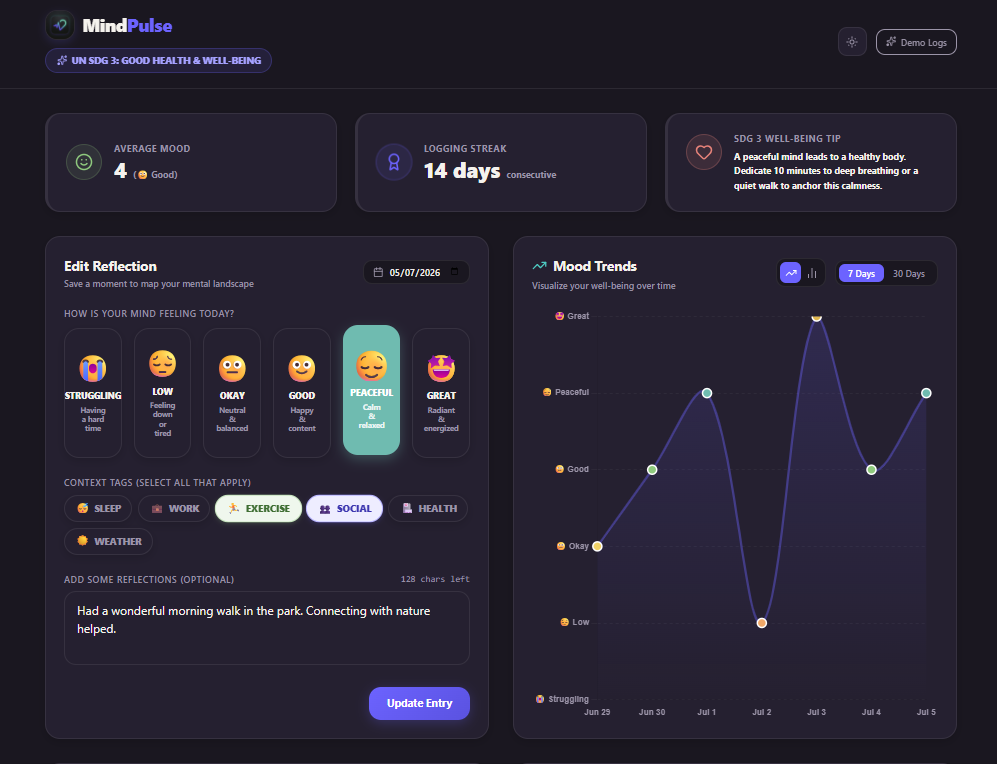
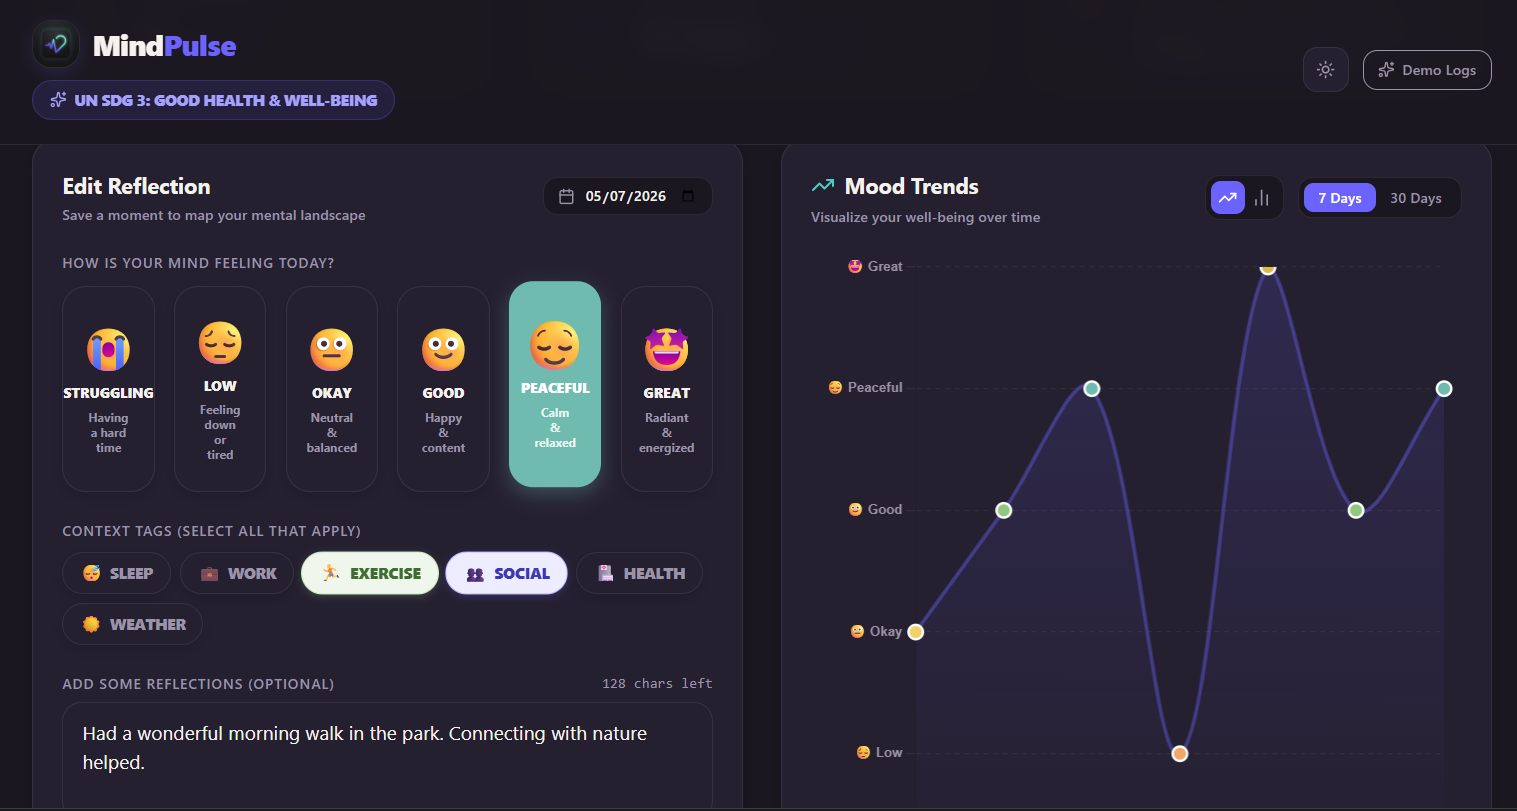
Dashboard top section — mood picker and trend chart (dark mode).
-
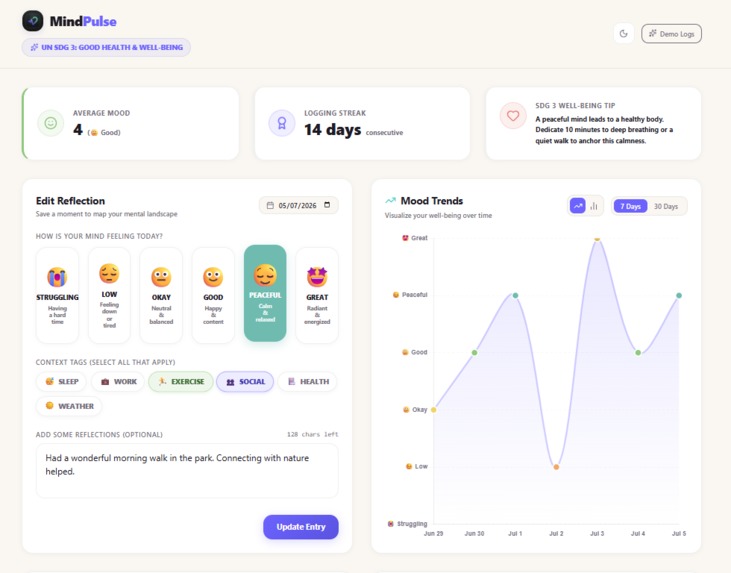
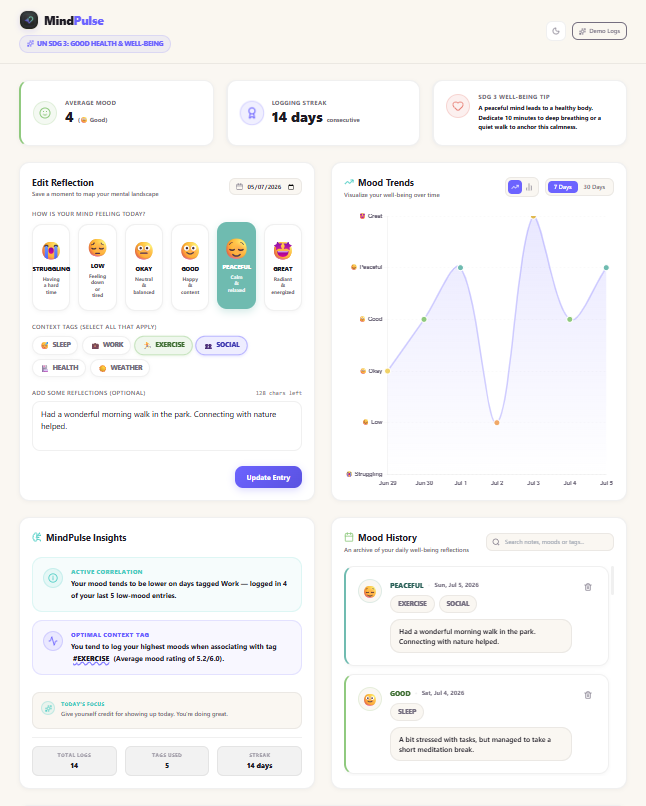
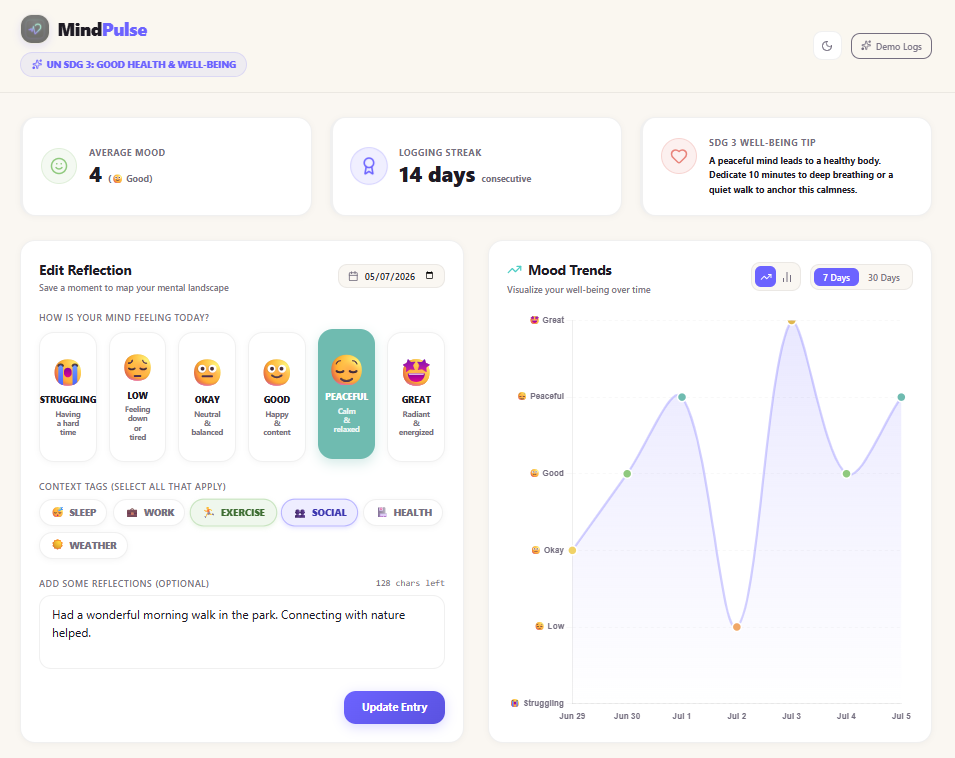
Dashboard overview (light mode) — mood picker, stats, and trend chart.
-
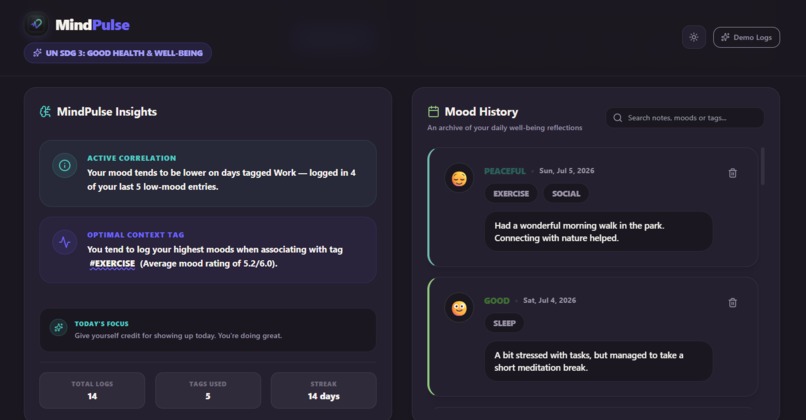
Insights and Mood History close-up (dark mode).
-
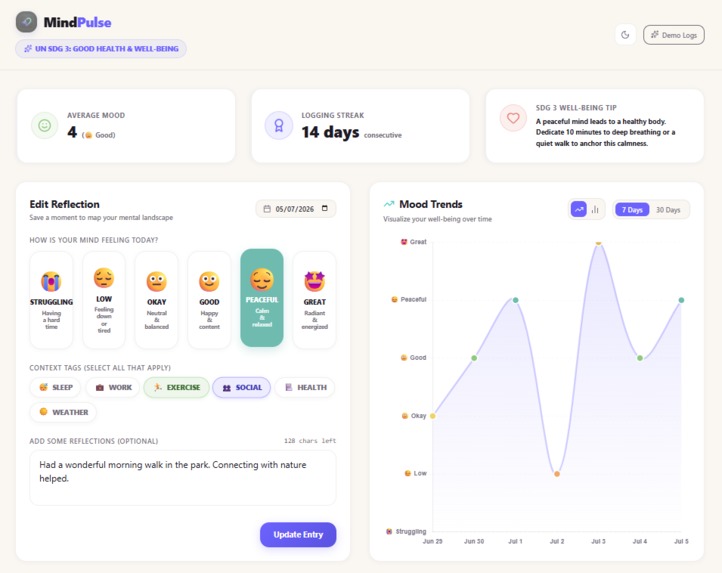
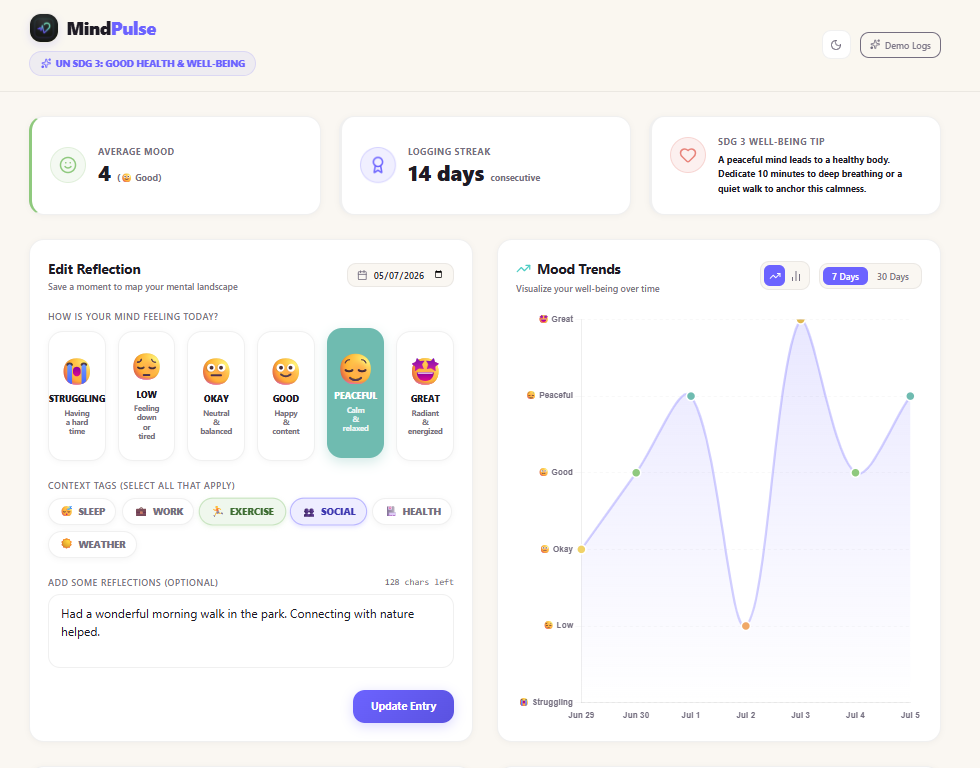
Dashboard top section — mood picker and trend chart (light mode).
-
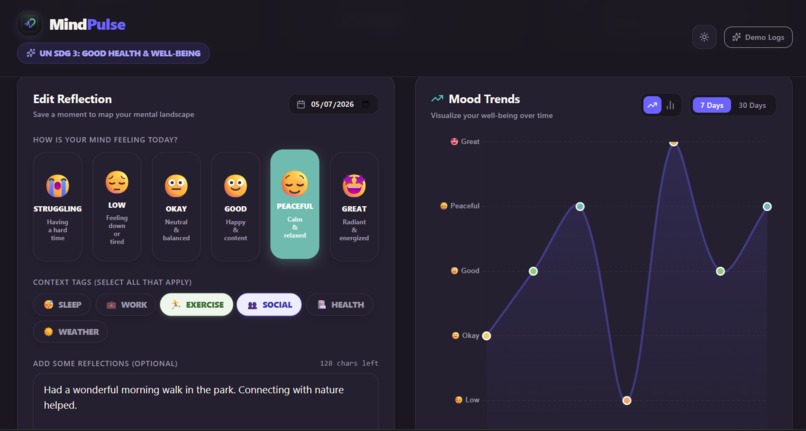
Mood picker and trend chart close-up (dark mode).
Inspiration
Mental health struggles are often invisible until they build up. Many people don't have easy access to therapists or counselors, but small daily habits — like naming what you feel — can make a real difference. We wanted to build something lightweight that helps people notice patterns in their mood before those patterns become a crisis. This directly supports UN SDG 3: Good Health and Well-being.
What it does
MindPulse lets users log their mood each day with a quick tap, add an optional short note, and see how their emotional state trends over time through a simple visual history. Over time, this helps users and, if they choose to share it, their care providers spot patterns tied to sleep, stress, or life events.
How we built it
We built MindPulse as a web app, keeping the codebase intentionally clean and modular — separate folders for UI components, logic, and data handling — so it could be clearly parsed and documented automatically. Instead of writing a traditional README, we pushed the finished code straight to a public GitHub repo and ran it through PresentMeApp's Repo Analyzer to auto-generate our project documentation and presentation.
Challenges we ran into
Keeping the scope small enough to finish within the hackathon deadline was the biggest challenge. We also had to think carefully about folder structure and code clarity up front, since our documentation would be generated by an AI reading our code rather than written by us directly.
Accomplishments that we're proud of
We're proud of shipping a clean, functional tool that's simple enough for anyone to use daily, and organizing the codebase well enough that the automated analyzer could accurately capture what the project does.
What we learned
We learned how much writing genuinely clean, well-structured code matters when there's no human-written documentation to fall back on — good naming, clear folder structure, and comments do a lot of the explaining for you.
What's next for MindPulse
Next steps include adding mood-trend charts over weeks/months, optional reminders to log daily, and an export feature so users can share their mood history with a therapist or doctor.
Built With
- chart.js
- css3
- html5
- localstorage
- next.js
- react
- react-chartjs-2
- tailwind-css
- typescript
- vercel

Log in or sign up for Devpost to join the conversation.