Inspiration
We wanted to create an application which would help us better understand the extent of mental illnesses across the world. This website helps us understand the impacts of global events on mental health.
What it does
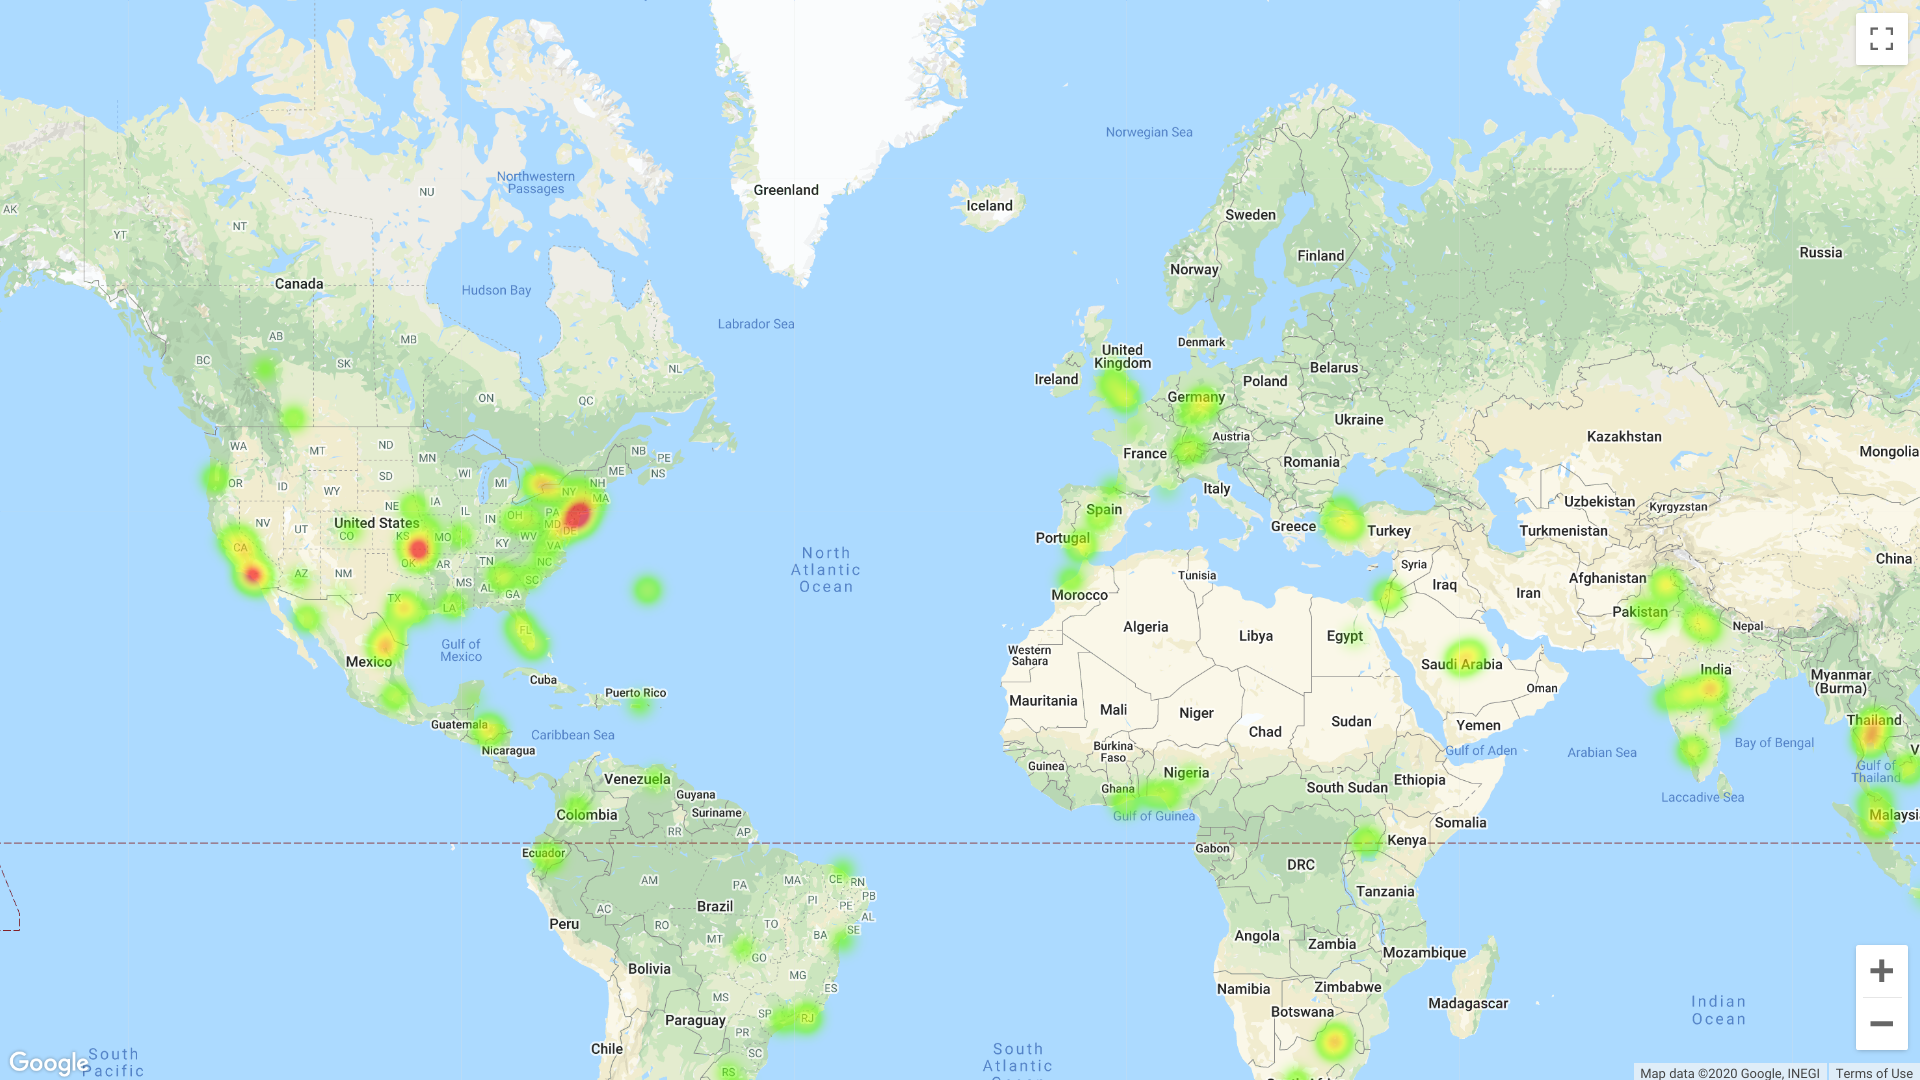
This website displays a map, showing where the negative sentiment tweets are concentrated.
How we built it
We used Google Maps to display the data as a heatmap. We used Google Cloud to perform sentiment analysis and Google Cloud translate to translate tweets.
Challenges we ran into
While creating this, one challenge we ran into was retrieving data from Twitter through their API. We used the sampled stream endpoint to do this, and MongoDB to store data. Thanks to the mentors who helped us find this. We weren't familiar with a lot of the APIs we used, such as the Google Cloud API, Twitter API, Google Geocode API, and the Google Maps API.
Accomplishments that we're proud of
We're proud that we were able to find a way to display heatmaps. We're also happy we managed to get the APIs working.
What we learned
We learned how to apply data analysis and data visualization toward different problems. We learned a lot on the Twitter API, and Google Cloud APIs.
What's next for mindmap
We trained a model using tensorflow and Google Cloud Compute, using the Sentiment140 dataset alongside with data we retrieved from Reddit. This model was more tailored toward our task, however wasn’t added to the final product, due to problems we had with serialization. We also plan on adding a 'trending negative tweet' feature

Log in or sign up for Devpost to join the conversation.