-

mind_gap logo
-
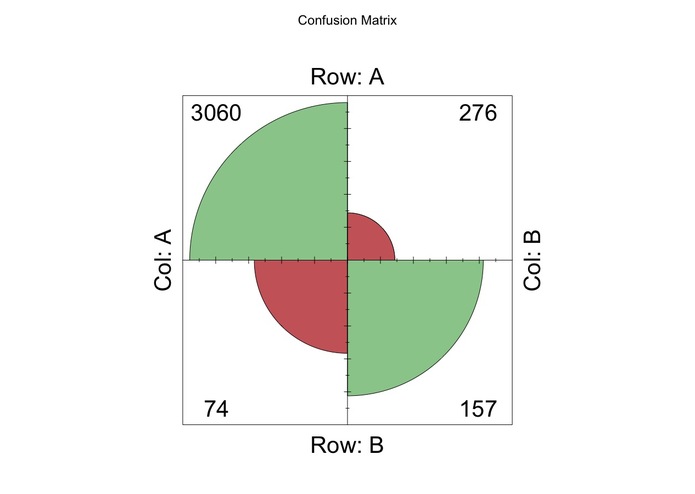
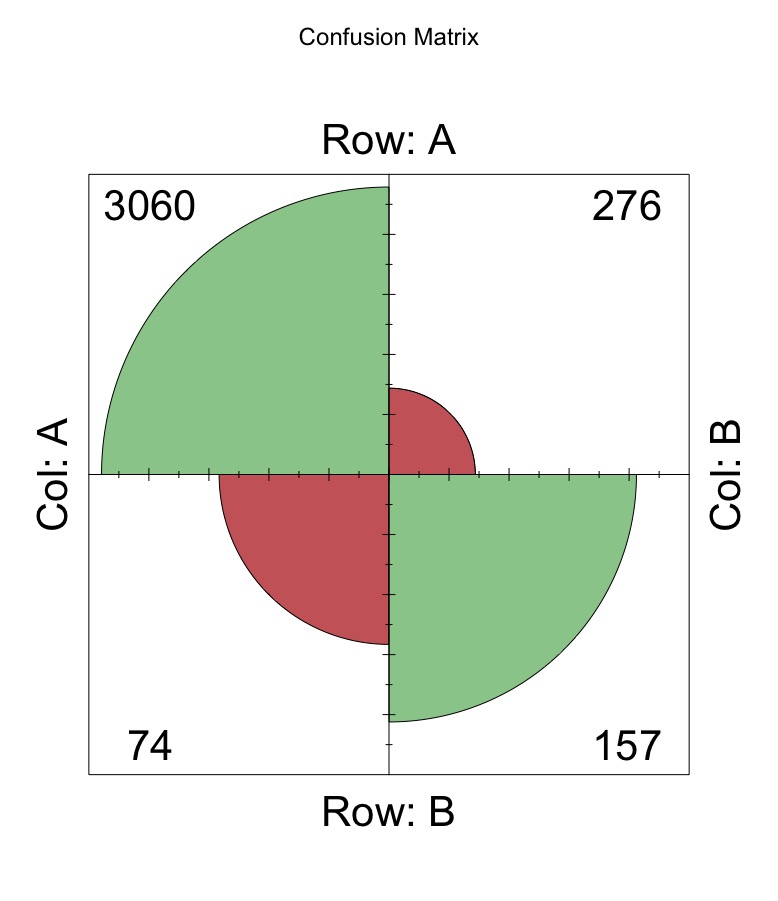
First few go at logistic regression
-
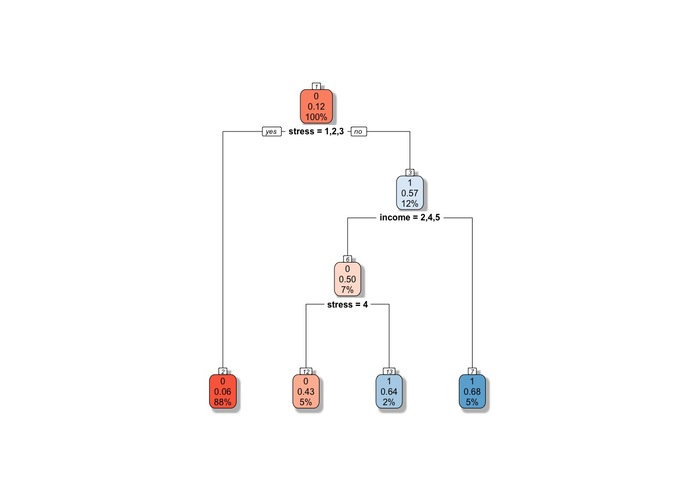
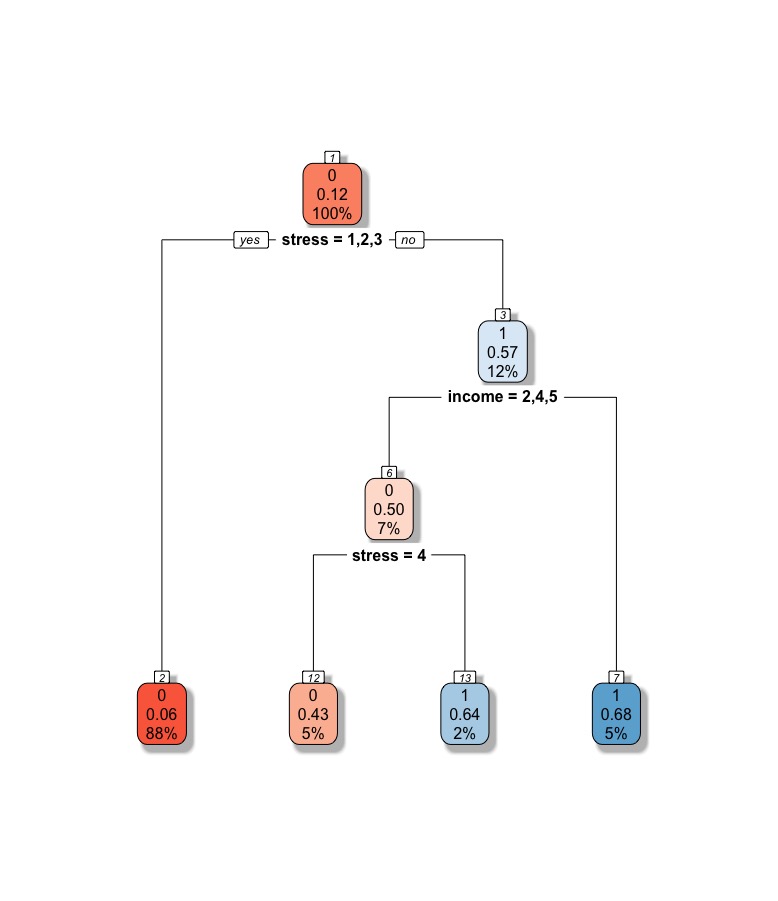
Eventual distribution tree

Inspiration
For me I naturally gravitated towards the topic given my personal experiences. Over the past two years, a handful of my close friends have been left debilitated by mental health issues - a few grapple with crippling anxiety while others bravely confront depression. Yet, as a friend, I did not notice warning signs. Indeed, many of them had not sought professional help prior to this, making it difficult to assess whether or not something is amiss. Indeed, there still exists a stigma regarding mental health issues, a PsychCongress paper found large discrepancies between self-reported information and medical records. In some cases, particular illness history was underreported by a factor of a tenth. As a health care practitioner (even a GP), it might be useful to predict a patient's mental health through proxies (and biographical information) that could help determine if a need exists for intervention.
What it does
Mindgap helps to guide practitioners to make a routine assessment as to the mental health of their patient. It is a more machine-guided diagnostic tool that complements the professional judgement of doctors. This is particularly important given the tendency for mental health issues to be underreported amongst men and as previously mentioned, the stigma that comes along with mental illnesses. A more advanced version could also be scaled up, allowing these datapoints to have personal proxies that will inform loved ones (or close contacts) of anything that may be untoward.
How I built it
I began by cleaning the dataset which initially had 358 variables. After doing some preliminary medical research and viewing literature, I came up with a general list of variables that may be worth integrating into a model. Considerations included whether the data was easily accessible (such as through random conversations), whether it relied on privileged access (such as prior medical records) or a contextualisation of the patient's past. Should these demands be too onerous, they were removed from consideration. One such instance was past medical records. I then began to deal with the missing data problem but soon realised that imputing substitute values may not be a good path given the time involved. The cleaning process required some editing with the stringR package, heavy interaction with the tidyverse and a few functions/loops along the way. I decided to combine the given CDC dataset with another CDC dataset which operated at a more macro-level. This allowed me to contextualise regional trends and fit a state-level variable in the model as well.
I thus began with a few iterations of the logistic regression (probit) to get a stronger sense of the relationships within the data. Here, I kept in mind the need to consider interactions and logterms to maintain a proper model structure. I then did a 80/20 train-test split and the log-regression gave me a (pseudo-McFadden) R2 of around 0.65. It did, however, do alright on the predictive accuracy aspect, giving a score of around 89.9%. Nonetheless, it was not particularly good at predicting positives (with a rather dismal rate of 36% of all positive cases). However, I eventually rely on the logistic model to help understand the causal relationship better.I then moved on to other more trendy but not necessarily useful machine learning models.
Specifically, I chose to zoom in on two models, decision trees and random forests. The advantage of these two methods is that unlike log-regression they are better at classifying problems (yes/no) where n is large and m (features) are not that numerous. However, they aren't particularly good at giving me clues about the underlying causal relationships in the data. I began with random forests, using the R equivalent of gridsearch CV to arrive at a pretty impressive predictive accuracy of 91%. It also marginally improved on the positive case identification rate, at around 39%. I also considered decision trees. This was the most successful, giving me a score of 51% in positive case identification rates and an overall accuracy of 90%.
I experimented with support vector machines and one hot encoding to address the categorical nature of the data but eventually deemed myself to have to little time.
Challenges I ran into
ALOT. The data was not well-structured. The ambition I had was a little to much for the less than 24 hours.
Accomplishments that I'm proud of
ALOT. I just began using plot.ly and only began coding in R last year. I came from a qualitative undergrad so this was pretty new for me. I also managed to learn and critically employ models I've learnt at school. More crucially, I saw through the project despite wanting to give up at multiple points. At the same time, it was also a personal goal to help build something for social good.
What I learned
I learnt that time is everything. You've got to manage learning (as I was going to lectures), mingling and knowing where to stop before the project veers of course. At the same time, it is also very easy to lose sight of where you are going and in the process, sacrifice statistical fundamentals for accuracy's sake.
What's next for mind_gap
As a civil servant, I will continue to explore means to integrate data into products to help broaden the social good. I will consider building on this experience to deliver even better products in the future.
Log in or sign up for Devpost to join the conversation.