-
-

-

-

-
-

-

-

-

-

-

4th pdf page
-

5th pdf page
-

Second pdf page
-

3rd pdf page
-

First pdf page


Inspiration
My sister has severe migraines, and we have been tracking them with various different apps but the data is largely useless as there are no visuals or trends or statistics done to use it. The data ends up just sitting around and is only good if we need to see a specific date. No summary statistics available and no analysis. We could only really guess from experience what trends their might be by day, month, year, etc and could not cross reference with external sources like temperature and barometric pressure to find correlation. Additionally, even though we could send the data to her doctor, they can't use it productively either because they don't have any tools for analyzing that type of data (basically list of dates), so it was useless for them as well.
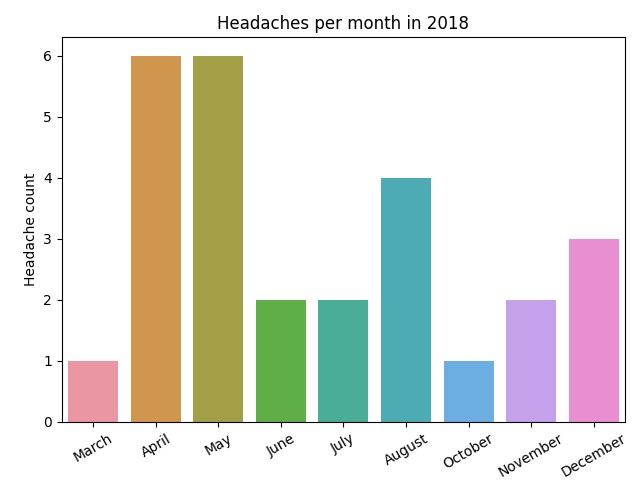
What it does
Takes in the dates of migraines (and other features if provided) to create graphs, run statistical tests and outputs a custom pdf of data. Does this by comparing the dates of migraines to public records of barometric pressure, temperature and rainfall data and runs test to determine if they have any effect. Makes graphs of different time intervals and of different views (by day, month, year) to show times that migraines are more likely to occur. Provides some advice on what to do to identify what might be causing the fact that, Monday for example, has a lot more migraines than any other day of the week.
How I built it
Build with python for fast prototyping. Heavily relies on seaborn (which uses matplotlib) for making graphs, reportlab for generating the pdf, and scipy for stats. Uses proven statistical tests like chi squared and boschloo exact for rejecting null hypotheses of categorical data (migraine vs none).
Challenges we ran into
Almost ran out of time on final submission and for the video. Also found generating custom pdfs is really hard and the solution was not very elegant.
Accomplishments that we're proud of
Output looks professional and gives lots of information (see github and attached). Was really happy to learn that my parents and sister both found it useful and it revealed a lot of information. I am proud to have made something that is more than just a proof of concept and actually gives new insights.
What's next for Migraine Analytics
Detailed more in the future plans slide, but I would like to make an app for easier usage than desktop program, support more tracking apps data formats, and with time build a tracker into Migraine Analytics to allow users to have their tracker and analysis in the same place. I would also like to add other factors like pollen and air quality that I did not have time to add.


Log in or sign up for Devpost to join the conversation.