-
-

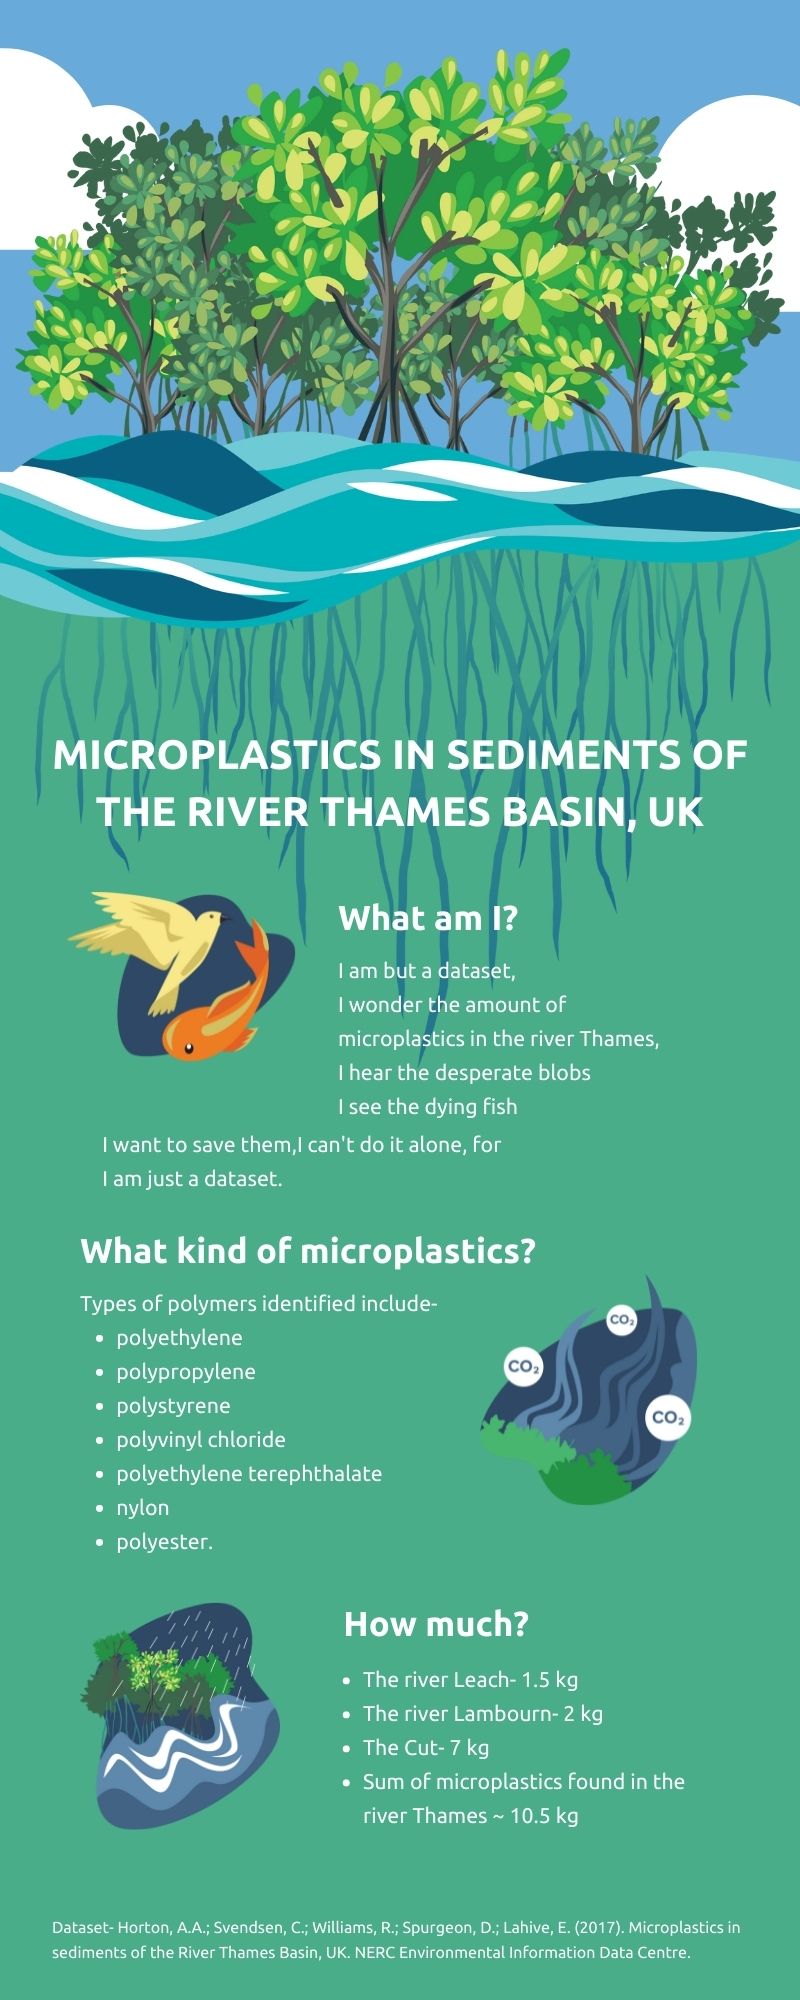
Infographic
-

cover
-

poem
-

information


Inspiration
Rivers are the source of life. They directly affect not only our ancestors (plop plop), but us too.
What it does
This is an infographic ie. data represented through graphics. The dataset I've used is- Horton, A.A.; Svendsen, C.; Williams, R.; Spurgeon, D.; Lahive, E. (2017). Microplastics in sediments of the River Thames Basin, UK. NERC Environmental Information Data Centre. (Dataset). https://doi.org/10.5285/93837492-408f-4349-8dcd-ee833e84e47e
How I built it
I tried many mediums, such as interactive websites, processing artwork, and simple games but in the end, settled on infographics due to time constraints.
Challenges I ran into
Visualizing the data and time constraints
Accomplishments that we're proud of
Being able to convey information visually
What we learned
Writing poems and making graphics
What's next for Microplastics in Thames Infographic
I want to create a river cleaning game as I had initially hoped
Built With
- canva

Log in or sign up for Devpost to join the conversation.