-

Figure 1. Occurrence of bacterial species across samples.
-

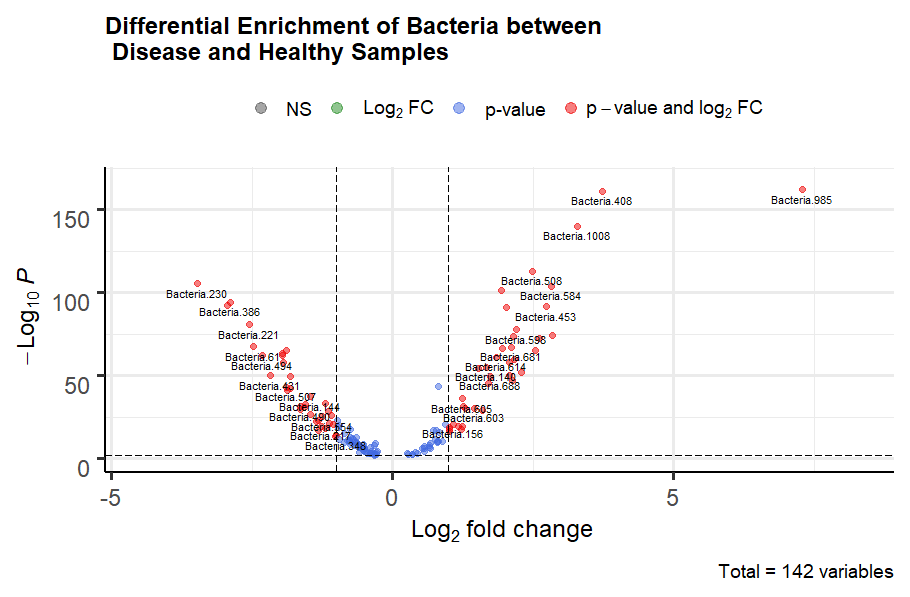
Figure 2. Differential enrichment analysis on healthy vs. diseased samples
-

Figure 3. Shiny App Implementation of Model


Inspiration/Abstract
The human microbiome encompasses a diverse community of microorganisms living within the gastrointestinal tract. The state of the microbiome is deeply intertwined with human health and contains a wealth of information that can aid disease diagnosis. However, this information is obfuscated by the thousands of interactions between bacterial species, making it difficult to detangle by traditional analysis. In this work, we implement an eXtreme Gradient Boosting (XGBoost) classifier to predict disease classes from microbiome data. We then use statistical analysis to validate the model and inform feature reduction. Our model maintained high accuracy with reduced features informing optimal strategies to increase computational efficiency, reduce assay cost and identify biologically relevant species.
What It Does and How to Use It
Our model uses bacteria population data from the microbiome to classify samples as one of: Healthy, Disease-1 , Disease-2 or Disease-3. The trained model can be accessed through our Shiny app or can be downloaded from our Github repo.
How We Built It
Exploratory data analysis showed that the majority of bacterial species (54%) occur in fewer than 10 samples. This, along with other extrapolatory data analysis, suggested a sparse dataset (Fig. 1). We also found differences in bacterial counts between samples which required normalization. A similar problem is found in RNA-Seq datasets, enabling us to use traditional RNA-Seq specific tools. We performed library size normalization by Counts Per Million (CPM) transformation on the dataset. This normalized each sample value in proportion to the sum of all values for the sample.
We elected to utilize XGBoost's tree-based model because of their robustness against sparse data and easy interpretability including obtaining feature weights and confidence scores. We built a multiclass classification model. We split our microbiome dataset 80% (5985) /20% (1496) into training and test data respectively. We maintained the same distribution of classes in both training and test sets. We used all 1094 bacteria as features for this and were able to obtain an F1 score of 0.80 and a Cohen's Kappa score of 0.69 for this model.
Upon analysis, we found that the XGBoost model computed weights for 453 bacteria. This indicated that the remaining bacteria were largely uninformative. Therefore, we theorized that computational cost could be reduced by retraining the model on a subset of bacteria for each sample. To identify the most highly relevant bacteria as the predictors, we preformed differential expression analysis. We employed EdgeR's differential gene expression pipeline, modelling the bacterial frequency as gene expression. We obtained 71 bacteria (Fig. 2; p-value < 0.01. -1 < logFC < 1) to be differentially enriched between healthy and diseased state ( sum of Disease-1,Disease-2,Disease-3). These 71 bacteria were all included in the set of 453 which the XGBoost model found to be informative. We then only used these 71 differentially enriched bacteria as predictors and obtained an F1 score of 0.77 and Cohen's Kappa of 0.63.
Challenges We Ran Into
One of the key challenges was the class imbalance in our dataset. Our samples were distributed as follows: 3741 Healthy, 1949 Disease-1, 578 Disease-2 and 1213 Disease-3. This left us very few disease-2 samples. To maximize the utility of our dataset we did a weighted random sample to generate our test data where weights correspond on the frequency of each class. This maintained the same distribution of classes between test and train data. We also customized our loss function such that the misclassification (during training) of classes with fewer samples was penalized more harshly.
Accomplishments We're Proud of
We are proud of practical extensions of this project which allows for real-world applications. Our shiny app provides easy implementation of our model for the end user. Our feature reduction and model optimization can both provide biologically relevant insight to the contribution of different bacterial species and can reduce the cost of assaying microbiome data.
What We Learned
During this challenge, we learned the value of statistical analysis for both validation and informing model architecture design. Statistical analysis both revealed the sparse structure of our dataset and key bacterial species within it. This allowed us to drastically reduce the features present in our model from 1094 to 71 (6.5% of the sampled microbiome) while maintaining accuracy. This feature reduction has practical implications. It suggests an alternative metagenomic strategy of in-depth sampling of the 71 highly-informative bacteria, compared to shallowly sampling all 1094. It would also be interesting to follow up on these 71 species and identify their biological function.


Log in or sign up for Devpost to join the conversation.