-
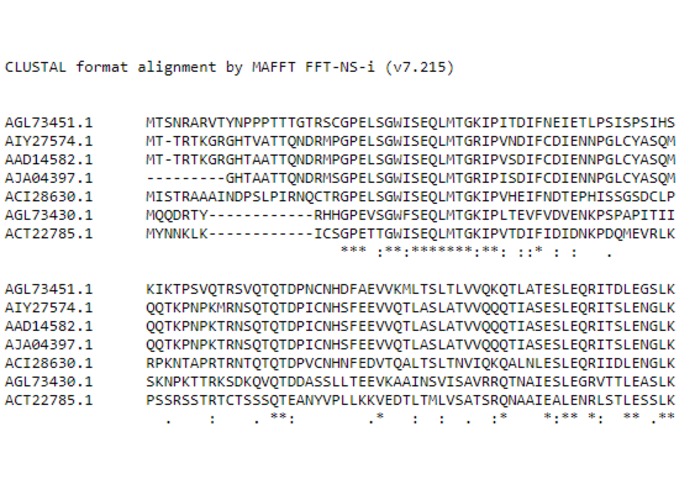
Figure 2. Alignment with MAFFT
-
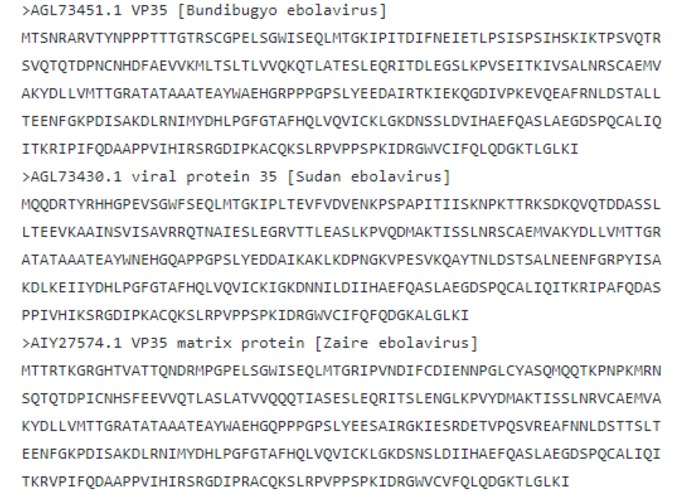
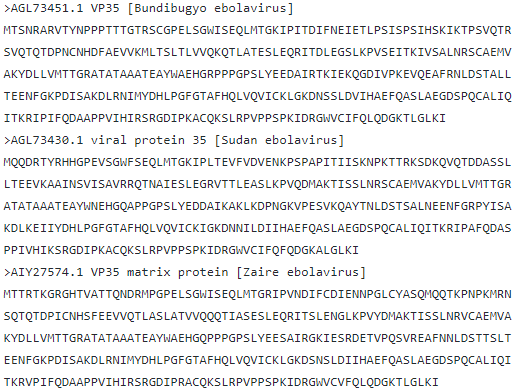
Figure 1. FASTA file
-
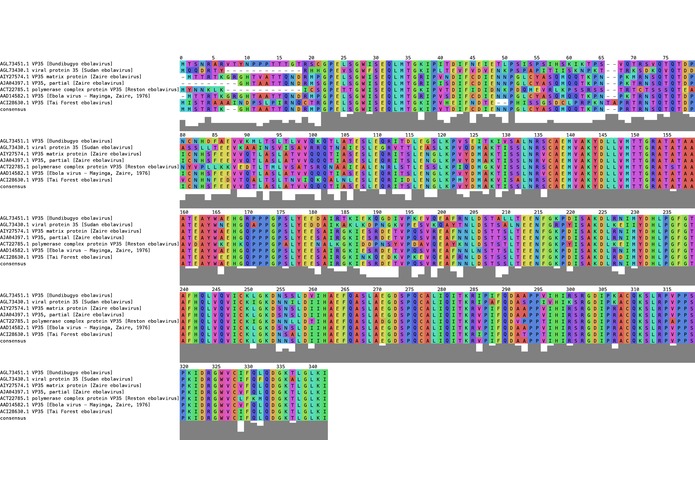
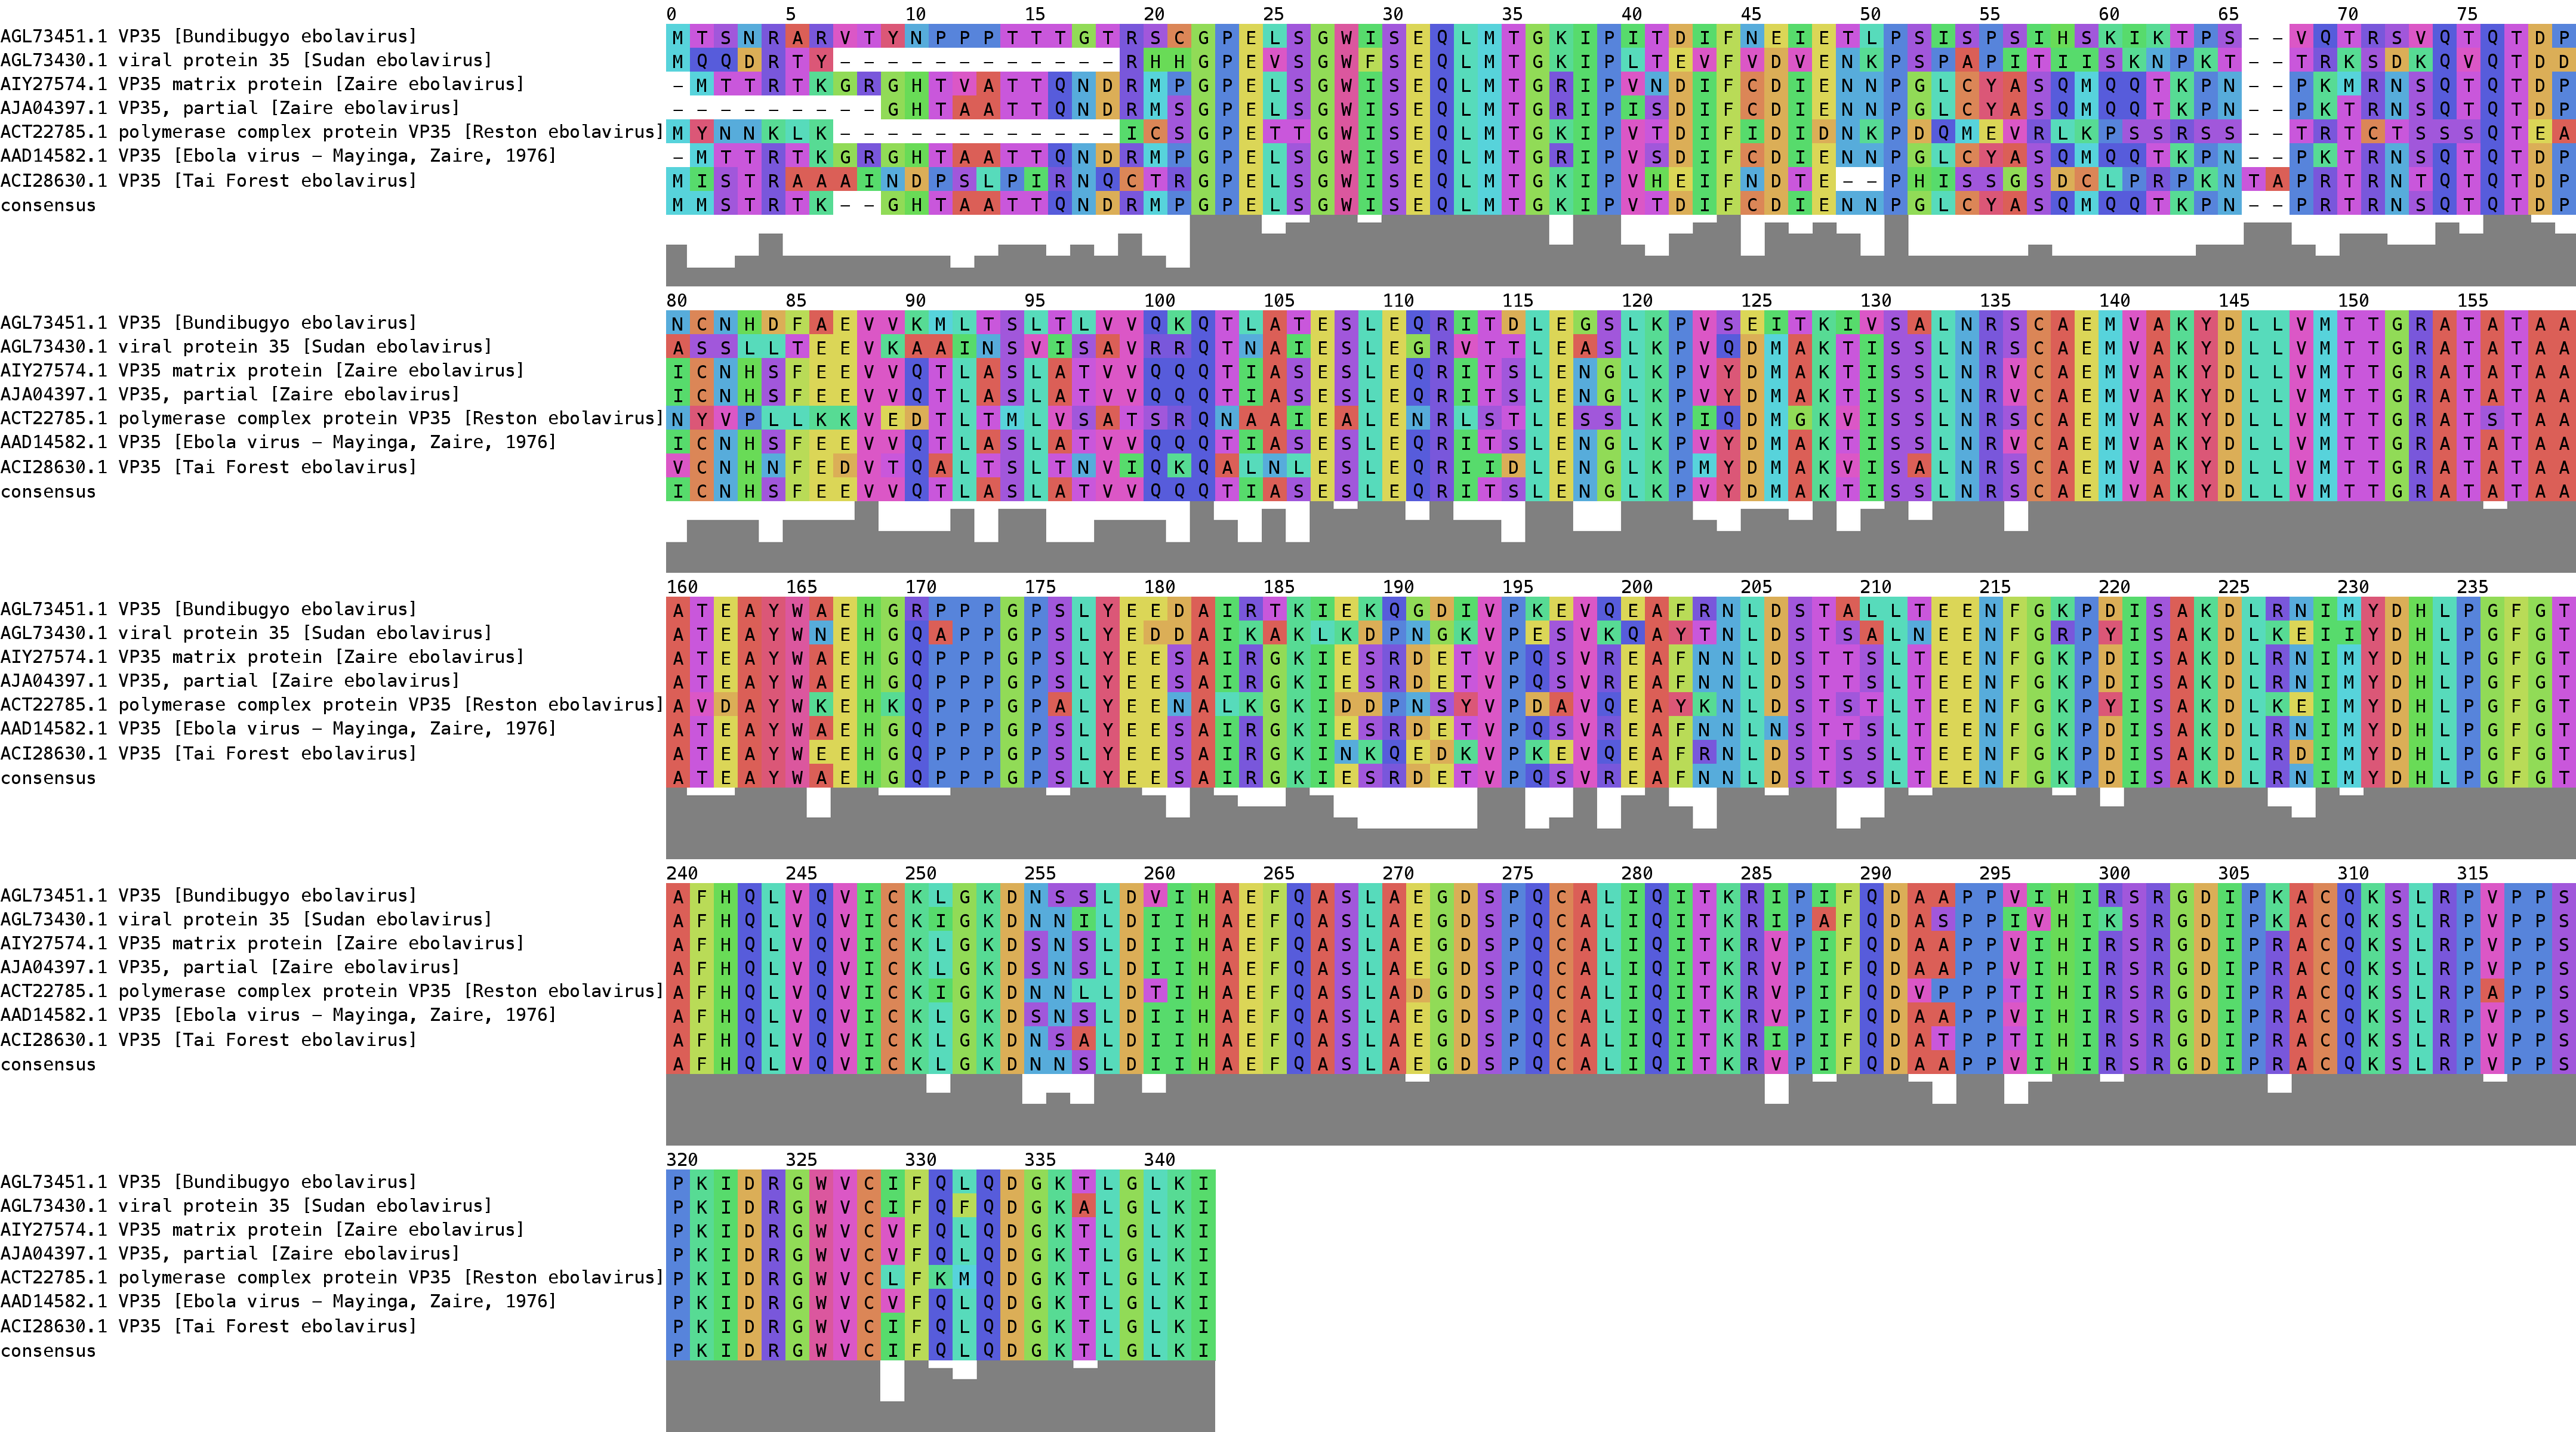
Figure 3. Output figure from our program
Inspiration
In bioinformatics, multiple sequence alignment is the arrangement of more than two sequences (either protein or nucleid acid) in order to inferred homology or evolutionary relationships between the sequences, for example. There are several tools that can carry this out successfully. However, most of the visualization softwares are not able to print a compact image of the alignment, splitting the alignmet in several pages when exporting it into a file. This is no convenient when you wish to add the alignment into a report or a paper, and visually inspect differences. Also, they do not allow extra nice functionalities, like personalizing the color scheme regarding different properties of the residues nor further information other than the alignment itself.
What it does
We have created a command line tool which takes a FASTA file (as seen in Figure 1) and runs the multiple alignment with MAFFT (a high speed multiple sequence alignment program). A section of this alignment can be seen in Figure 2. Once this is done, it draws every character with a coloring scheme that can be chosen by the user, keeping the header on the left side for identifying the sequence. The color scheme for grouping amino acids and DNA bases is based in well know standards properties. Furthermore, it creates a consensus frequency plot with the most frequent residue found at each position. The user can also decide the number of residues shown in each line, fixing the width of the figure. The result can be seen in Figure 3.
How I built it
We used GitHub to be able to work individually but also collaborate in the different parts of the code. The code is therefore divided in different scripts, following natural steps, like reading the input file and performing the alignment, the plotting, the color scheme, etc. The alignment is done with the MAFFT tool, so the user should have it installed. The rest the code has been written using standard libraries or more specific ones for plotting, like Matplotlib and Pillow.
Challenges I ran into
The most difficult part was figure out how to plot the residues themselves, as well as straightening up the output figures from Pillow and Matplotlib libraries, and removing all the superfluous areas around the plots. As we were working in GitHub, several conflicts occurred when we pushing and pulling the actualized code. Also, including external libraries as part of the package.
Accomplishments that I'm proud of
Achieving the product we had in mind! We actually add extra functionalities afterwards, like the coloring scheme (which was second priority regarding the timing). We are extremely happy as this covers a big demand in our area, and makes understanding and visualization easier to understand.
What I learned
We obviously learnt a lot of new libraries, and learnt from the process of failing and failing when running the code.
What's next for microbesoft
The first thing would be to create a web server or a friendlier user interface. Then, allow other input formats than FASTA and letting the user decide their favorite multiple alignment tool. Also, predict and add secondary structure information to the visualization.

Log in or sign up for Devpost to join the conversation.