-
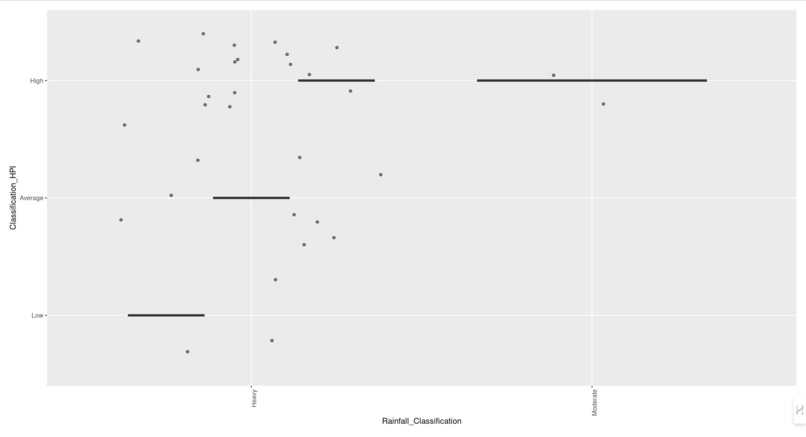
Ordinal Regression Analysis Visualization

Inspiration
We recognize that climate change is a huge problem and wanted to see how fluctuations in the rainfall in a city affect the prices for living environments. We chose Miami in particular because of how prone it is to frequent rainfall.
What it does
Our project is an attempt at understanding if any correlation exists between the annual average rainfall and the Housing Price Index in Miami-Dade County.
How we built it
We used pandas to classify the variables in the datasets with their ordinal correspondents and to clean the merged dataset. We used R to run an ordinal logistic regression and interpret the results.
Challenges we ran into
Connecting and merging datasets for annual rainfall and housing price index for a county in Miami.
Accomplishments that we're proud of
We were able to find common data points and successfully remove any outliers from the datasets we obtained from credible sources online.
What we learned
We learnt from our results that two factors may be related to each other but they do not necessarily have to be the reason for the occurence of one another. However, this does not mean that the relationship does not truly existed, it just cannot be inferred directly through our methods.
What's next for Miami: HPI vs Annual Rainfall
We hope to gather more data points and focus more on other climatic conditions that stem from climate change (tornadoes, hurricanes, drought, flood) that affect major cities of the United States. We hope to turn our results into an interactive space for users to predict and understand what their investments in properties in a given region could look like in the future.

Log in or sign up for Devpost to join the conversation.