Inspiration
Metro incidents are a common challenge faced by urban commuters, leading to delays, stress, and productivity loss. Inspired by the vision of smarter and more reliable public transit, we created MetroMind to leverage AI and data analytics in solving real-world transportation issues. Our goal is to provide commuters with better planning tools and transit operators with actionable insights for improved service reliability.
What It Does
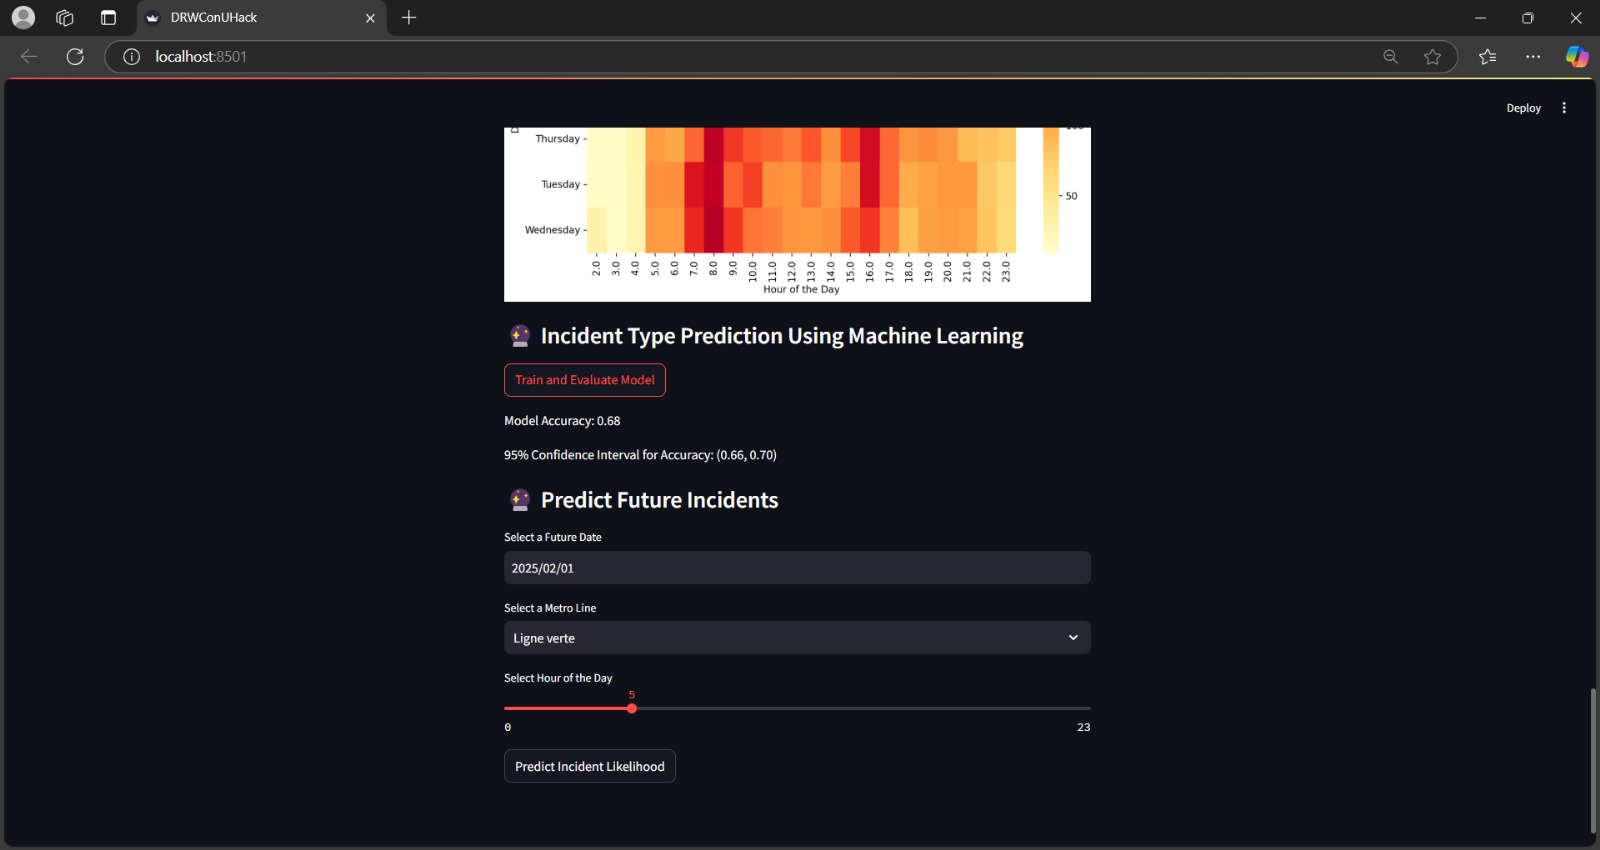
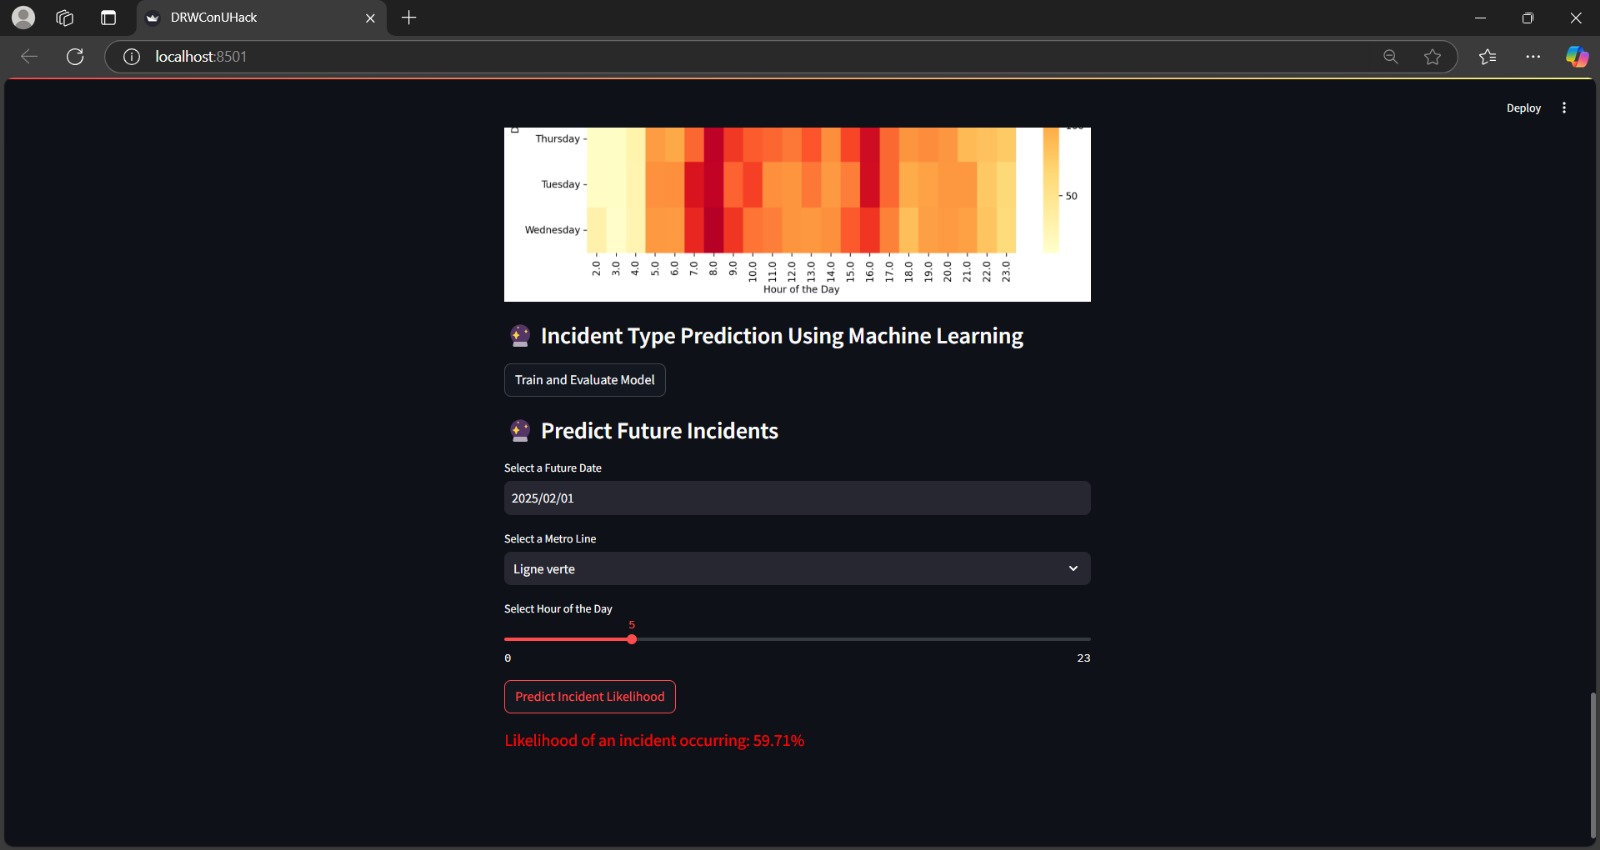
MetroMind is an AI-powered predictive analytics dashboard that:
- Predicts metro disruptions based on date, time and metro line.
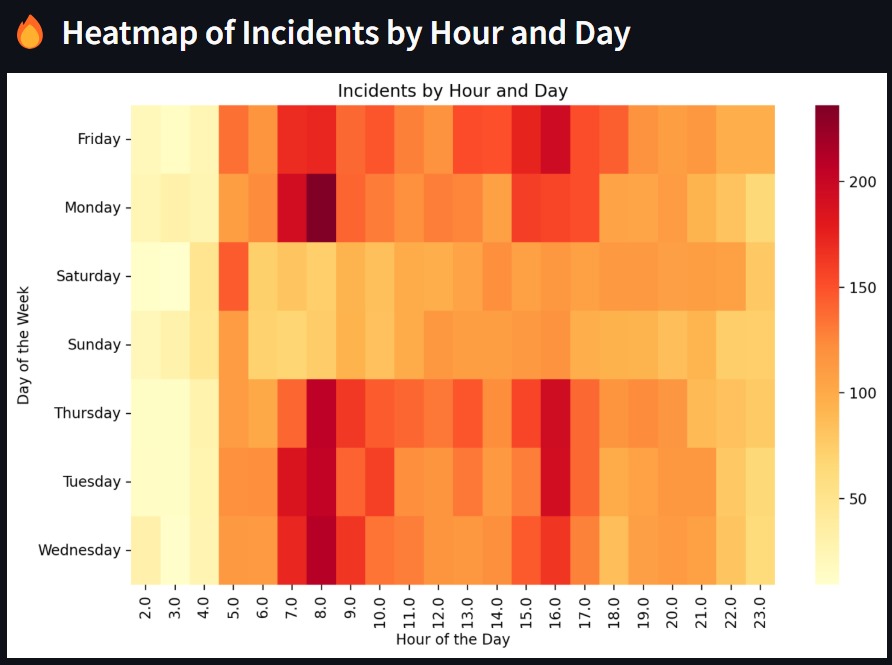
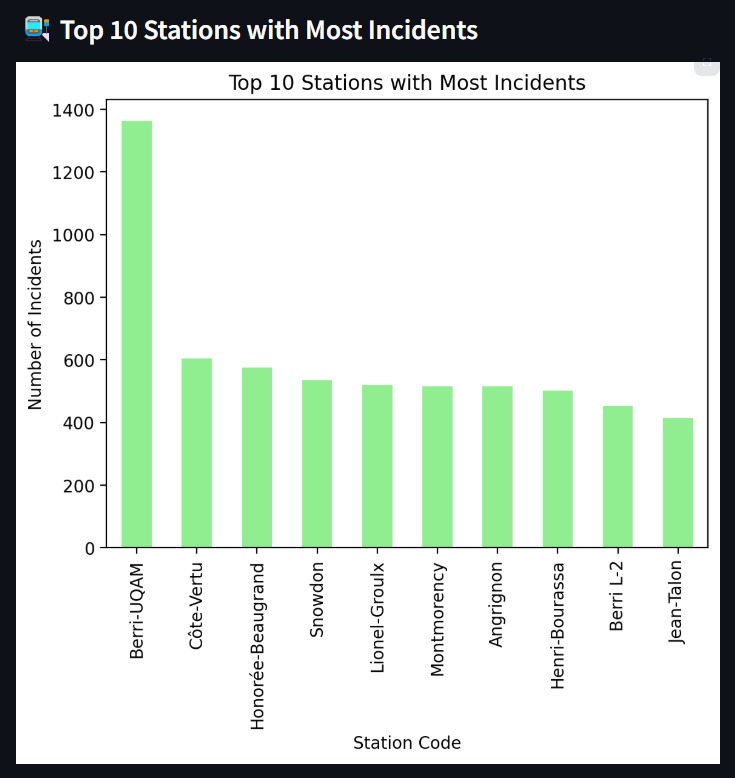
- Displays historical metro incident data and trends (pie charts, heatmaps, and line graphs).
- Supports metro management in identifying peak disruption hours and planning resources effectively.
How We Built It
- Data Collection: Metro incident data from Montreal’s Open Data platform.
- Interactive Dashboard: Built with Python and Streamlit.
- Predictive model: Train an (Multilayer Perceptron) MLP model.
Challenges We Faced
- Identifying a meaningful and relevant question
- Working under pressure
- Learning what is MLP and how to implement it to the dashboard
What We Learned
- The importance of teamwork and patience
- How to use Streamlit to create an interactive dashboard
- Applying MLP (Multilayer Perceptron) in machine learning tasks
Accomplishments We're Proud Of
- Implementing an effective predictive model for metro disruptions.
- Creating a user-centric dashboard that is both functional and visually appealing.
- Addressing a real-world problem with a scalable solution that aligns with the needs of both commuters and transit operators, aligning with DRW’s data-driven culture.operators to enhance their services.


Log in or sign up for Devpost to join the conversation.