-
-
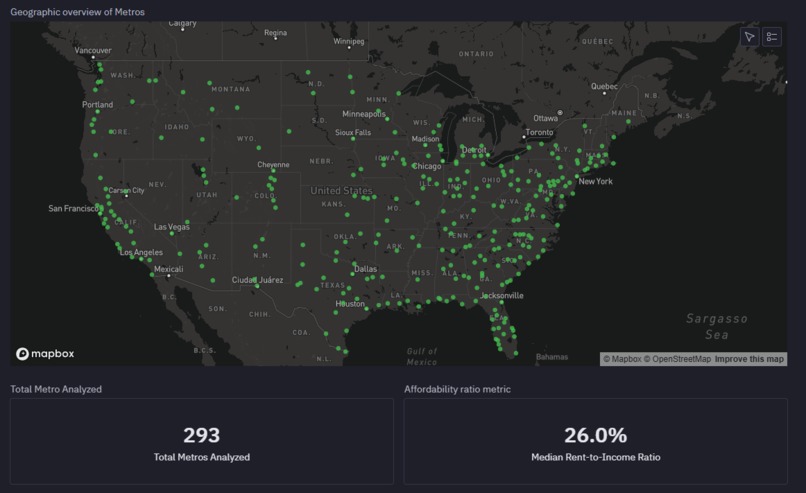
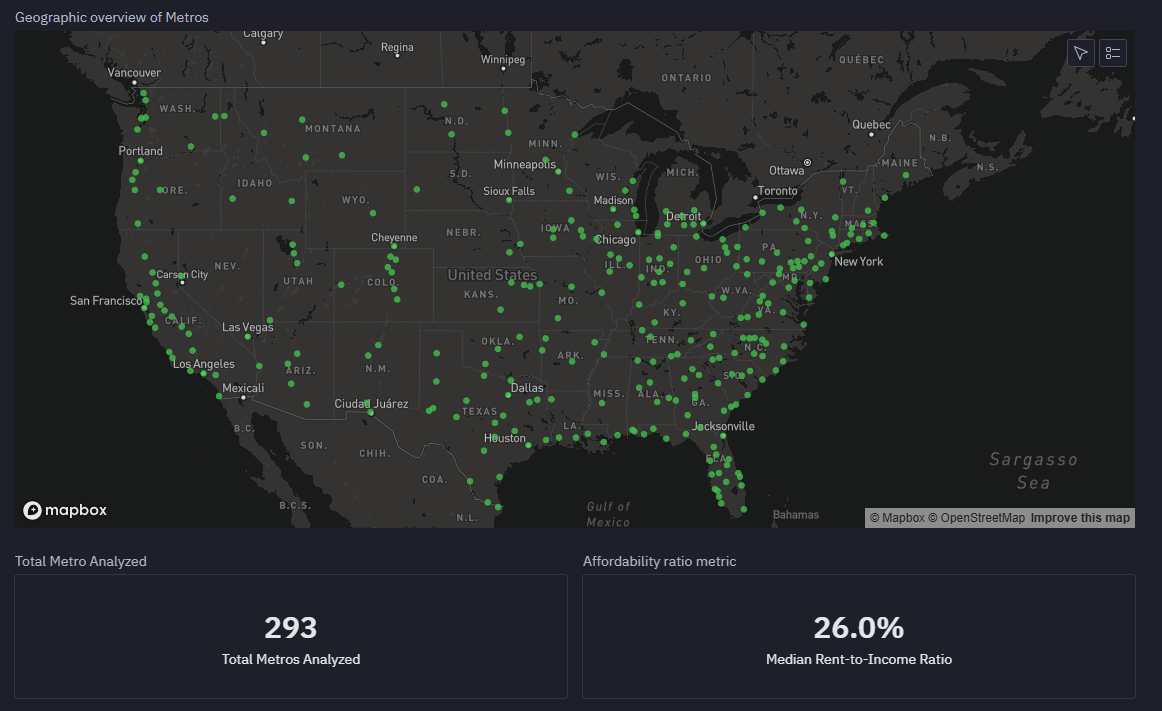
Map of 293 U.S. metropolitan areas included in the affordability analysis, showing nationwide coverage across regions.
-

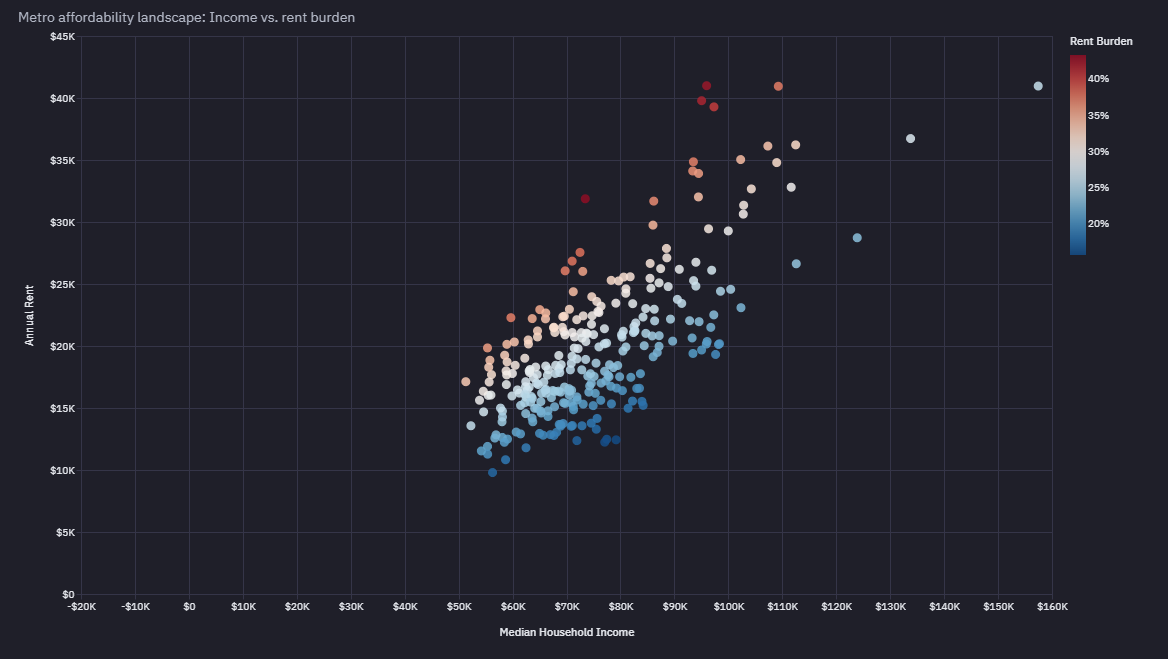
Median household income versus annual rent by metro, colored by rent burden, showing wide affordability variation at similar incomes.
-
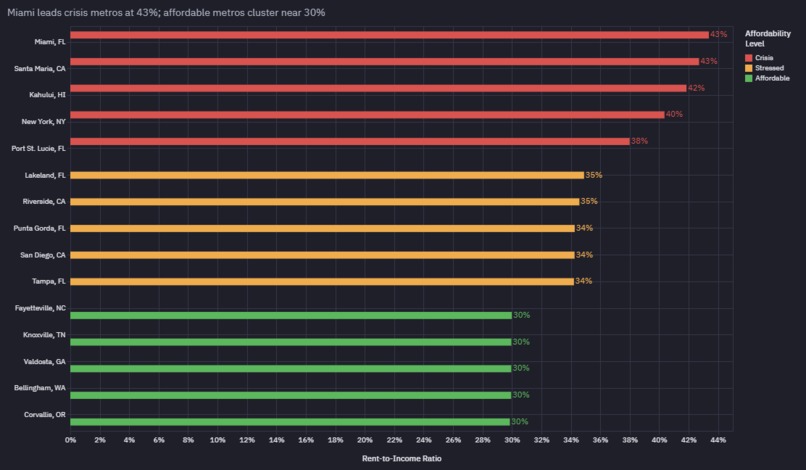
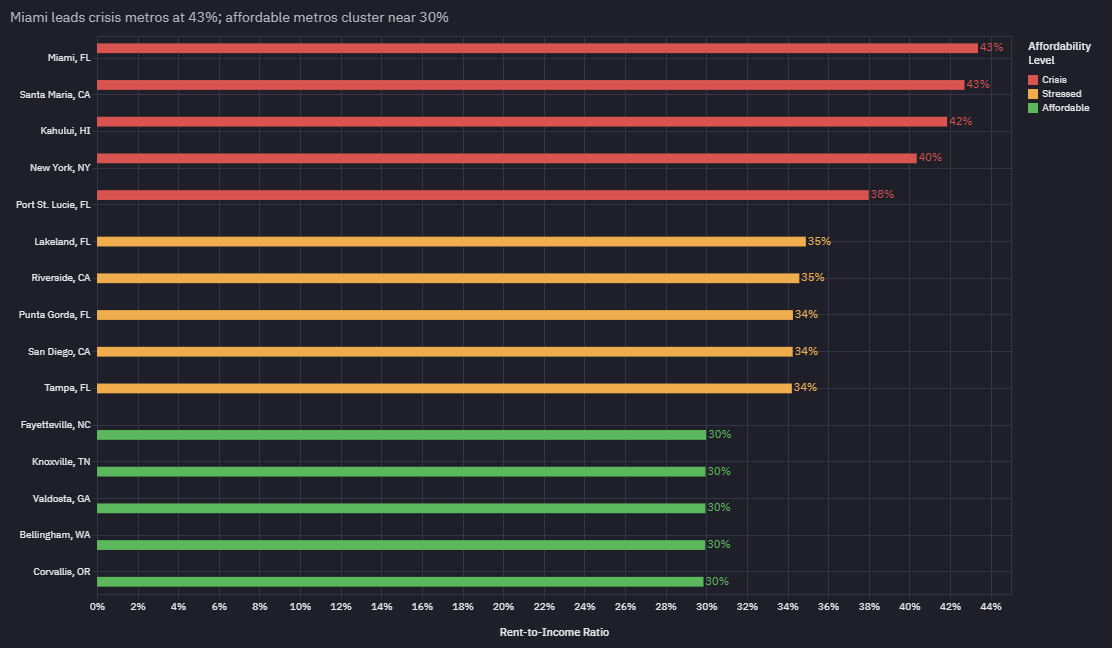
Selected metros ranked by rent-to-income ratio, highlighting crisis-level markets above 40% and affordable metros near 30%.
-
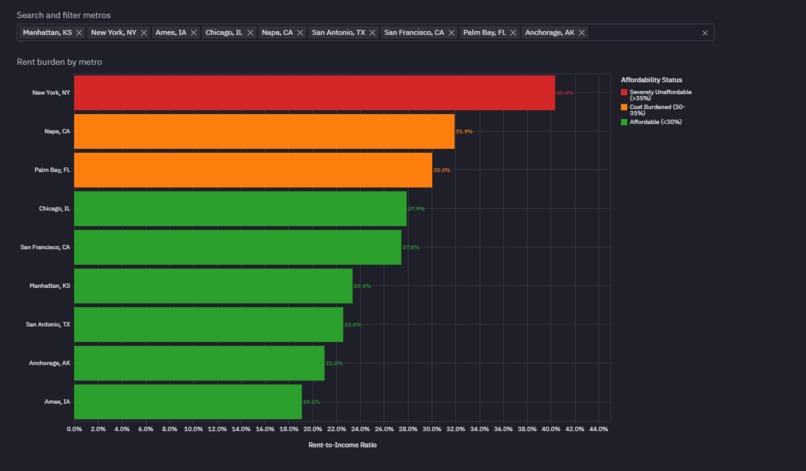
Rent-to-income ratios for selected metros, illustrating sharp affordability differences across cities.
-
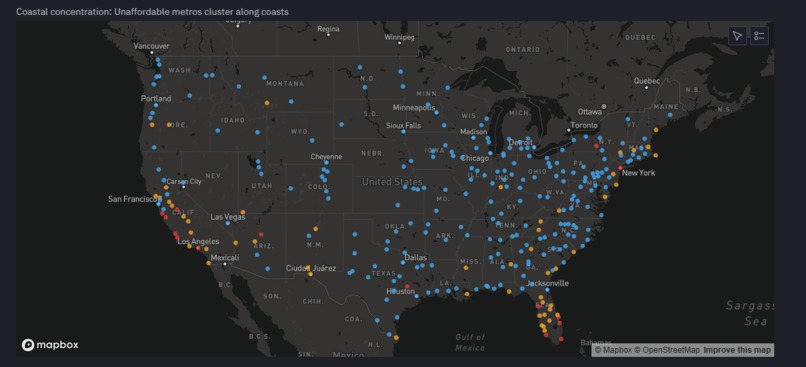
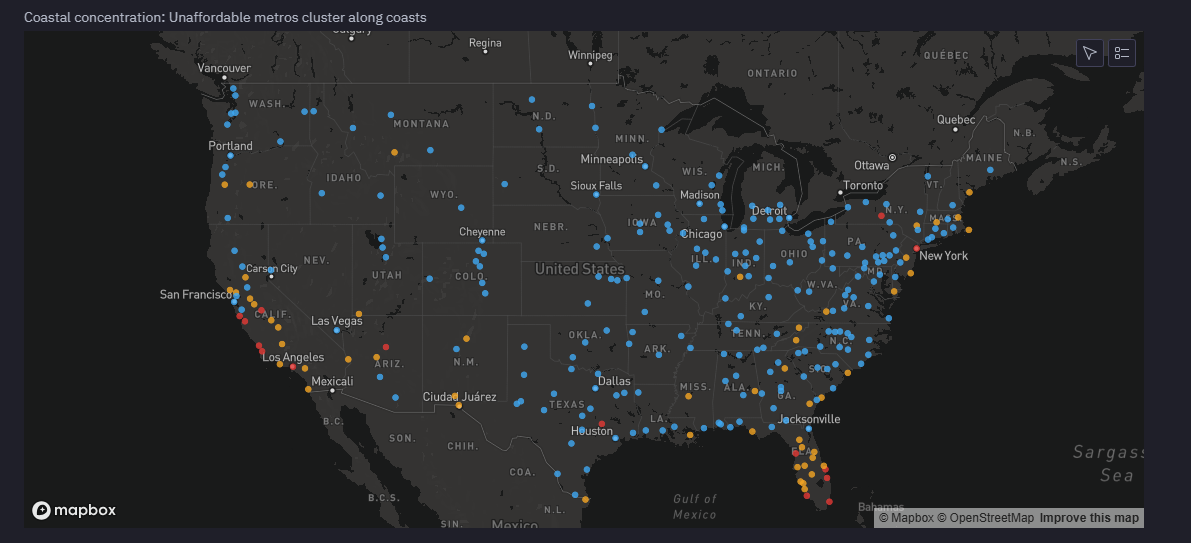
Unaffordable metros cluster along U.S. coasts, while interior metros are more often affordable.
-
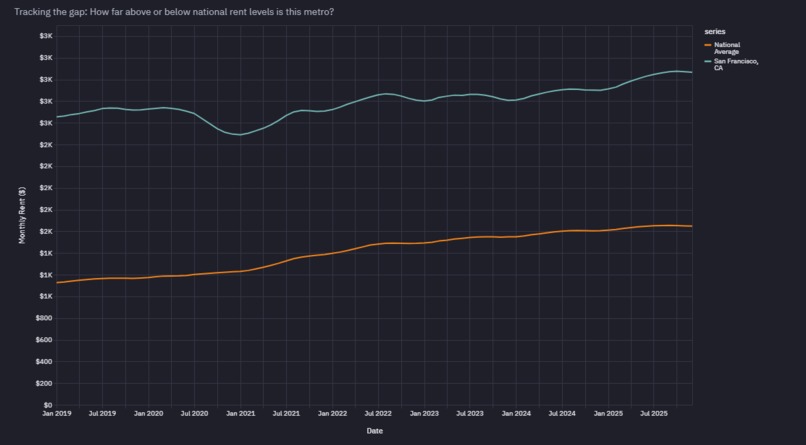
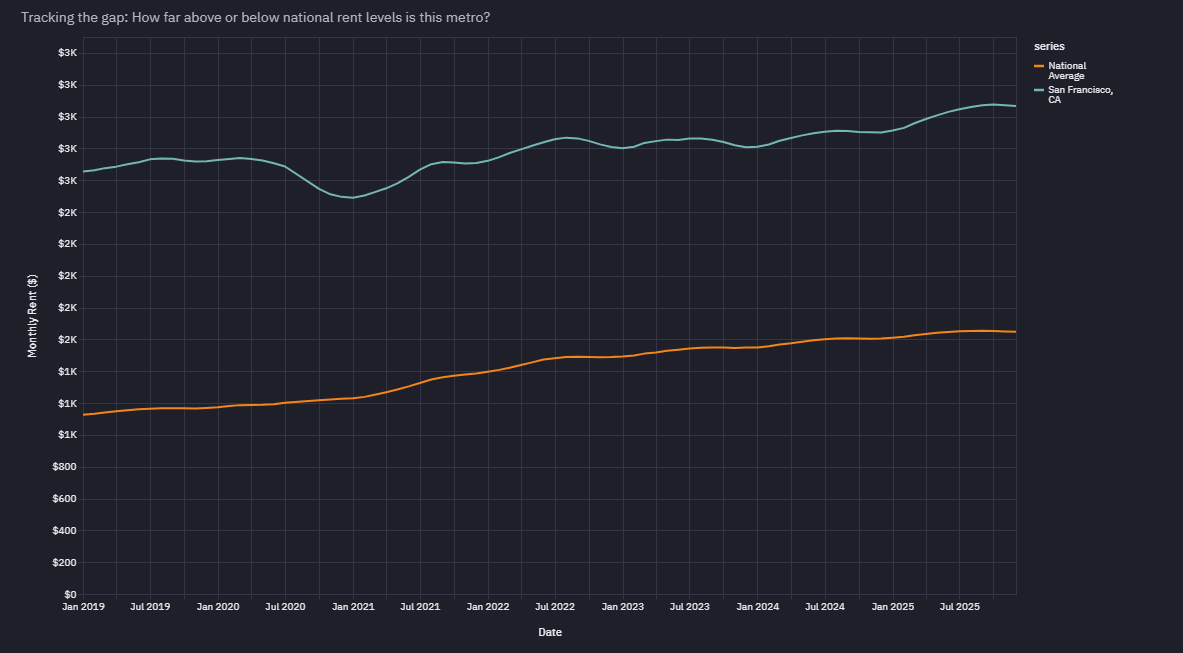
San Franciscos, CA rent trends vs. national average since 2019, showing a persistent affordability gap below national rent levels.

Inspiration
Housing affordability has become one of the defining economic challenges of our generation, as someone who has faced this issue in real life I wanted to get a deeper understanding on it.
I wanted to move beyond anecdotal narratives and create a data-driven exploration that reveals the true scope of America's affordability crisis. The goal was to build something that could answer both macro questions ("How many metros are truly unaffordable?") and micro questions ("Should I move to Austin or Denver?")—all in one interactive analysis.
What it does
Primary Purpose: Determine which U.S. metros are "affordable" (rent consumes <30% of household income) vs. "unaffordable" (>30% burden), and reveal the geographic, economic, and temporal patterns behind America's housing crisis. It uses the 30% threshold as the standard affordability benchmark (based on HUD guidelines). I have added the functionality to change this value in the interactive part of my application.
To make the app easy to use and to keep things concise I have used different types of charts and maps. I have also divided the app into multiple Tabs so that it is easy to navigate. In each tab at the end I have also added "Key Findings" which is basically a summarisation of the content in the specific tab.
To make the app interactive I have added sliders and selector so that user can get specific metros data they are looking for.
Few visualization I have added in the app:
- National metro map with lat/long coordinates
- Affordability-ranked map with color-coded markers
- Bar chart of 15 most/least affordable metros
- Histogram of affordability distribution (77% of metros < 30%)
- Filtered bar chart based on metro selection
- Seven dynamic KPI metrics updating based on selections
- Scatter plot showing income vs. rent with threshold line
I have also added Interactive feature:*
- Drop-down menu to select any of 293 metros for detailed time-series analysis
- Top/Bottom N Metros Slider
- Metro Search/Filter
- Slider to change the affordable threshold
How I built it
Data pipeline:
- Rent data (Zillow ZORI): Unpivoted wide-format monthly columns into long format, filtered to MSAs with 60+ months of data since 2019
- Income data (Census ACS): Extracted median household income, cleaned metro names
- The join problem: Standard name matching failed for 40+ major metros due to multi-city/multi-state complexity
- Expansion solution: Split "Kansas City, MO-KS" into ["Kansas City, MO", "Kansas City, KS"] using Cartesian products of cities × states
- Metric calculation: Computed rent-to-income ratios, YoY growth, affordability categories
Architecture:
- SQL for transformations: Chained SQL cells for unpivoting, filtering, windowing (LAG for YoY calcs)
- Python for complex logic: Metro name expansion, coordinate mapping, reshaping for multi-series charts
- Explore cells for viz: Interactive charts with proper formatting, color-coding, and drill-down capability
- Progressive disclosure: Organized into collapsible sections (Executive Summary → Deep Dive) so users can go as shallow or deep as needed
Challenges I ran into
Challenge 1: The "Troy, NY" mystery My initial join matched 253 metros but was missing Albany-Schenectady-Troy. Debugging revealed Census had "Albany-Schenectady-Troy, NY" as one entity, but Zillow tracked "Troy, NY" separately. This led to the expansion strategy.
Challenge 2: Coordinate data Maps need lat/lon, but neither dataset included them. I manually compiled a 300+ metro coordinate dictionary. Future version would geocode programmatically.
Challenge 3: Temporal mismatch Census income data is 5-year ACS estimates (2019-2023) while rent data is current (Aug 2025). This creates a subtle bias where income may be understated if wages grew post-survey. No clean fix, but I documented it in the limitations section.
Challenge 4: Performance Several SQL cells took 1+ second to run with 72k+ rent observations. Learned to filter early, aggregate intentionally, and use CTEs (or chained cells) instead of massive joins.
Challenge 5: Storytelling vs. completeness I wanted to show everything the data could reveal, but that risked overwhelming users. The solution was layered sections—exec summary for quick answers, deep dive for explorers. Input parameters let users control detail level.
Accomplishments that I am proud of
The metro name expansion logic is my favorite technical accomplishment—it solved a real data engineering problem elegantly. But I'm most proud of how the analysis scales from 30,000-foot view to individual metro deep dives without losing coherence. You can see the national pattern, then drill into "Why is Miami so unaffordable?" with a single dropdown.
This project taught me that good data analysis requires both technical chops and empathy—understanding not just how to wrangle data, but why someone would care about the answer.
What I learned
Data wrangling is 80% of the work. The biggest challenge wasn't building visualizations—it was getting Zillow and Census data to talk to each other. Metro naming inconsistencies turned what should have been a simple join into a multi-day debugging odyssey.
The Cartesian product solution. When I discovered "Minneapolis-St. Paul-Bloomington, MN-WI" needed to match 6 different city-state combinations in the rent data, I learned to embrace expansion logic. Creating 520+ synthetic metro combinations from 293 source records felt wrong at first, but it solved the join problem elegantly.
Affordability isn't just about rent levels. Building the scatter plots revealed something counterintuitive: San Jose has the nation's highest rents but isn't the most unaffordable because incomes match. Meanwhile, Miami has lower absolute rents but faces a crisis because wages lag. The ratio is everything.
Temporal patterns matter. Year-over-year growth rates told a richer story than static snapshots. The pandemic spike, subsequent correction, and regional divergence only became clear when viewing full time series.
What's next for Metro Rent Affordability Analysis
In the future I want to keep on working on it and integrate the functionality to search based on zipcodes too.

Log in or sign up for Devpost to join the conversation.