Inspiration
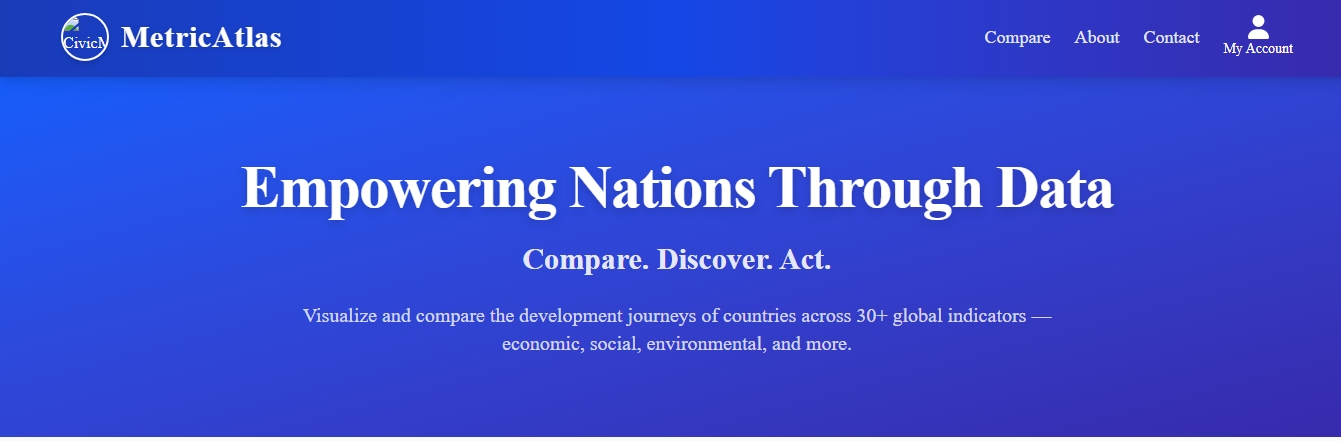
We were inspired by the challenge of understanding and comparing how different countries perform across key development areas like economy, health, education, and environment. Most global data sources are either too complex or scattered. We wanted to build a platform that makes exploring this data easier and more visual, especially for students and curious learners like us.
What it does
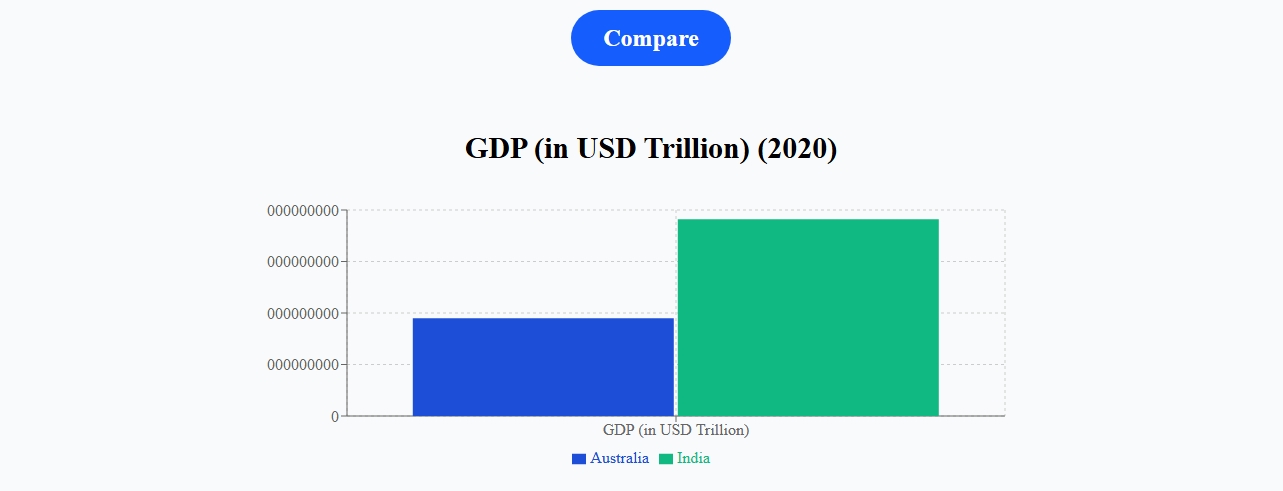
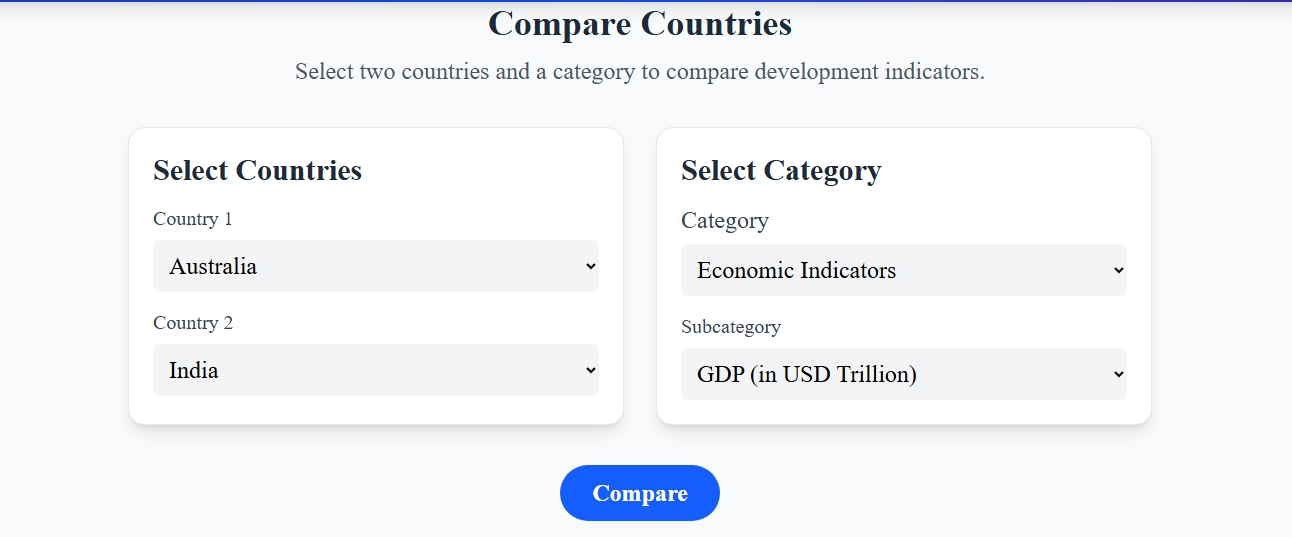
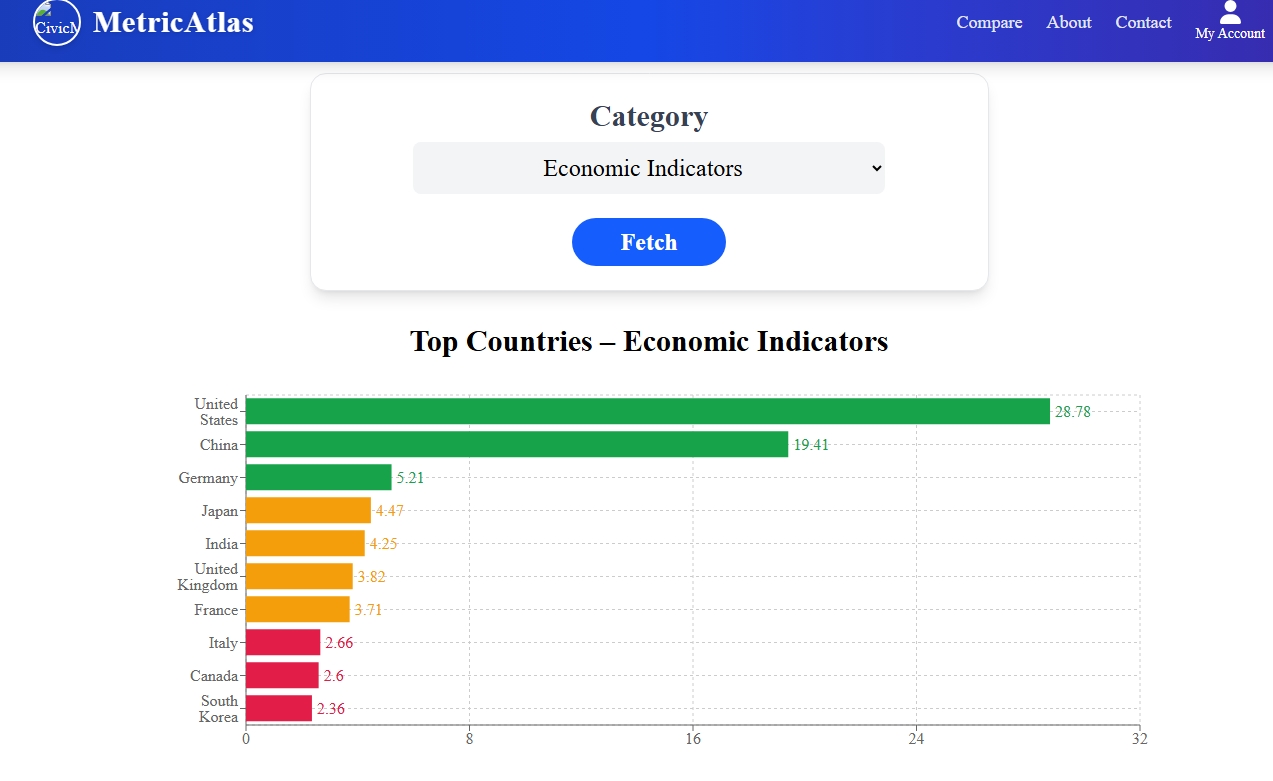
MetricAtlas allows users to compare countries across various development metrics using interactive charts. Users can select multiple countries, choose categories like health or education, and view how each country is performing over time. The platform makes complex data easy to understand through clean visuals and a user-friendly interface.
How we built it
We built MetricAtlas using React.js for the frontend and Tailwind CSS for styling. The data is stored in JSON format and fetched dynamically using the fetch API. For charts, we used Recharts to create responsive and interactive visualizations. We structured the app with reusable components like country selectors, category filters, and a comparison view.
challenges we ran into
Handling inconsistent or missing values in datasets Making the UI responsive across screen sizes Ensuring dynamic comparisons worked smoothly Managing time and features within the submission deadline
Accomplishments that we're proud of
Successfully built a working dashboard that displays real-time comparisons Clean and responsive UI with intuitive navigation Learned to fetch and handle complex datasets effectively Integrated multiple features like country search, dynamic charts, and filters
What we learned
Working with real-world, messy datasets Improving component-based development using React How to manage asynchronous operations and state updates The value of clean UI/UX when presenting data
What's next for MetricAtlas
Add support for more datasets and years Introduce user login to save comparisons Add dark mode and accessibility features Improve mobile responsiveness further Allow exporting visual reports as images or PDFs
Built With
- javascript
- localapi
- react
- recharts
- tailwind


Log in or sign up for Devpost to join the conversation.