
Inspiration
What if the number everyone is celebrating is the very number hiding the problem?
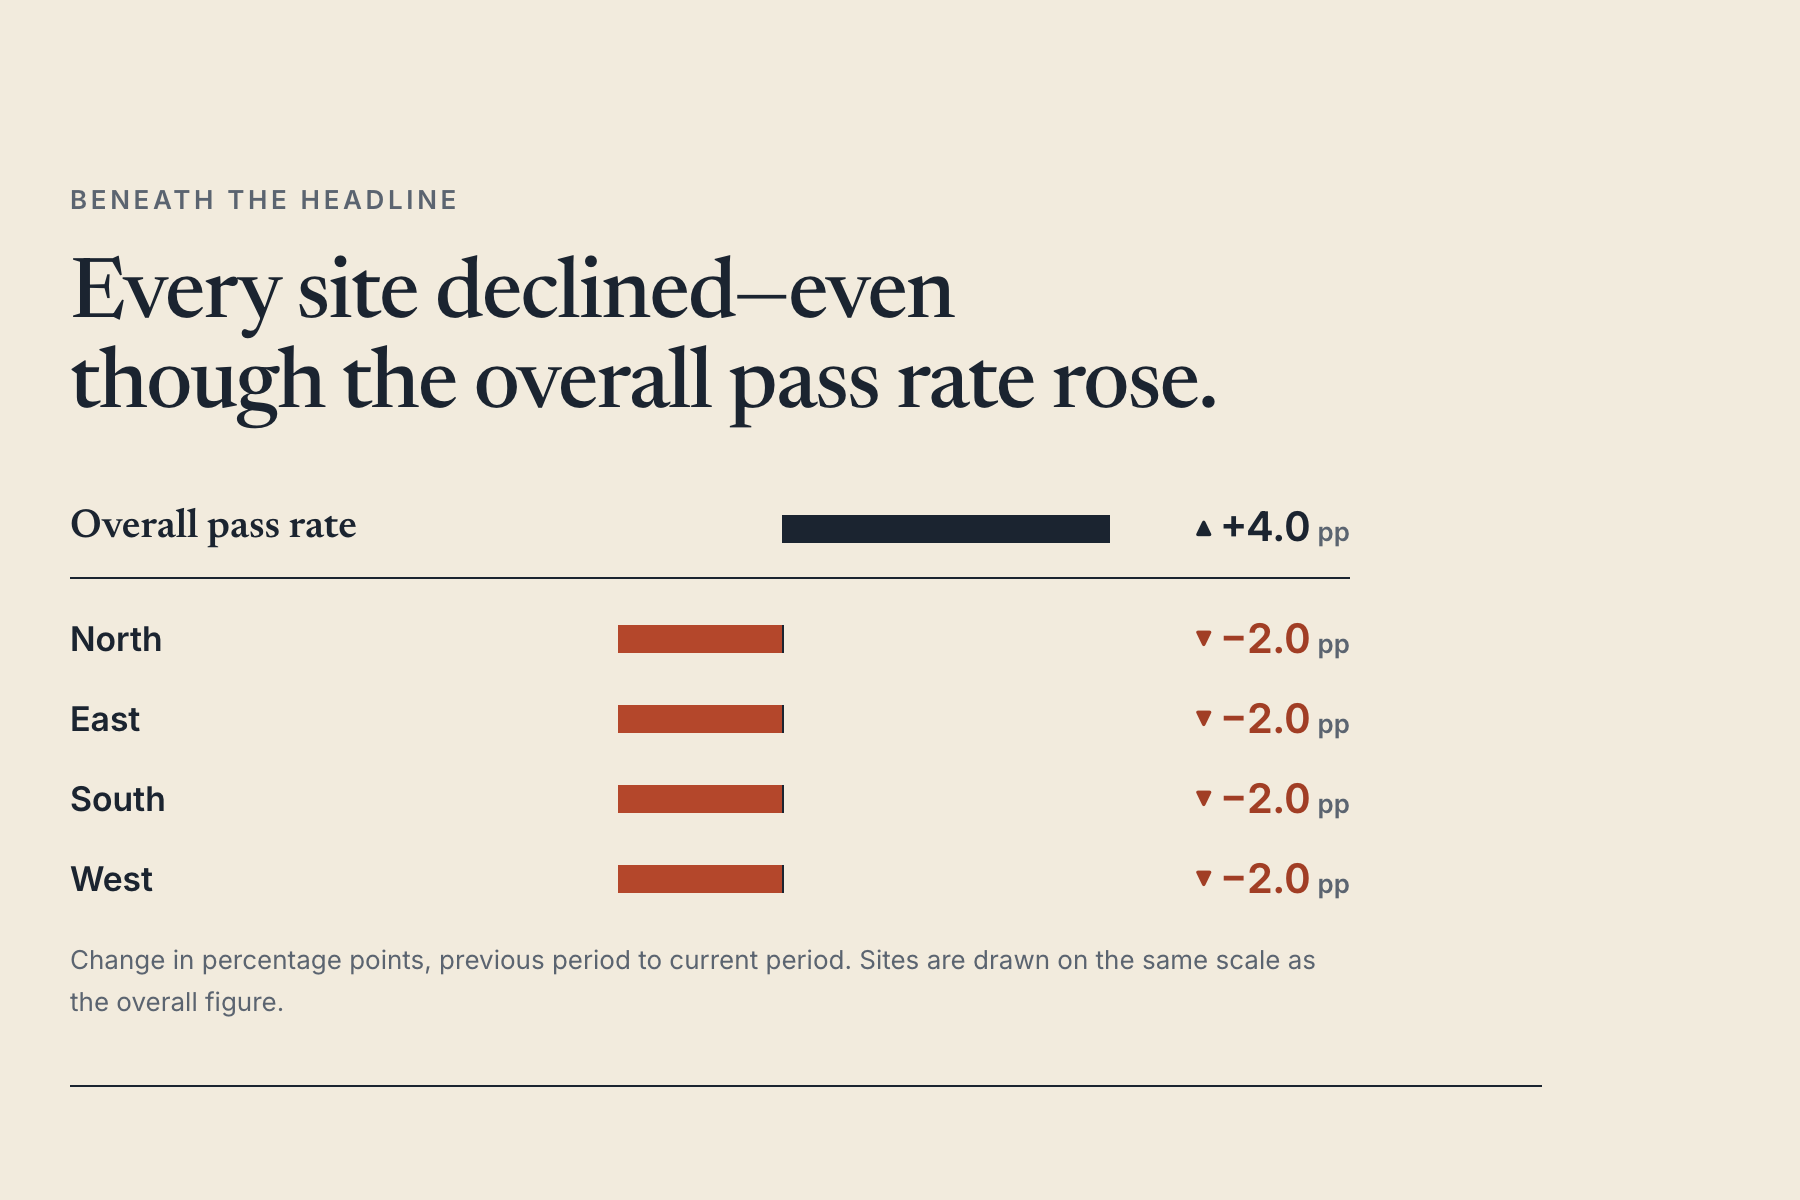
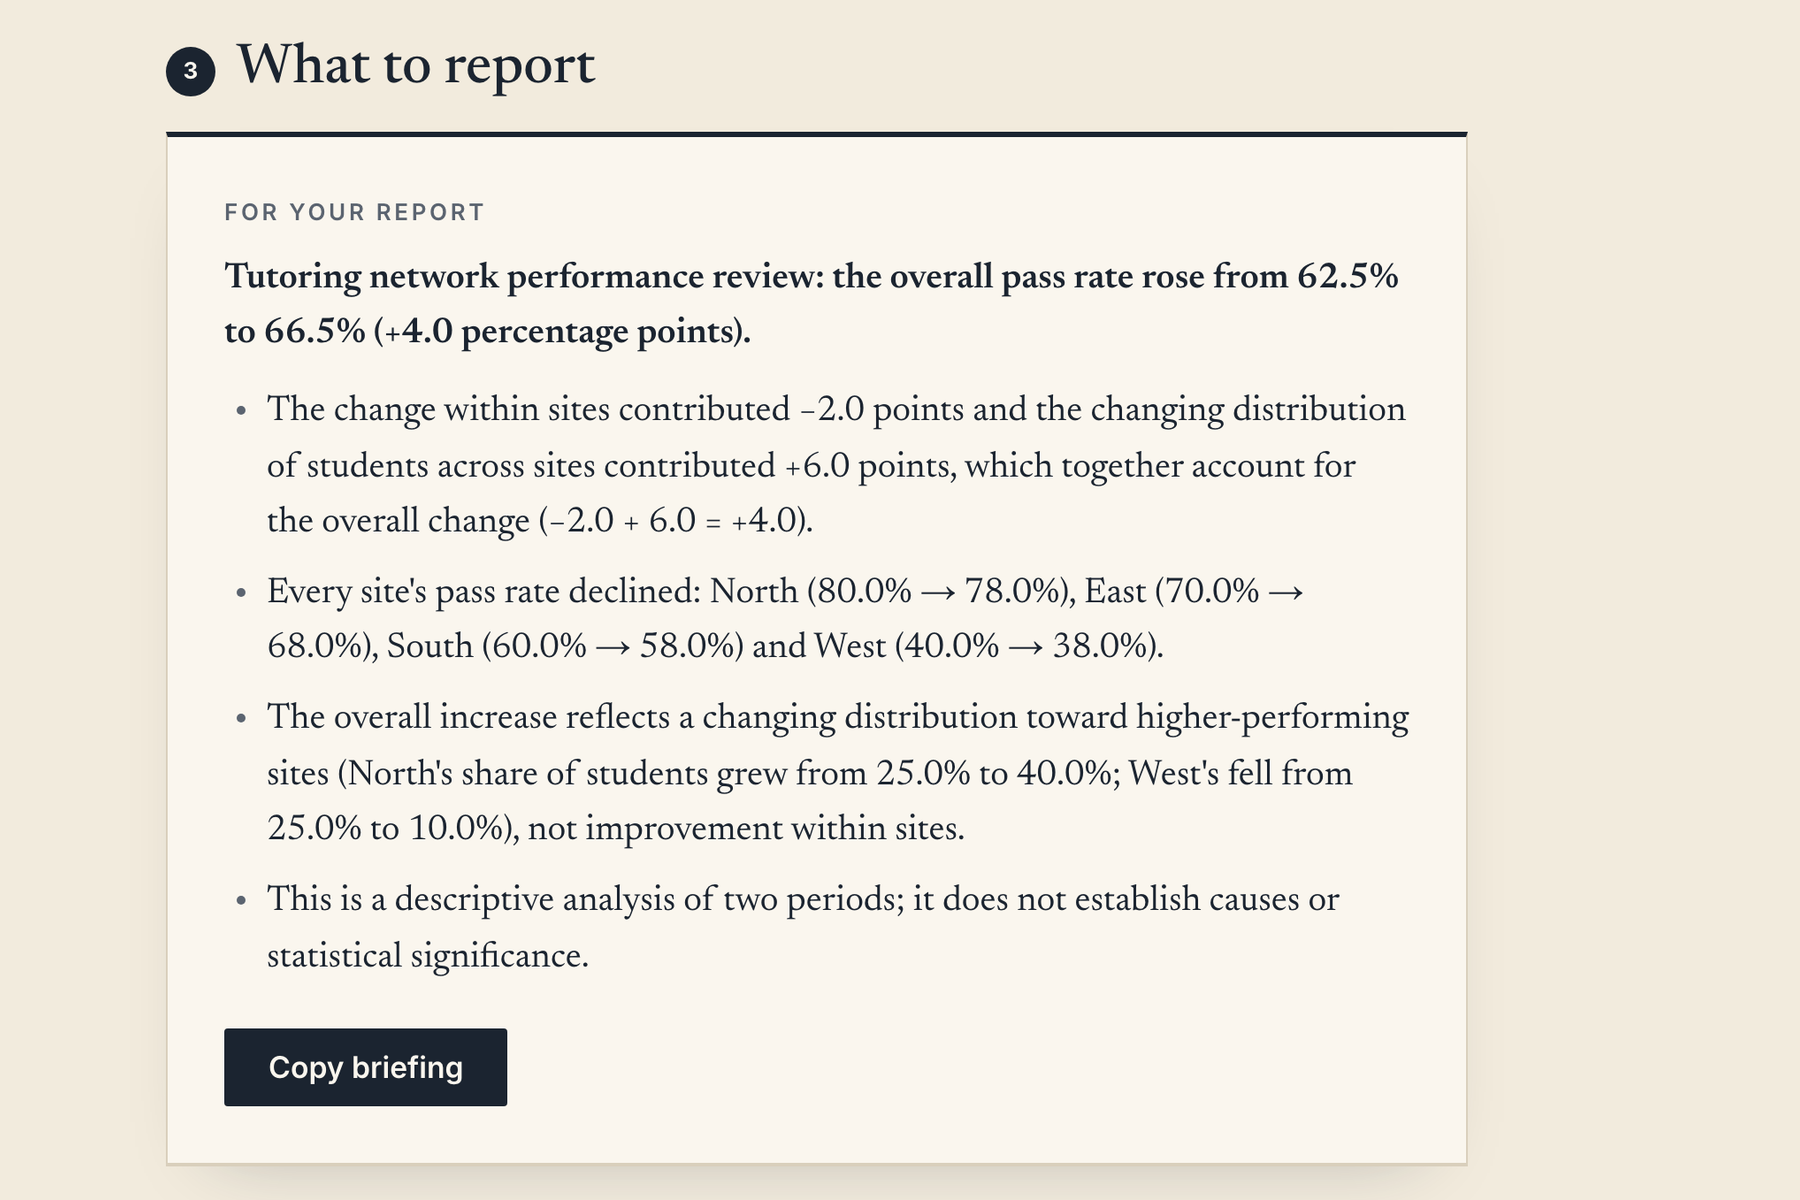
Imagine a tutoring network reporting that its overall student pass rate has improved from 62.5% to 66.5%. Leadership sees a four-percentage-point increase. It looks like progress, and that number could influence decisions about funding, resources, and future priorities.
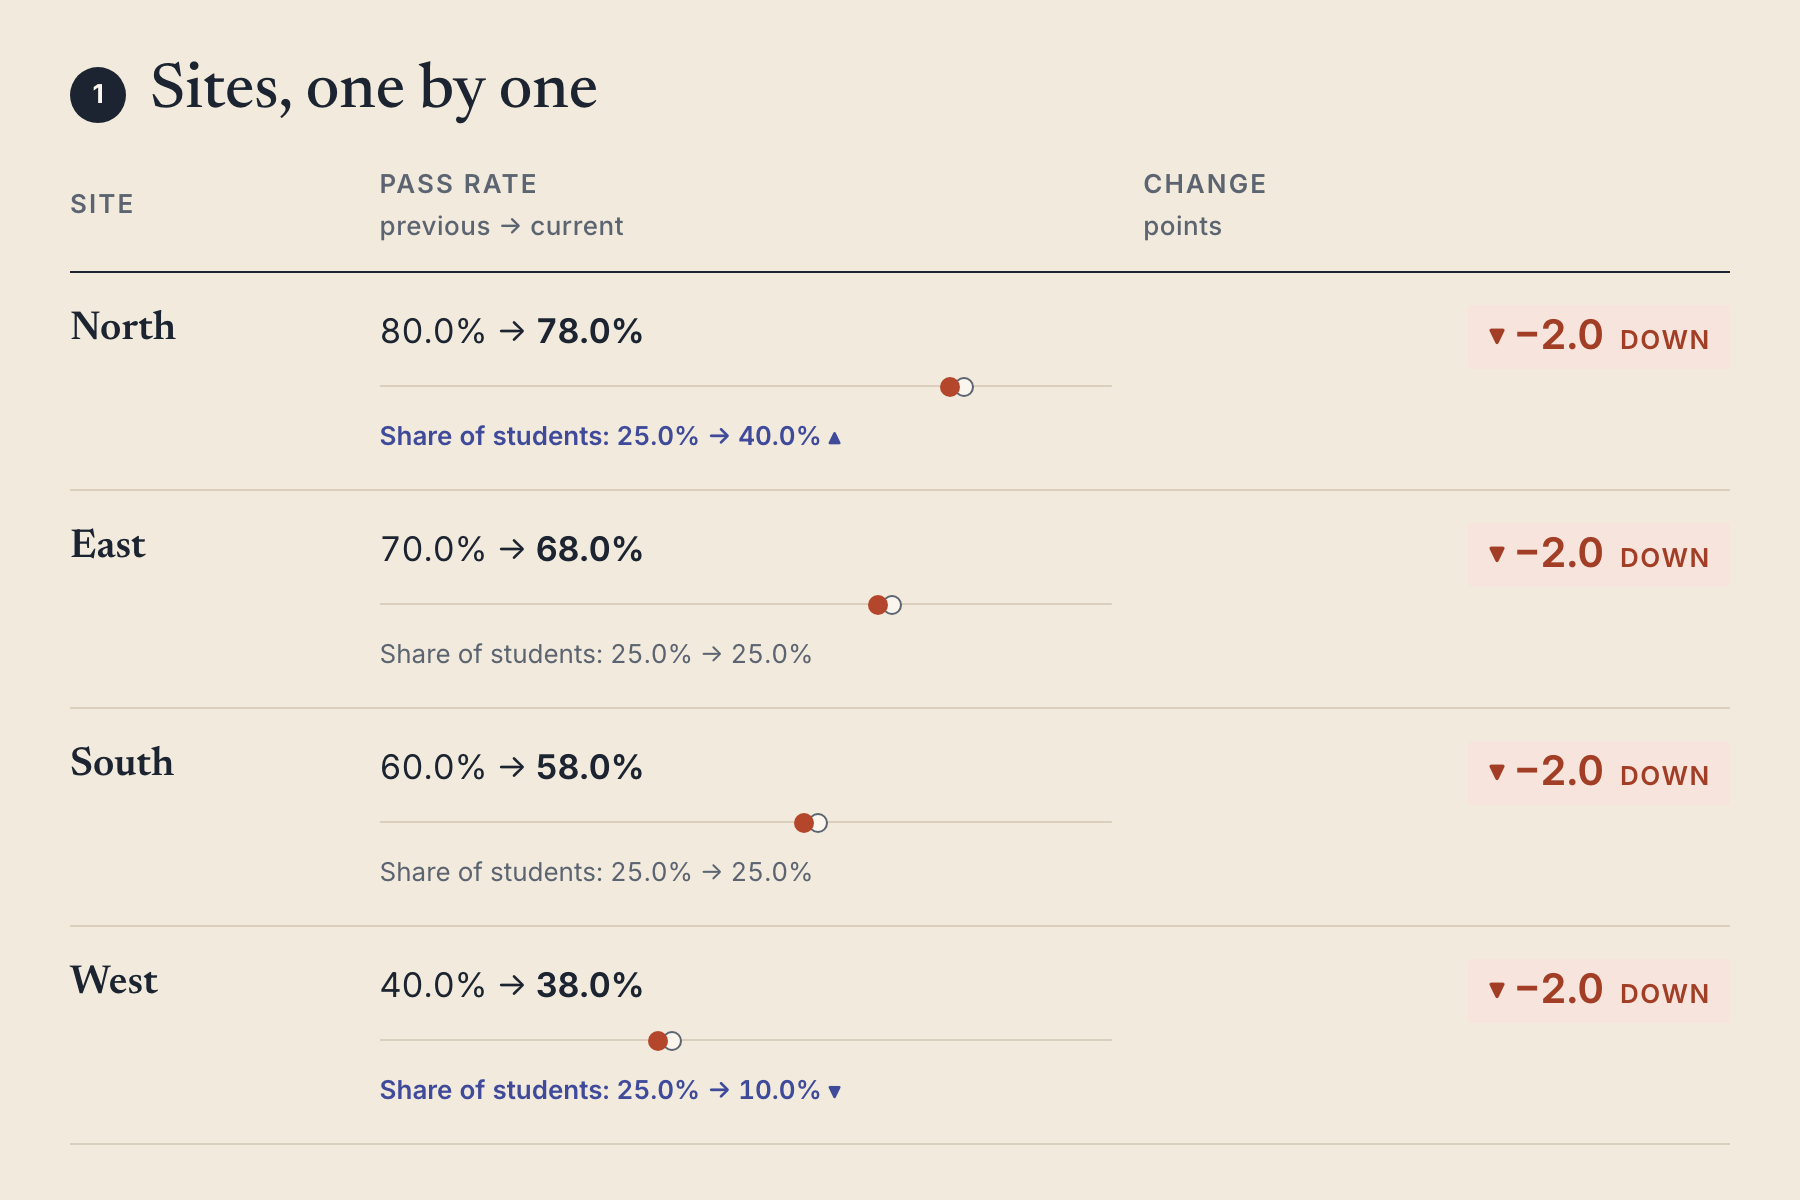
But beneath that encouraging headline lies a surprising truth: every individual tutoring site actually performed worse.
The overall figure isn't incorrect. The interpretation is incomplete.
That contradiction inspired Metric Mirage.
We live in a world where dashboards, KPIs, and performance reports influence important decisions every day. Yet it's easy to focus on whether a number increased or decreased without questioning what actually drove the change.
I wanted to build something that encourages us to ask a better question.
Not just "What changed?" but "Why did it change?"
Metric Mirage grew from that idea: making hidden patterns understandable, making analytical explanations accessible, and helping people look beyond the headline before making decisions.
What it does
Metric Mirage is an interactive KPI investigation tool designed for analysts, operations teams, and anyone responsible for preparing performance reports.
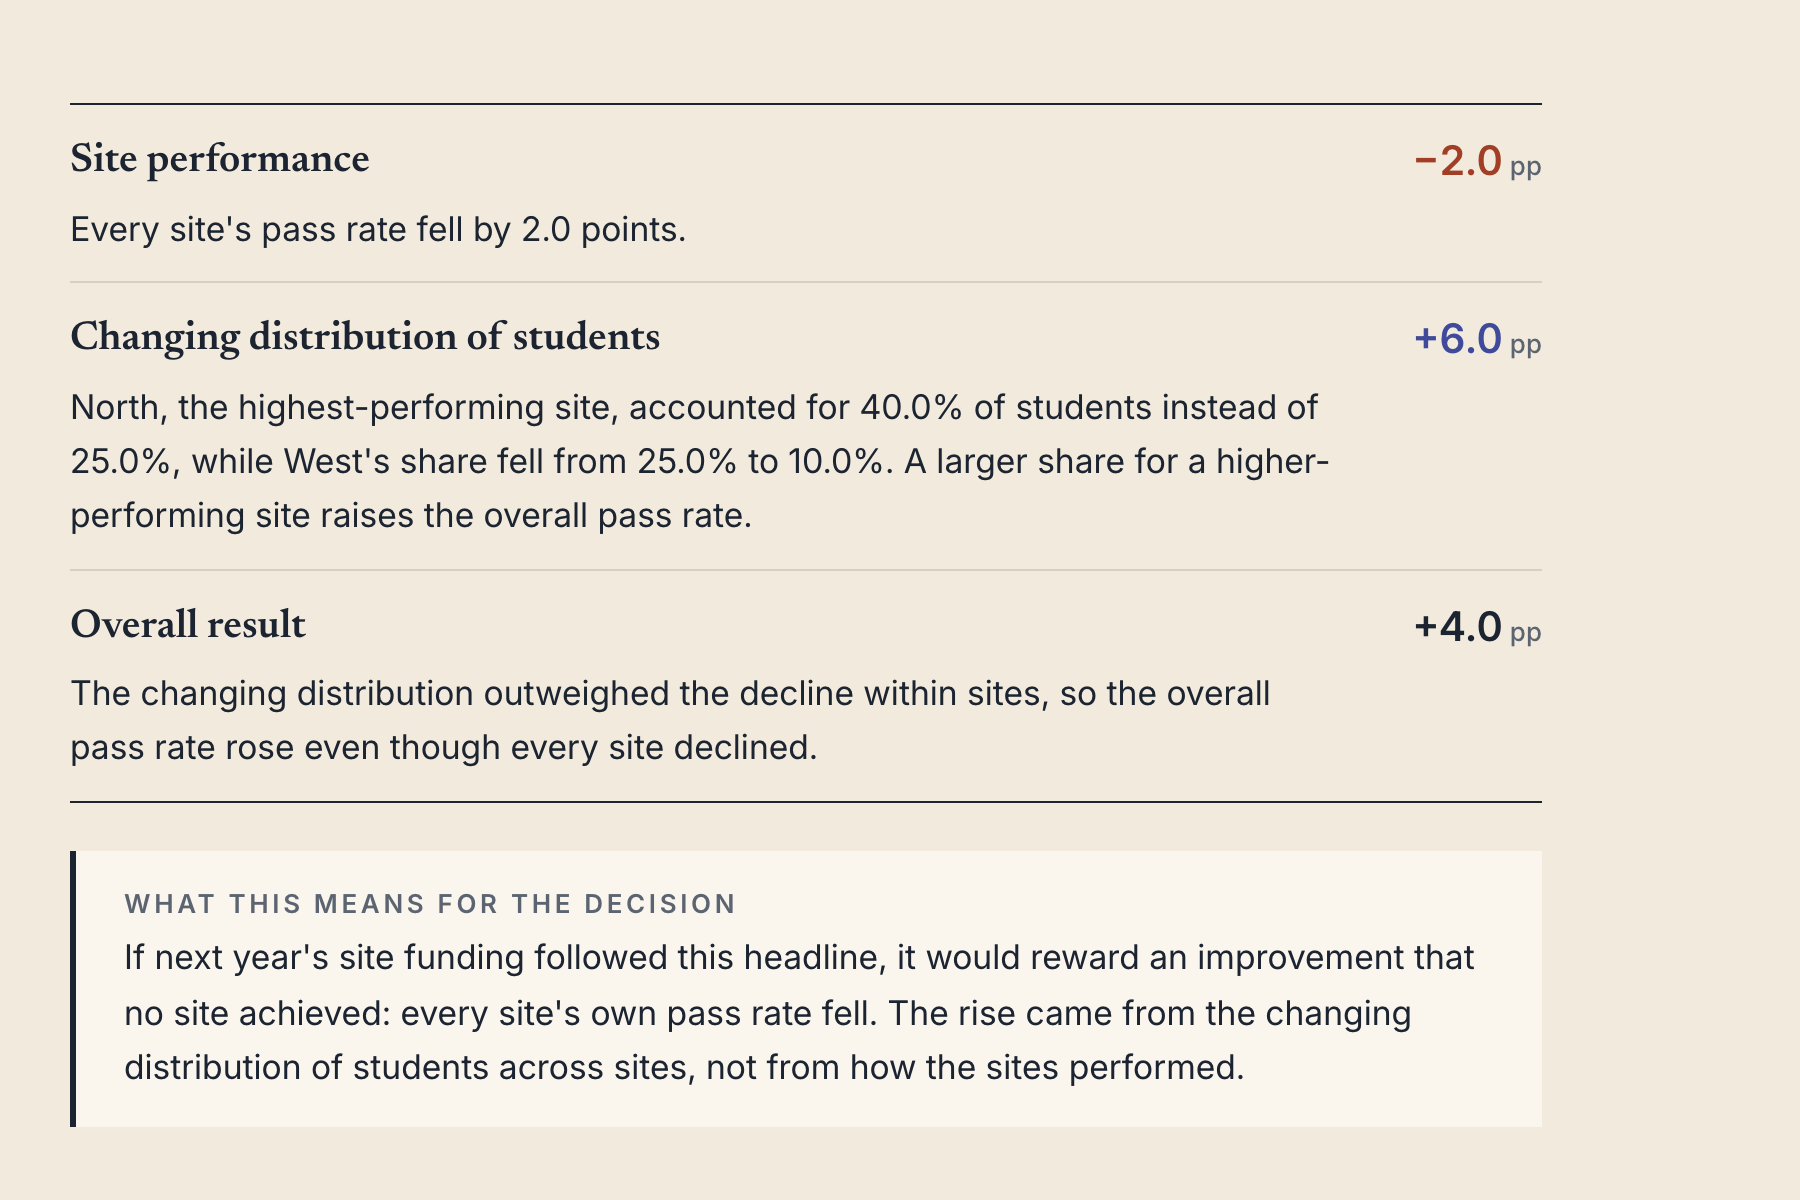
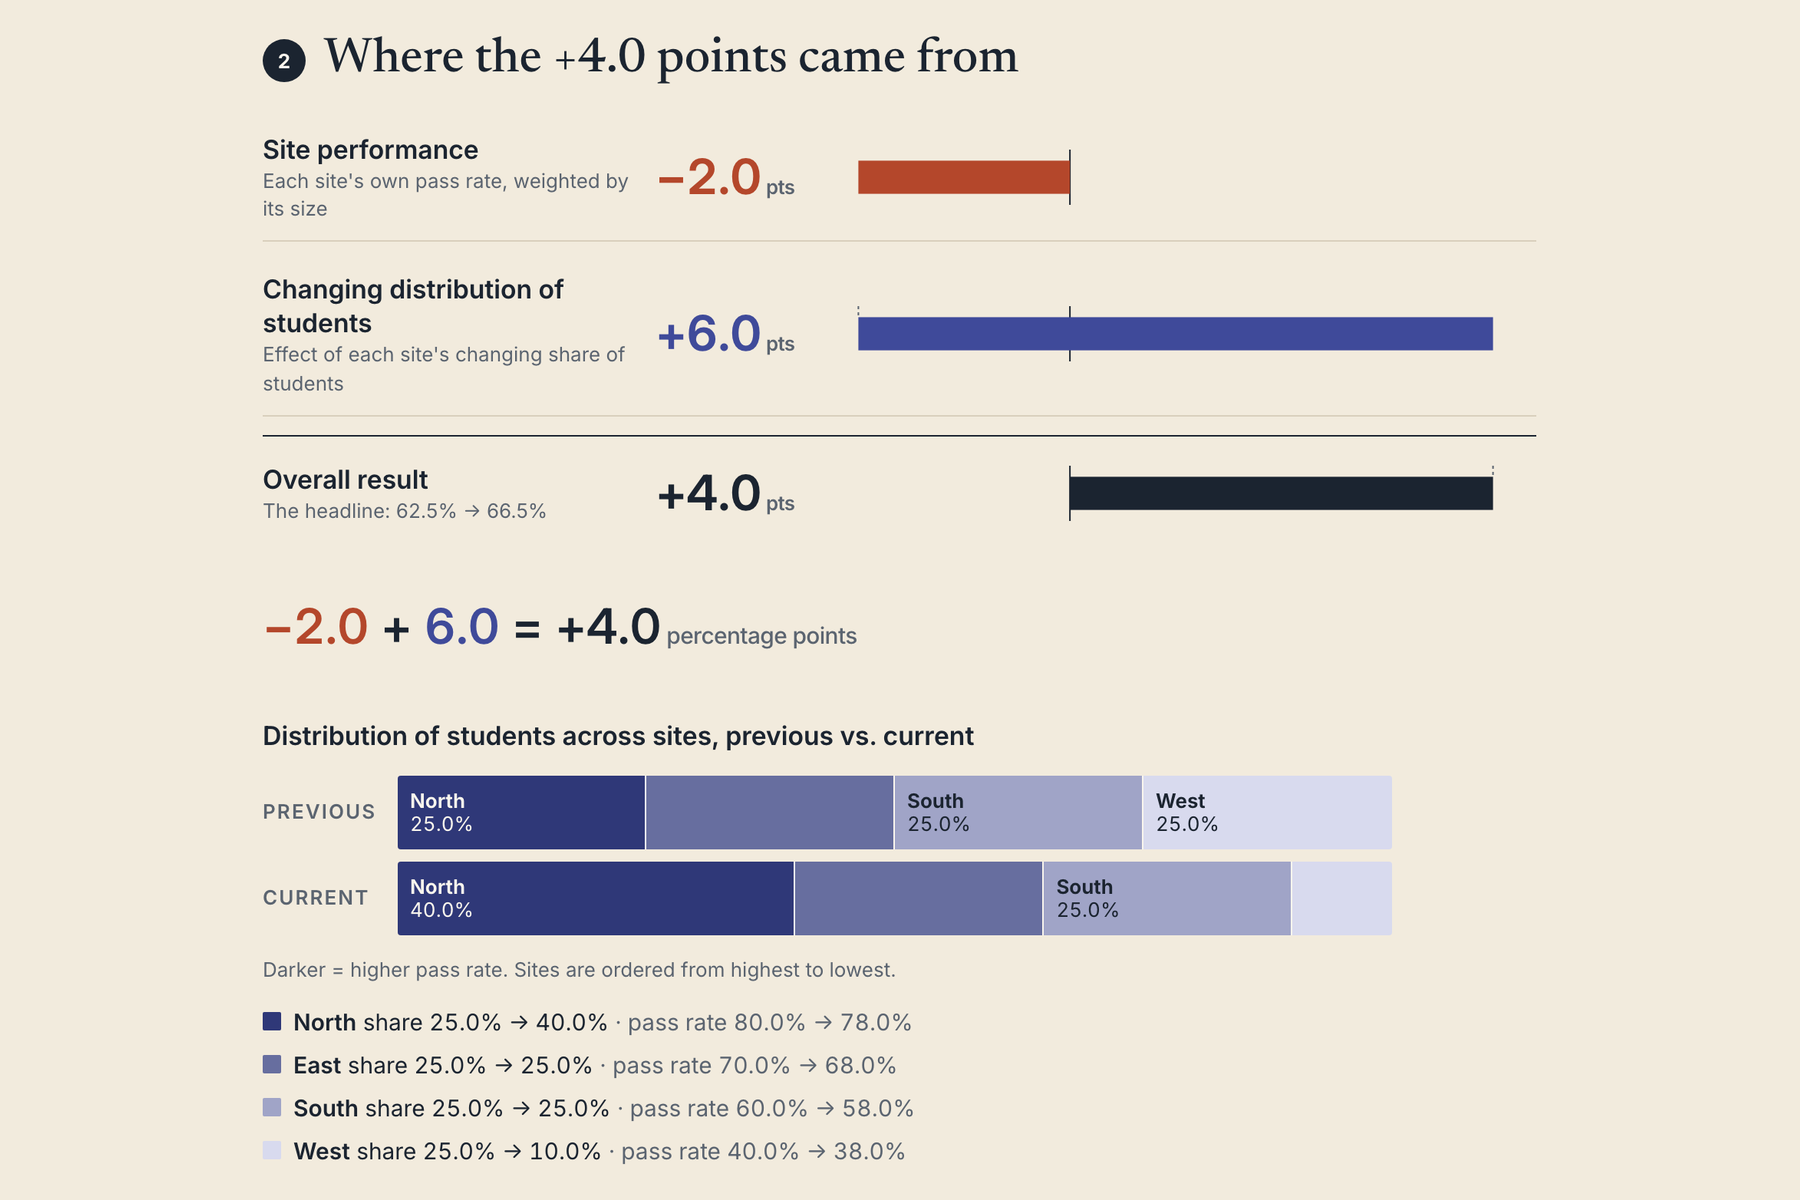
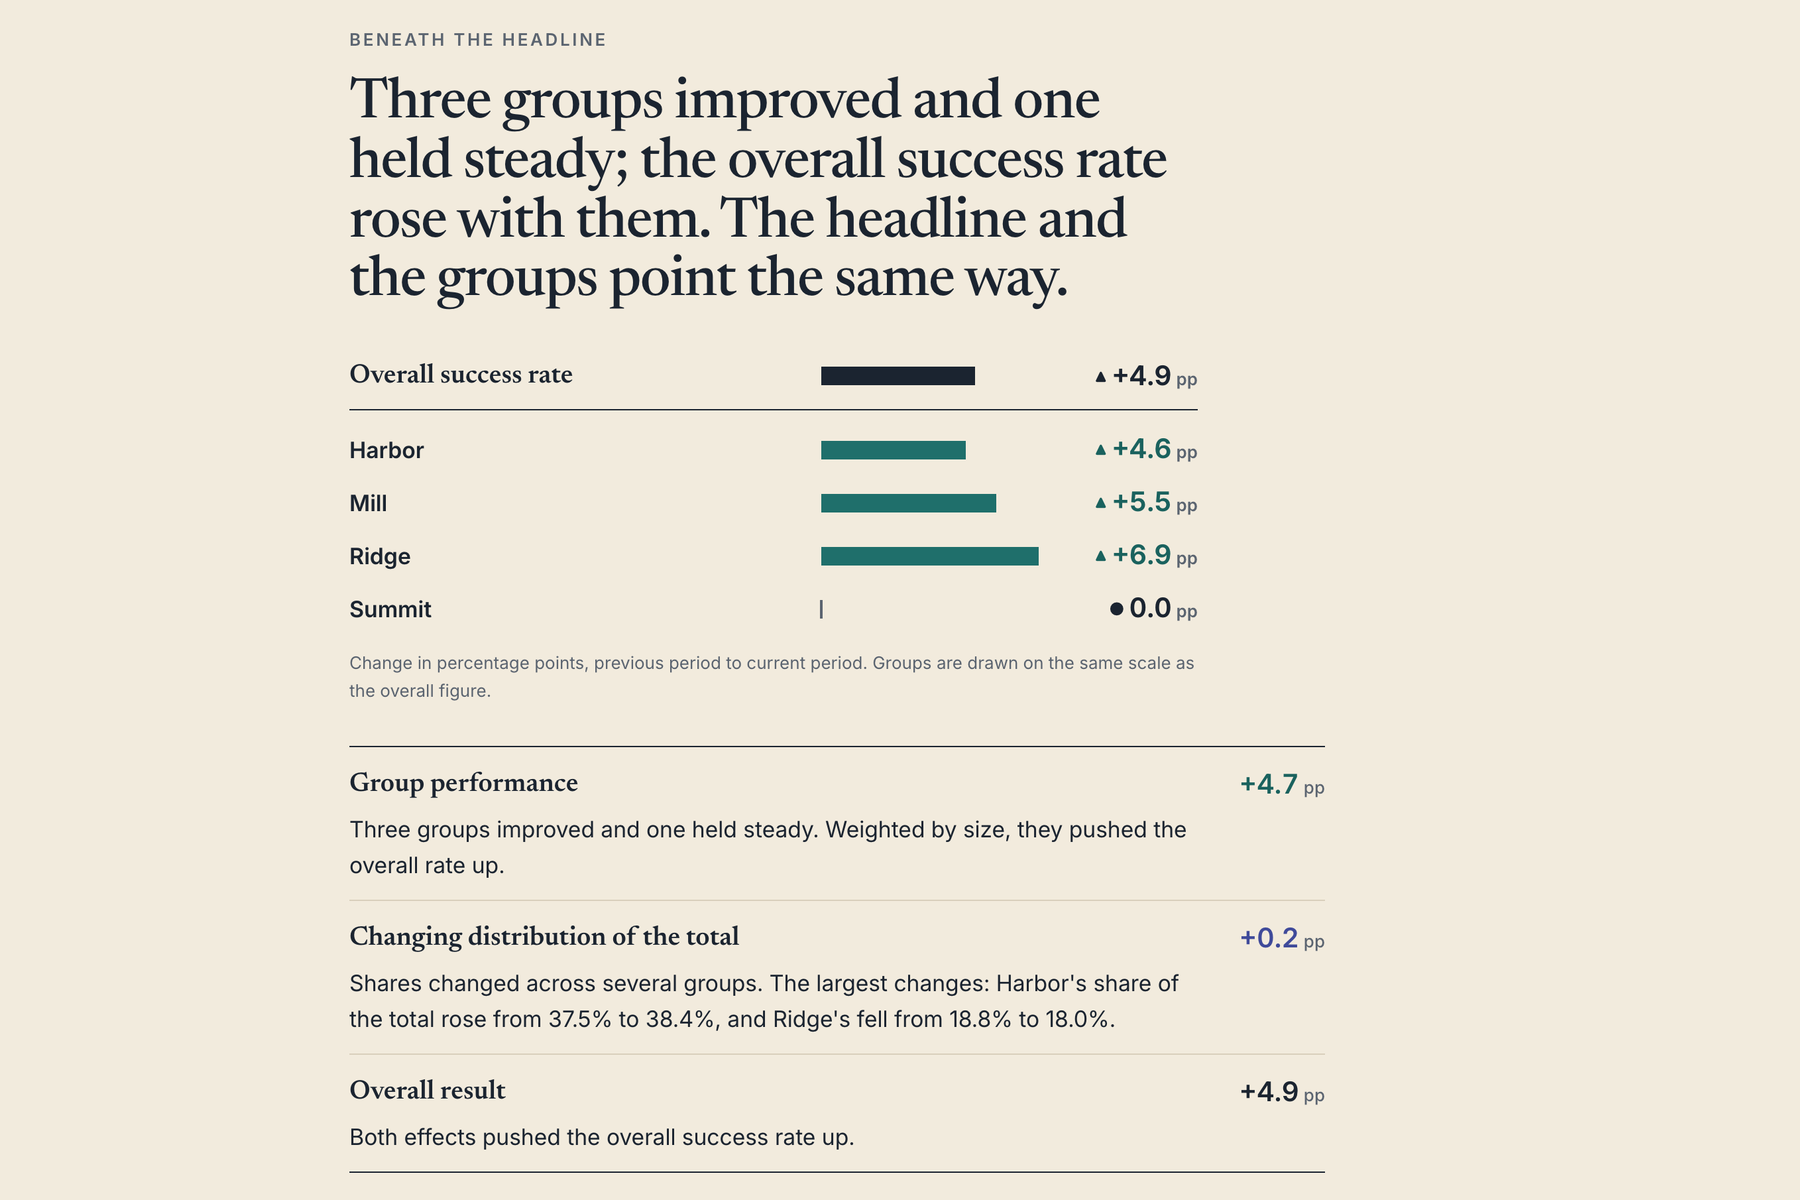
It helps users understand how an overall success rate changed between two periods by separating two effects:
- Performance within groups: Did the individual groups genuinely improve or decline?
- Changing group distribution: Did the overall result change because different groups accounted for different proportions of the total?
Using a fictional tutoring network, Metric Mirage demonstrates how every site's pass rate can decline by two percentage points while the overall pass rate increases by four.
The explanation is the changing distribution of students. A larger proportion of students are at higher-performing sites, contributing six positive percentage points to the overall rate and outweighing the decline within individual sites.
Instead of leaving users to interpret complicated statistical formulas, Metric Mirage reveals this through a visual investigation, clear comparisons, an explanatory breakdown, and a report-ready briefing.
Users can also upload their own CSV files to analyze grouped success rates across two periods. The analysis runs directly in their browser, without uploading their data to a server.
Importantly, Metric Mirage doesn't invent a contradiction to make the results dramatic. When the underlying groups improve, it says so. When the results are mixed or unchanged, it explains those patterns honestly.
The goal isn't to make every number look suspicious. It's to make every explanation more trustworthy.
How I built it
I developed Metric Mirage using Claude Code and the Devpost Learn Skill Pack, following a plan-first, specification-driven workflow.
Rather than jumping directly into implementation, I worked through the project's scope, product requirements document, technical specification, build checklist, and verification process.
Each stage helped translate an idea into something more concrete: what problem the application would solve, who would use it, what the experience should feel like, and how we could verify that its calculations were correct.
The application uses React, TypeScript, and Vite, with a deterministic mathematical engine that decomposes overall rate changes into within-group performance and changing-distribution effects.
I used Vitest for mathematical and component testing, Playwright for browser testing, and GitHub Actions and GitHub Pages for deployment.
For the interface, I chose an editorial visual style rather than a conventional business dashboard. I wanted the experience to feel like uncovering a story hidden inside the data, with typography, color, and visual hierarchy guiding the investigation.
Claude Code accelerated development, but the requirements, trade-offs, reviews, and acceptance decisions remained an active part of my involvement throughout the process.
Challenges I ran into
The hardest challenge wasn't building the charts. It was making the truth understandable without compromising mathematical accuracy.
One important issue involved numerical rounding.
An early proposal was to slightly adjust a displayed number so the equation would appear to balance. I rejected that approach because a tool designed to improve trust in numbers should never manipulate a value for visual convenience.
Instead, I established a rule: increase displayed precision when necessary, and explicitly indicate approximation if rounded values cannot reconcile. That decision became part of the technical specification and was protected by automated tests.
Another challenge was communication.
At one point, I looked at the application's explanation and realized that even I couldn't immediately understand it.
That was an important moment. If I struggled with the explanation after working on the project, how could I expect a first-time user to understand it?
So I revisited the experience, simplified the narrative into three clear steps, and separated the numerical effects from changes in individual group shares.
I learned that making something technically correct is only half the challenge. Making it genuinely understandable is the other half.
Accomplishments that I'm proud of
I'm proud that Metric Mirage became more than a static visualization or a demonstration of a statistical paradox.
It's a working, interactive application that lets users investigate their own data, understand the factors contributing to a headline change, and turn the findings into a usable briefing.
Its mathematical behavior is supported by extensive automated tests, including generated datasets, while browser tests cover the user journey, CSV validation, accessibility, and responsive layouts.
I'm especially proud of the decisions that prioritized correctness over convenience, and clarity over unnecessary complexity.
Every iteration pushed the project closer to its original purpose: helping someone understand what the data actually supports.
What I learned
This project changed how I think about building software with AI.
AI coding agents can generate working applications incredibly quickly. But speed alone doesn't guarantee understanding, accuracy, or a good user experience.
The Devpost Learn Skill Pack helped me see the value of defining the problem and documenting decisions before asking an agent to implement them.
I learned to challenge proposed solutions, review the application's behavior, test important assumptions, and turn lessons from failed explanations into better requirements.
Most importantly, I learned that working with AI doesn't mean giving up ownership of the work. It means becoming more intentional about the decisions that shape it.
What's next
Metric Mirage is currently a focused proof of concept, and there are several directions I'd like to explore.
Future improvements could include easier integration with existing reporting tools, support for additional data formats, and more flexible ways to investigate complex changes across groups.
But the central principle would remain the same: explain what the evidence supports without overstating what it proves.
Because a number can be correct and still leave us with the wrong impression.
Metric Mirage is my attempt to close that gap.
Before you report that number, look beneath the headline.
Built With
- claude-code
- devpost-learn-skill-pack
- github
- papaparse
- playwright
- react
- typescript
- vite
- vitest

Log in or sign up for Devpost to join the conversation.