-
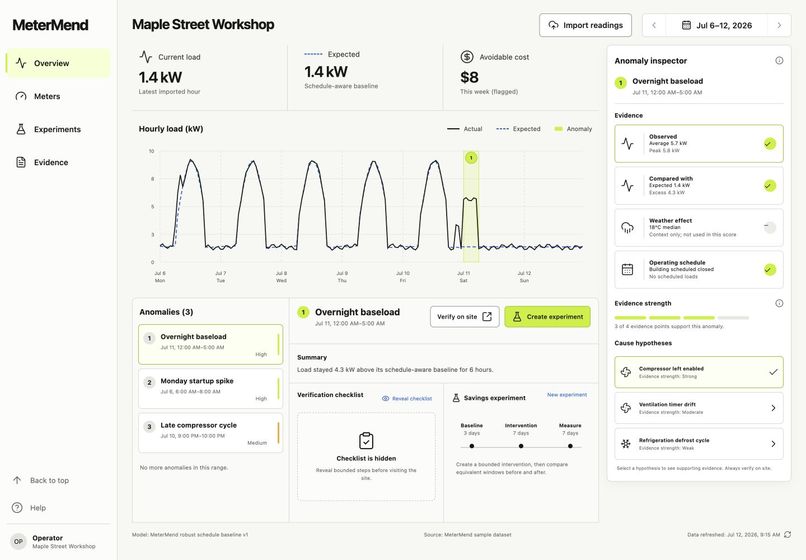
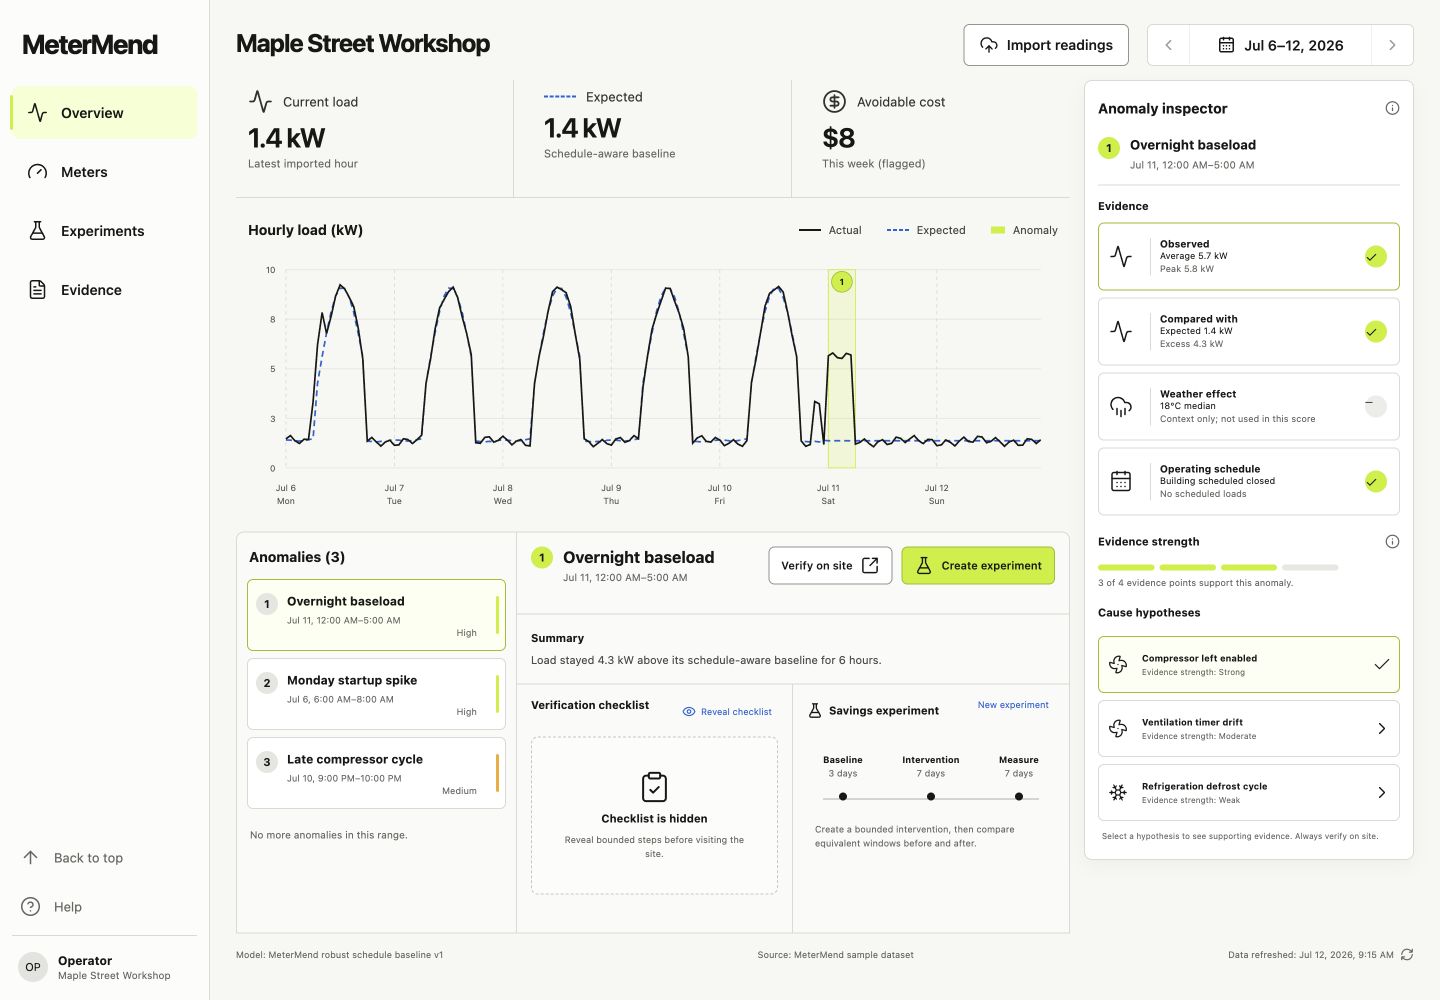
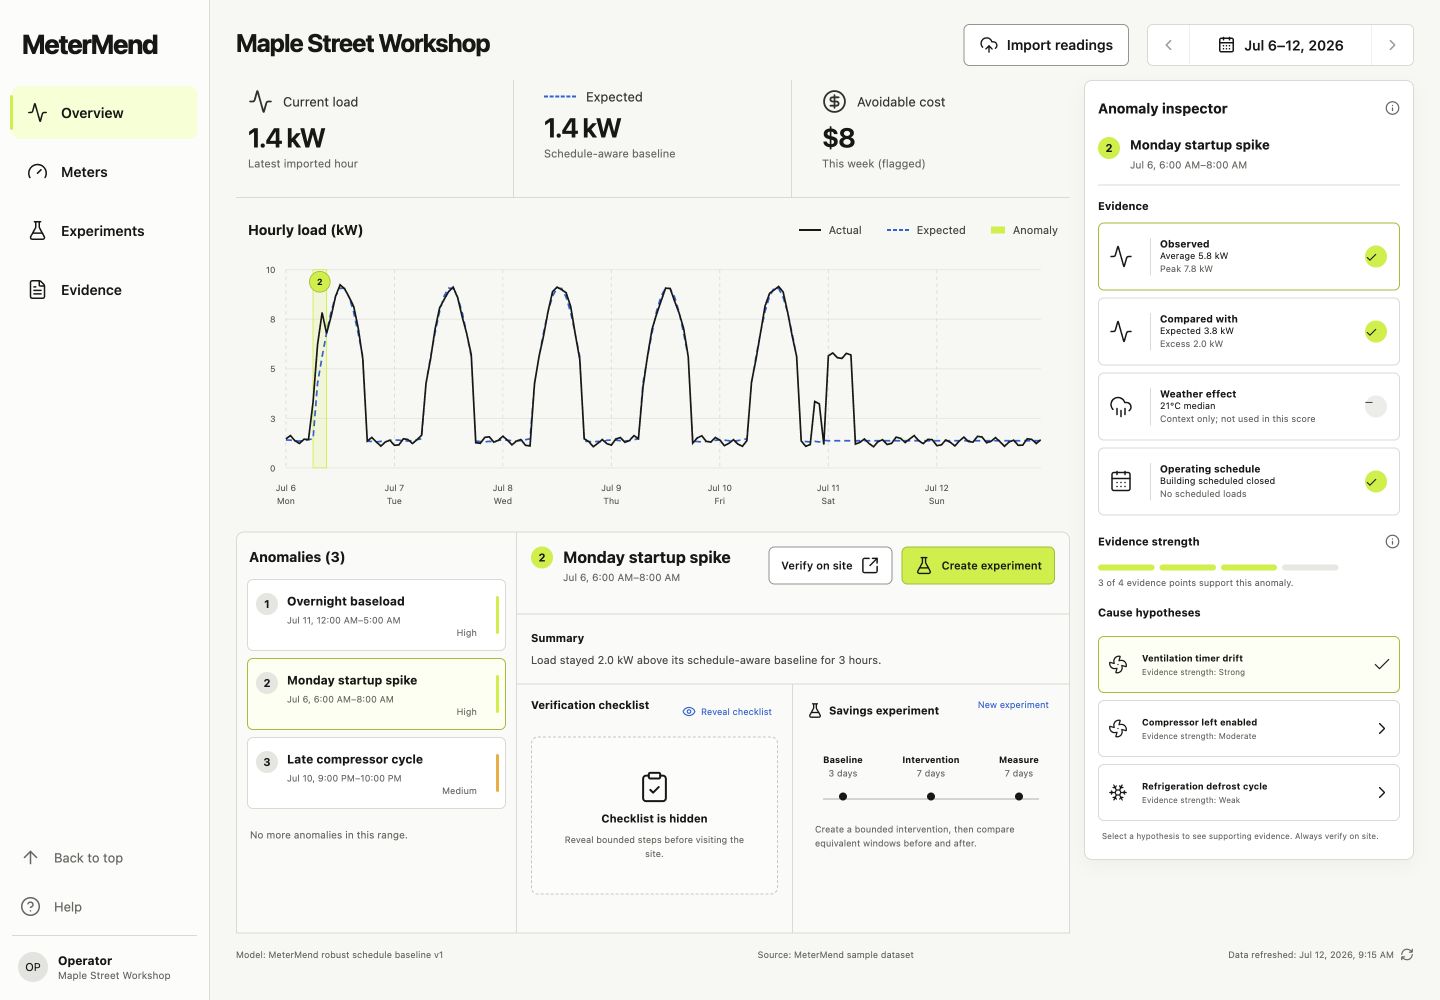
Overview: real 168-hour sample with schedule-aware baseline, three sustained anomalies, and evidence inspector.
-
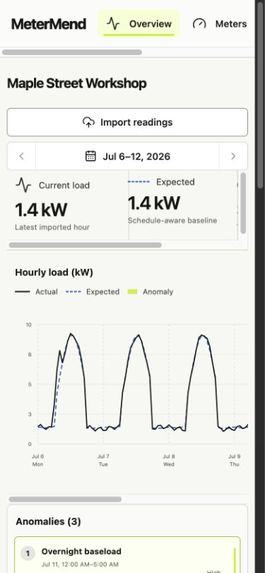
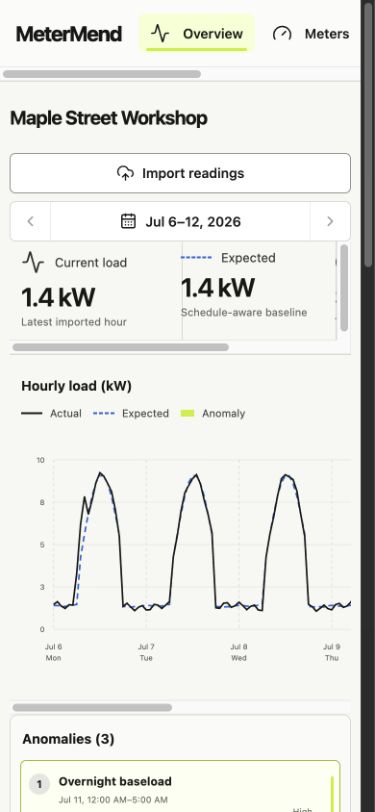
Responsive mobile view at 375 CSS px with no page-level horizontal overflow.
-
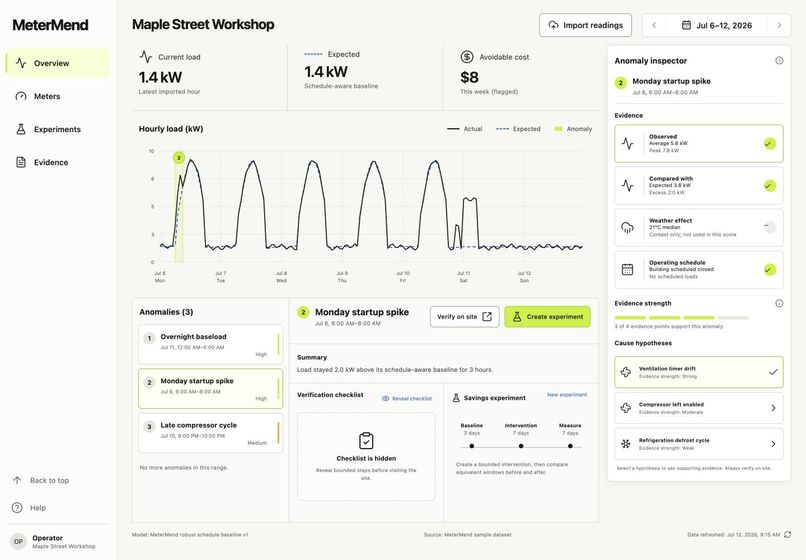
Selected anomaly: Monday startup spike with observed versus expected load and ranked cause evidence.
-
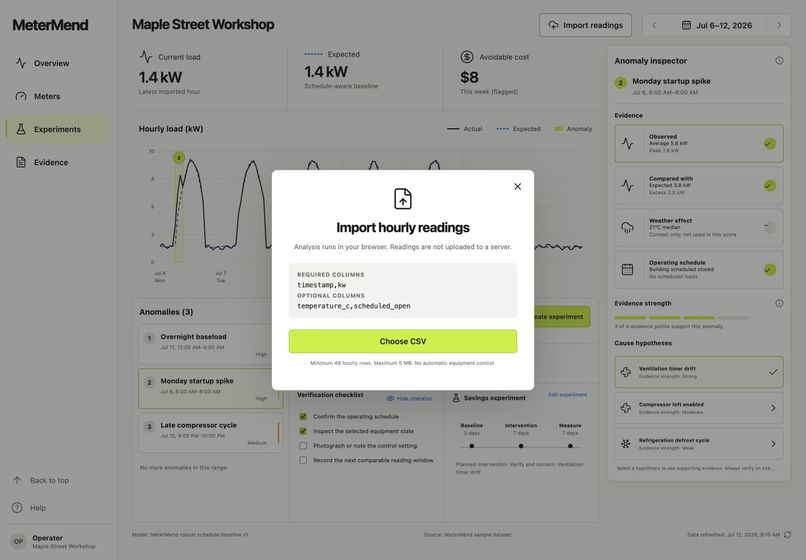
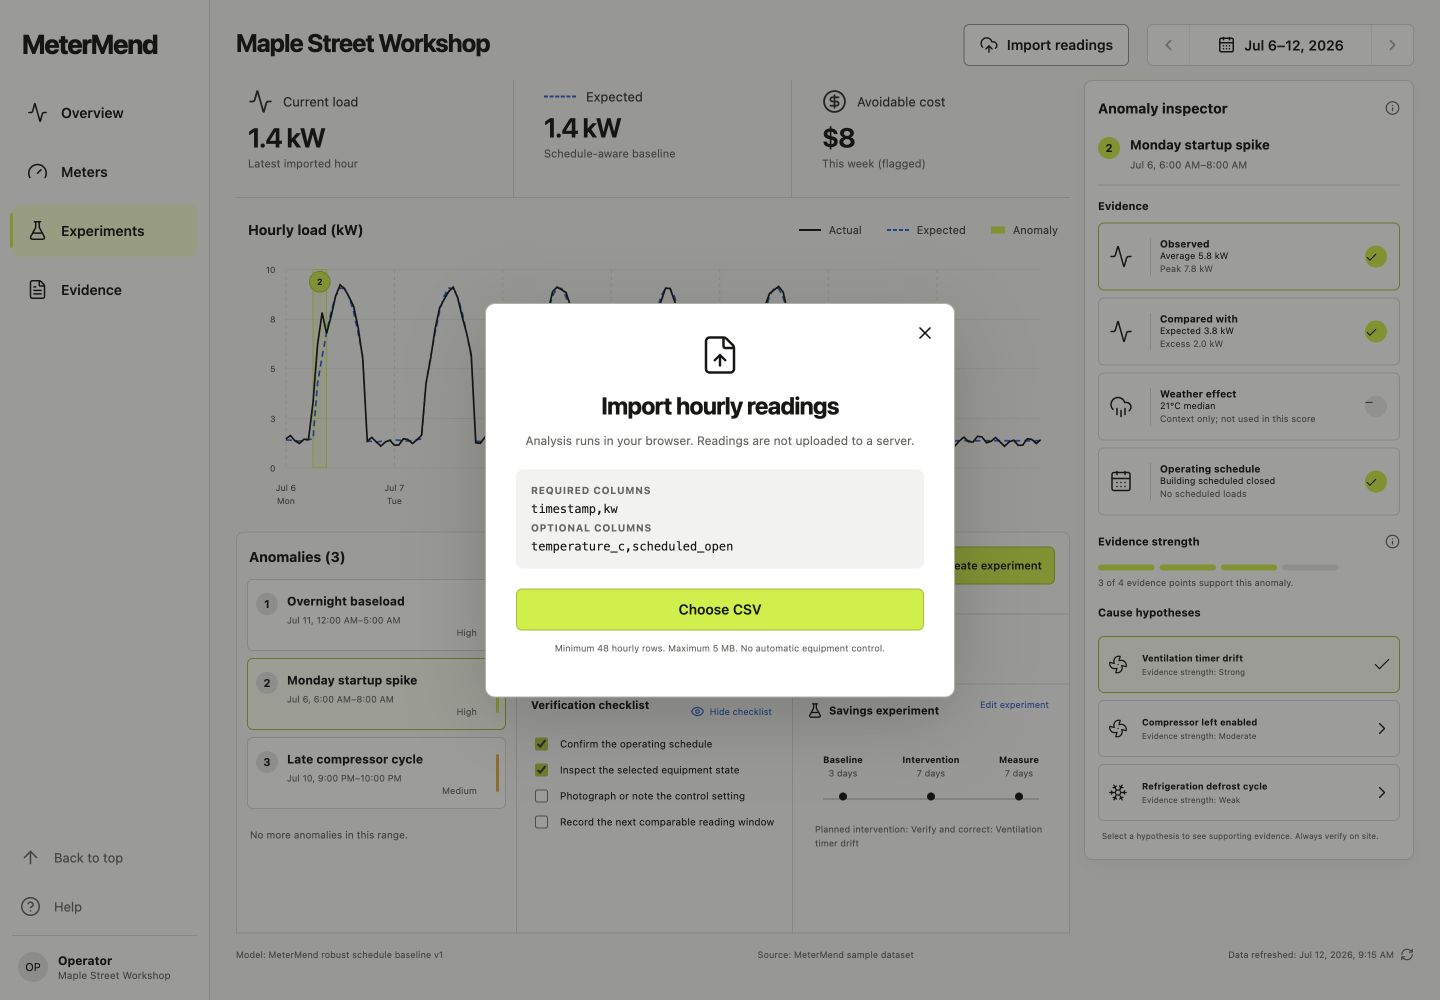
Local-first CSV import: schema, privacy boundary, file limit, and no automatic equipment control.
-
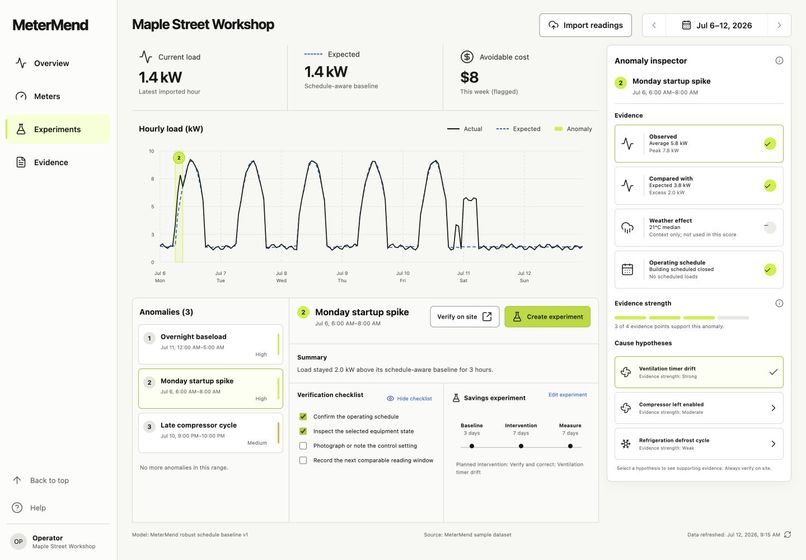
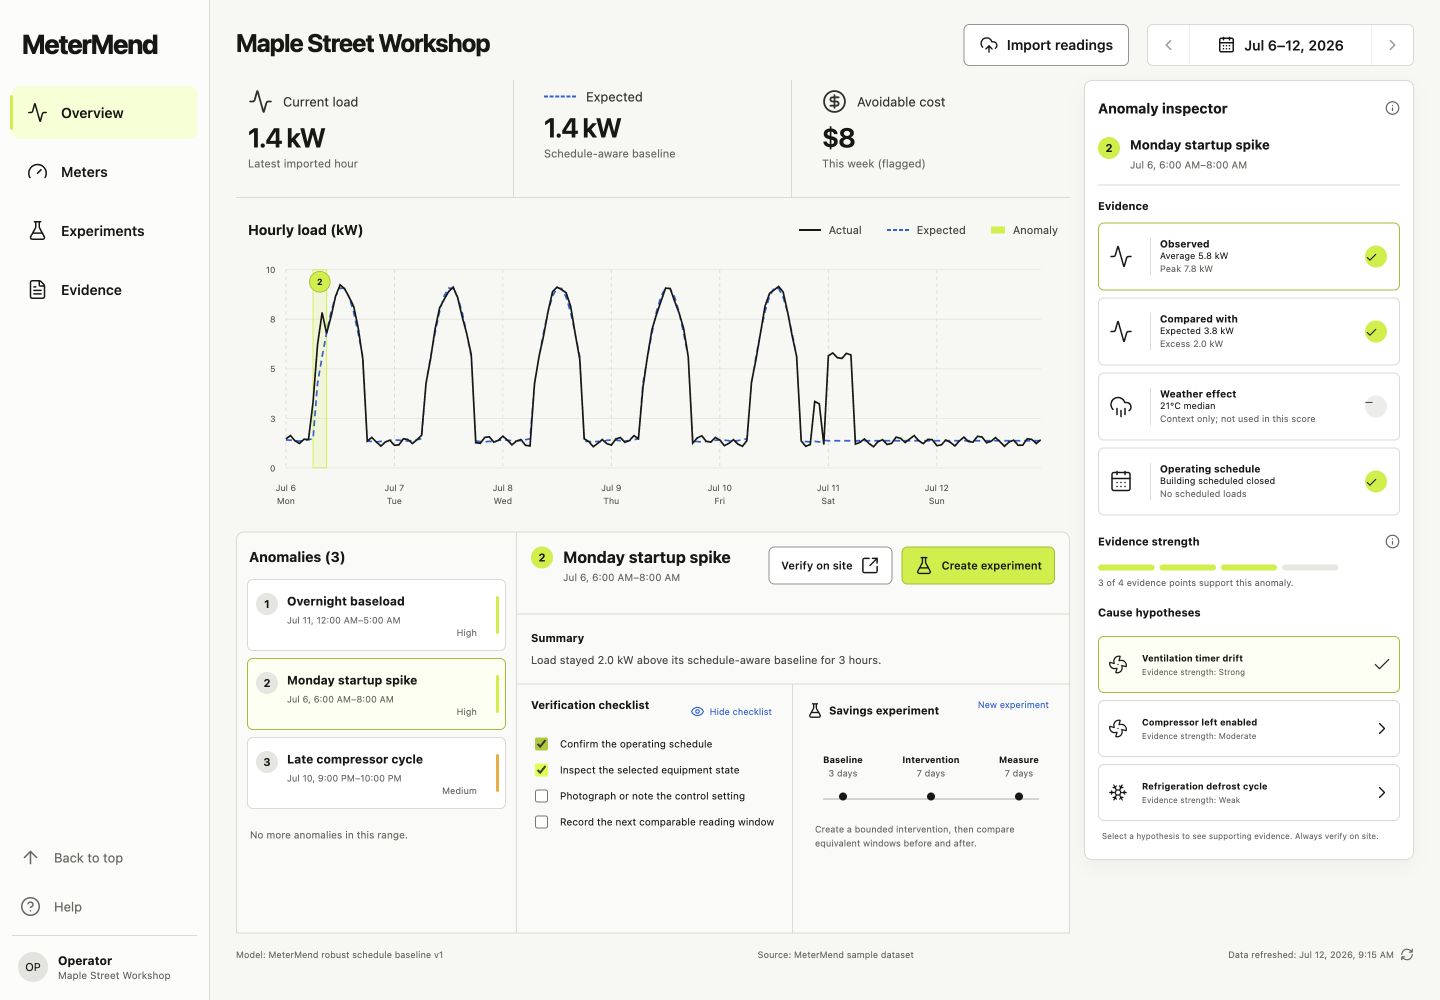
Savings experiment: the strongest hypothesis becomes a measured baseline, intervention, and follow-up plan.
-
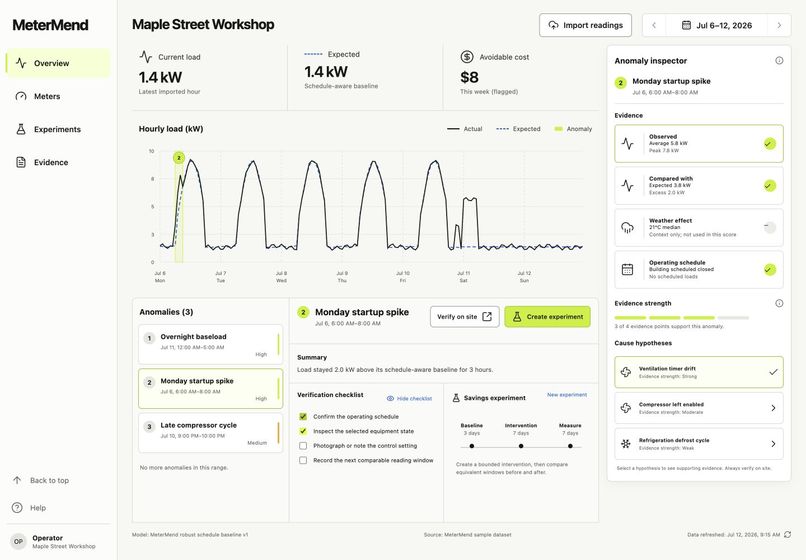
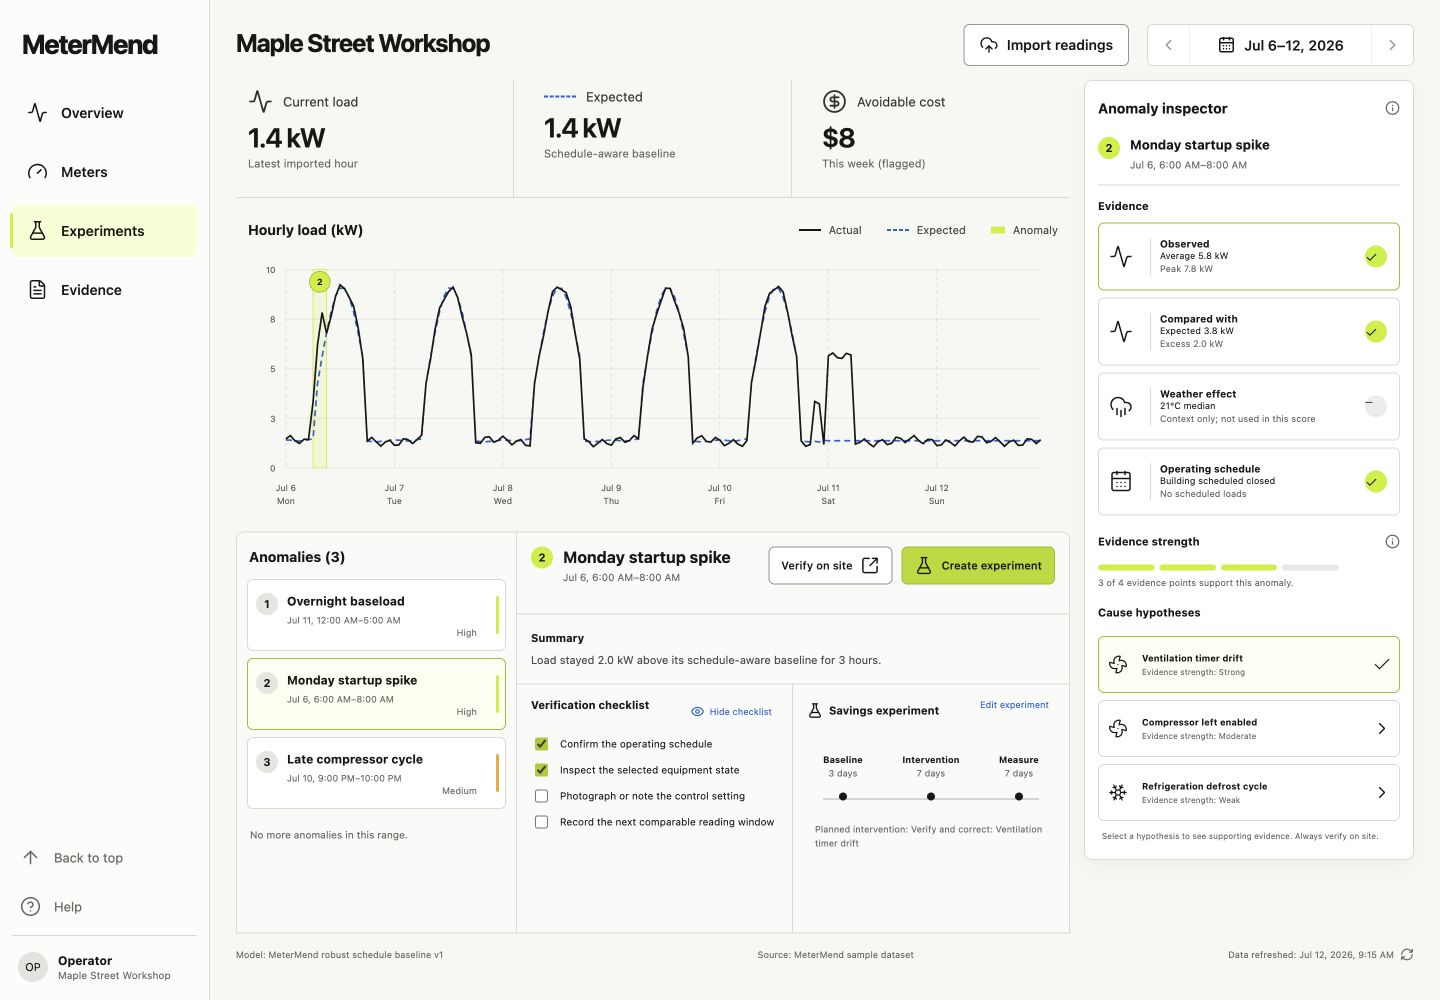
Human verification: bounded on-site checklist with progress captured before any intervention.
Inspiration
Small workshops, cafés, shops, and offices often receive energy dashboards that say how much electricity they used, but not which operating behavior is worth checking. Generic alerts can feel like black boxes, while a consultant is often too expensive for a single small site. I wanted a tool that makes a narrow, testable claim and shows its evidence.
What it does
MeterMend turns hourly meter readings into a short queue of sustained positive load anomalies. For each event it shows:
- the observed load and schedule-aware expected load;
- the duration and estimated avoidable energy cost;
- operating-schedule and weather context;
- bounded cause hypotheses ranked by evidence strength;
- an on-site verification checklist; and
- a baseline/intervention/measurement savings experiment.
It never controls equipment and never presents a cause as certain. The final decision stays with the operator.
How I built it
The application is a static React 19 and TypeScript web app. The analysis runs fully in the browser:
- validate and sort ISO-8601 hourly readings;
- build peer buckets by local day type, schedule state, and hour;
- calculate an inspectable median baseline;
- normalize positive deviations using median absolute deviation (MAD);
- group adjacent high-scoring readings into sustained events; and
- derive evidence cards and bounded equipment hypotheses.
The demo includes a deterministic 168-hour dataset with three seeded operating patterns, but the CSV import executes the same real analysis path on user data. There is no backend, account system, analytics tag, or hidden model service.
Challenges
The hardest part was avoiding a confident-looking but misleading score. I kept weather as visible context rather than claiming weather adjustment, required at least two adjacent candidate hours, and exposed every threshold in the public source. I also found and fixed a time-zone inconsistency that could have placed schedule buckets in the browser's system time instead of the building's stated time zone.
Accomplishments that I'm proud of
- A complete evidence-to-experiment workflow, not just a chart.
- Real local CSV analysis with quoted-field, type, size, row-count, and duplicate timestamp validation.
- Six deterministic analysis tests and a reproducible production build.
- No third-party runtime request and no upload of meter readings.
- Responsive 375 px and 1440 px layouts with no page-level horizontal overflow.
- A restrictive production CSP and security headers for static hosting.
What I learned
Explainability is most useful when it changes the next action. Showing a baseline is not enough; the operator needs to see why an event is unusual, what remains uncertain, and how to measure whether an intervention worked. I also learned that time-zone handling is part of model correctness, not a presentation detail.
What's next
Next I would make the building time zone and tariff configurable, add interval quality diagnostics, and validate hypotheses against real sub-meter/runtime logs. I would keep equipment control out of scope until the diagnostic workflow has been independently evaluated on diverse buildings.
Team
Solo project by Kwon Jun: product design, analysis model, frontend implementation, tests, security hardening, documentation, and submission assets.

Log in or sign up for Devpost to join the conversation.