-
-
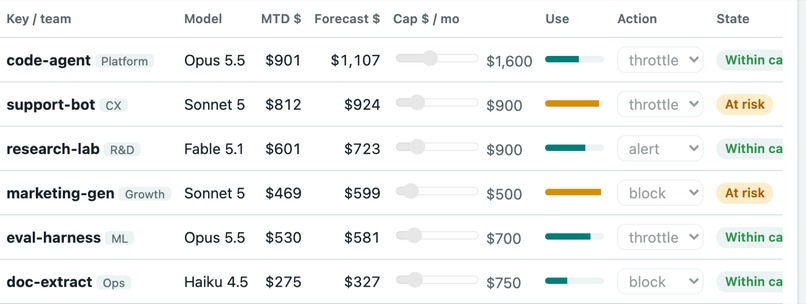
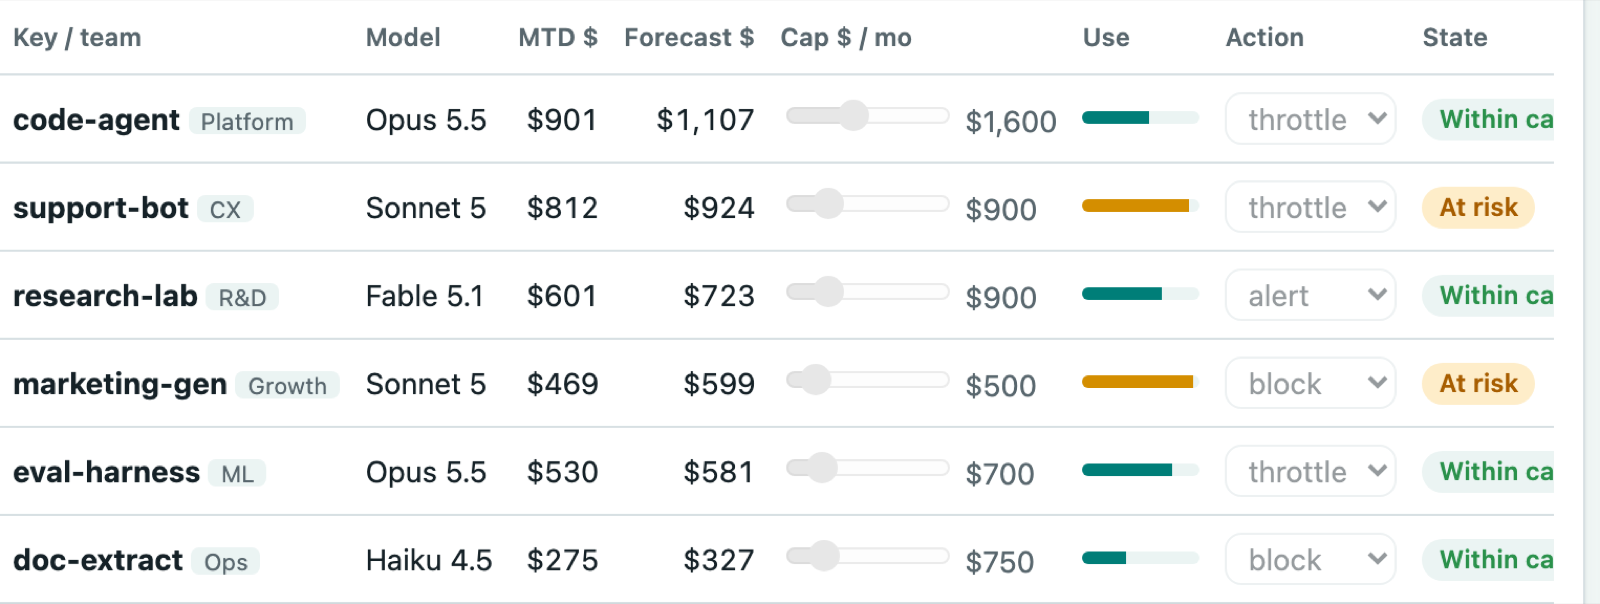
Key table while acting as Auditor: read-only, policy controls locked (RBAC)
-
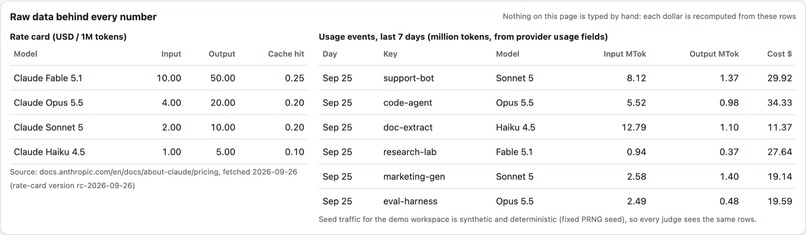
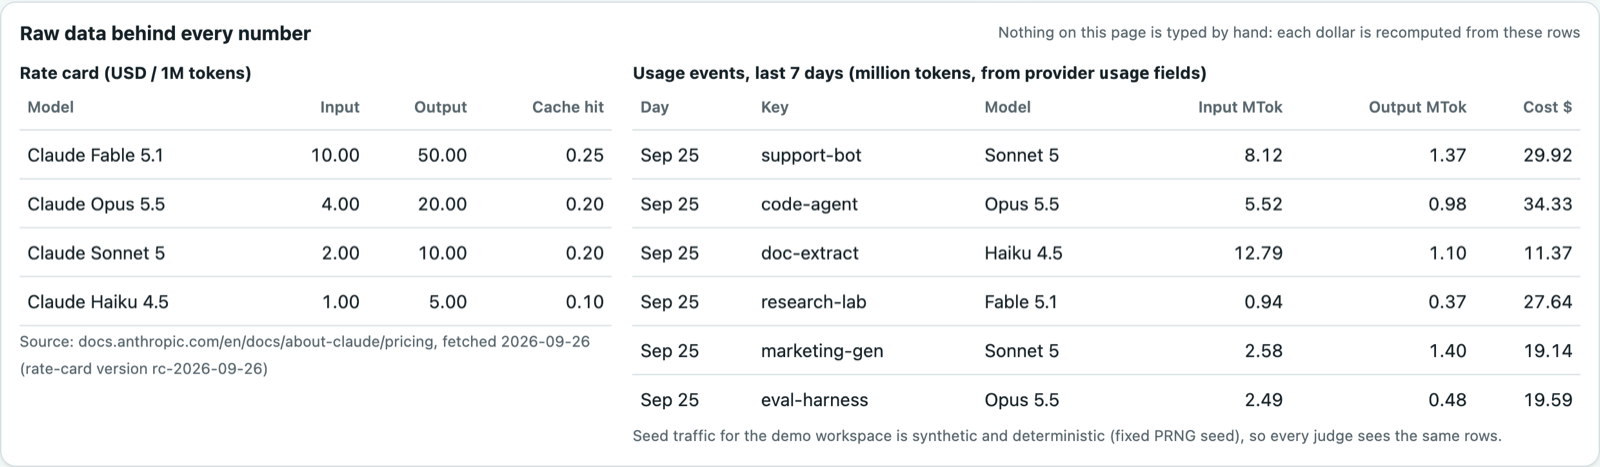
Raw data behind every number: rate card with source and version, and raw usage events
-
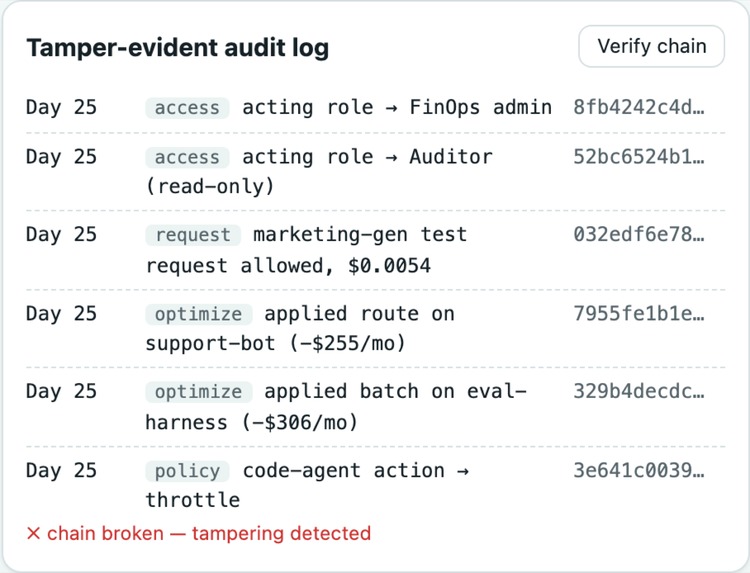
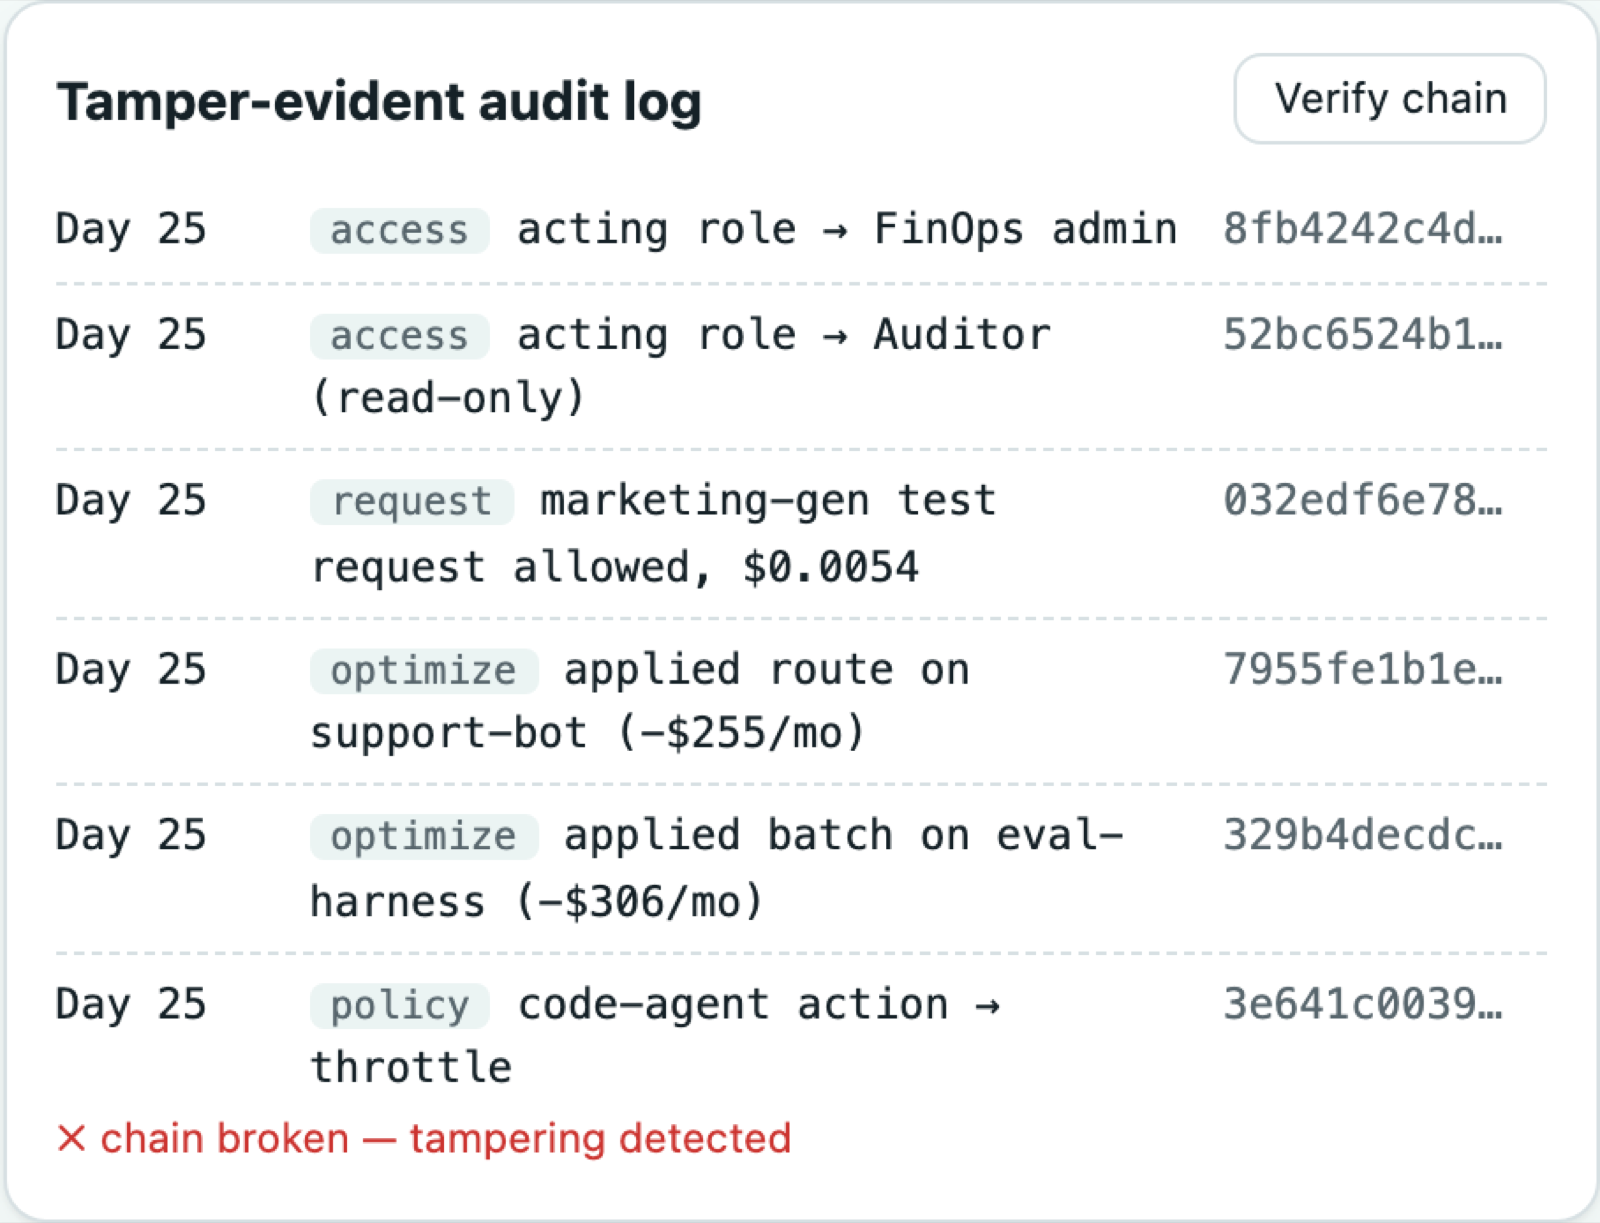
Tamper test: editing one audit event breaks the hash chain and the verifier names the first broken link
-
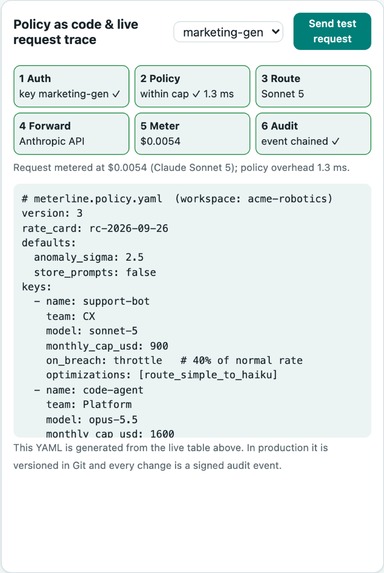
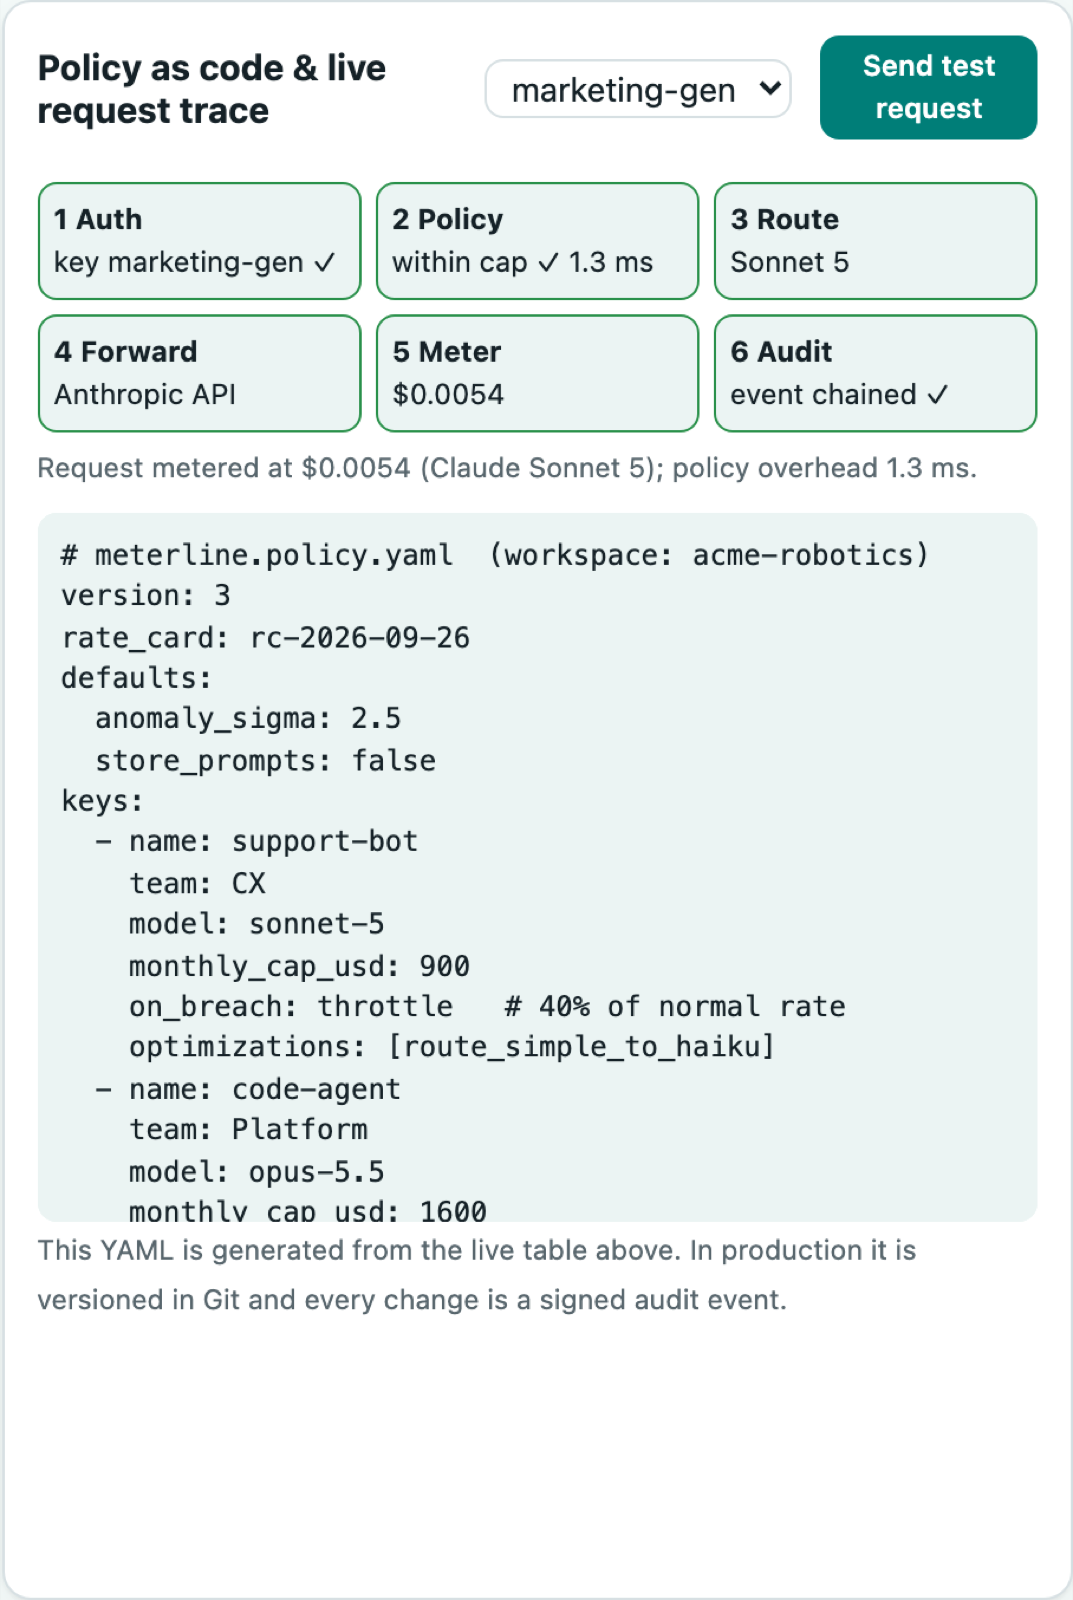
Policy as code and live request trace: how a request is priced, checked against its key cap and routed
-
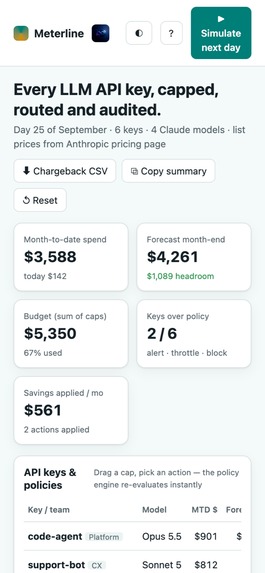
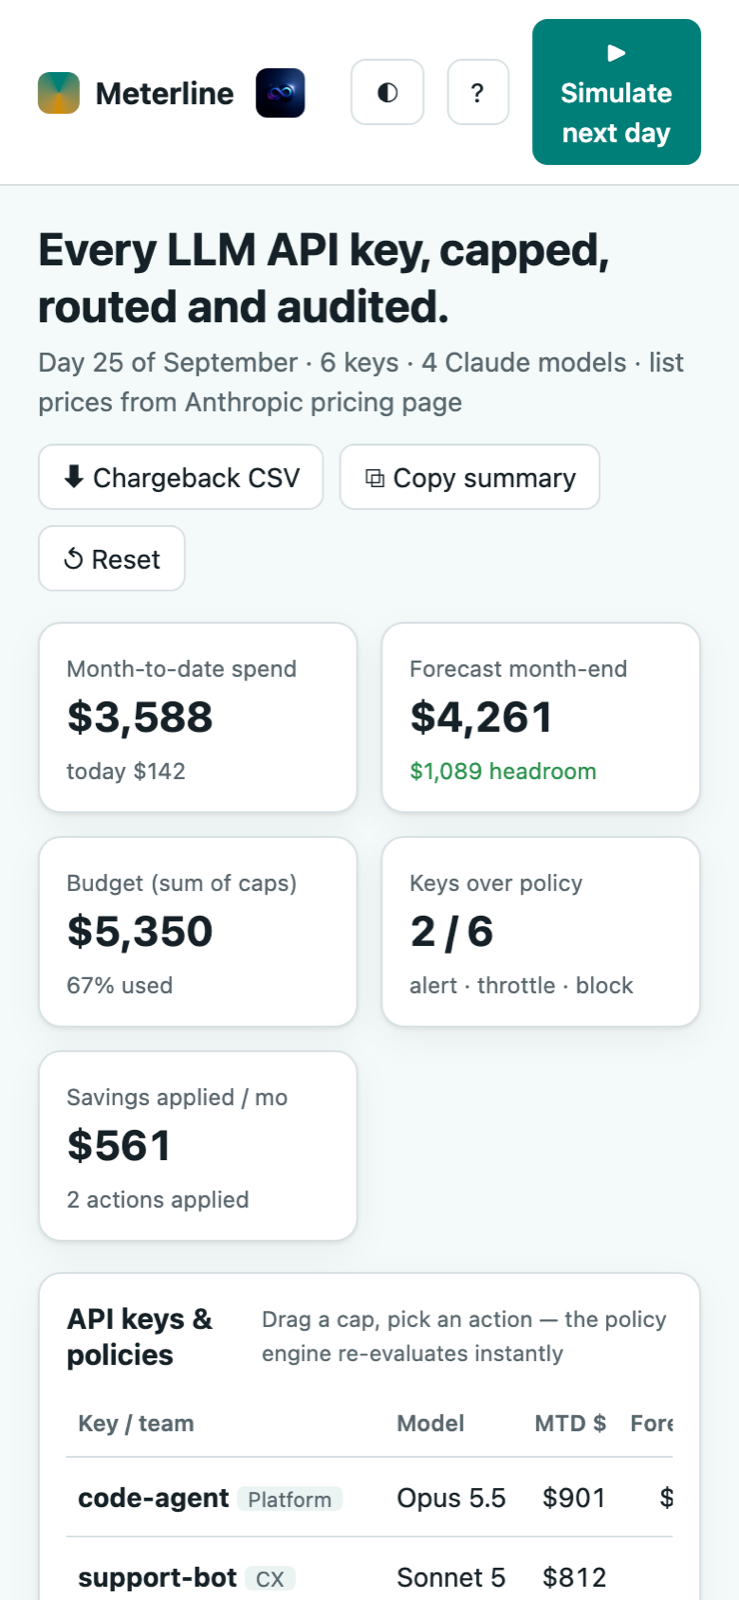
Mobile layout: the same console on a phone
-
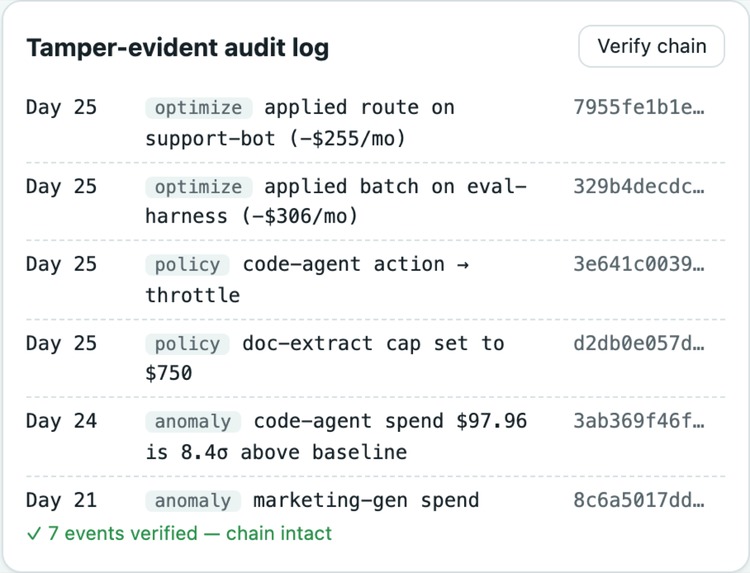
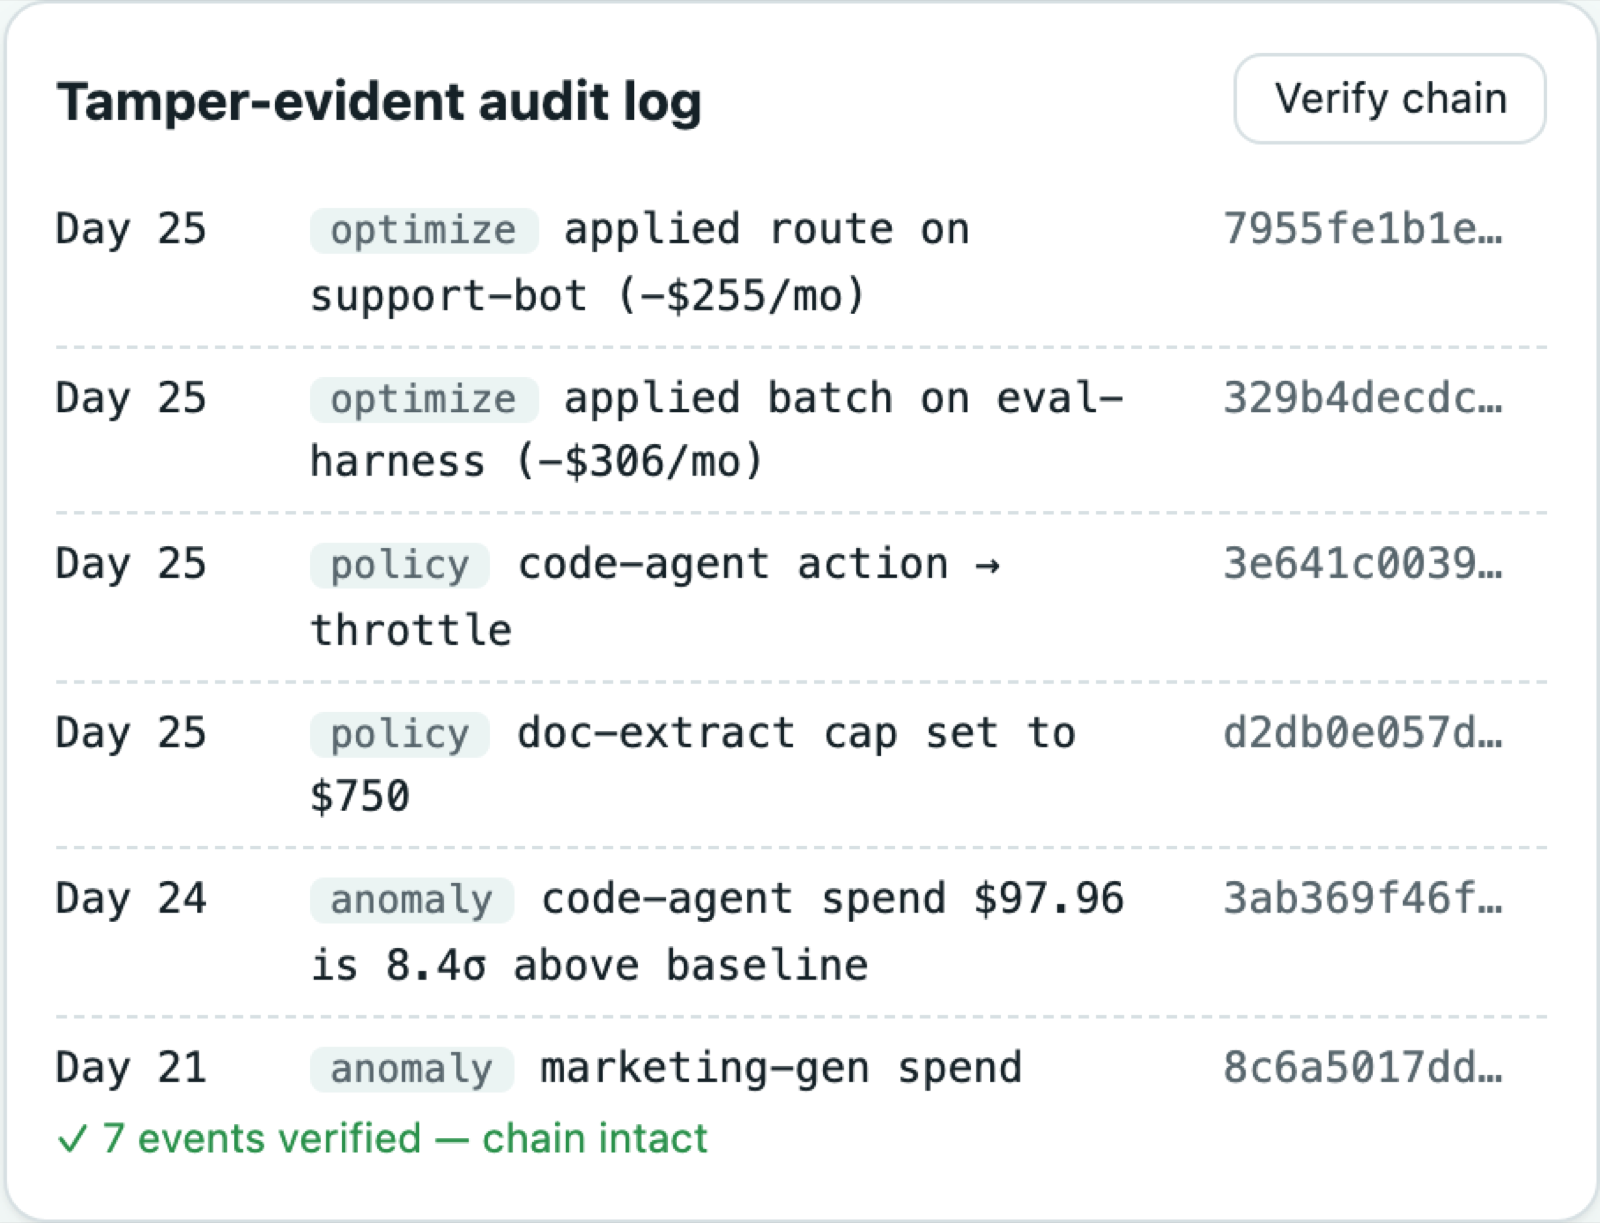
Hash-chained, append-only audit log with the verifier
-
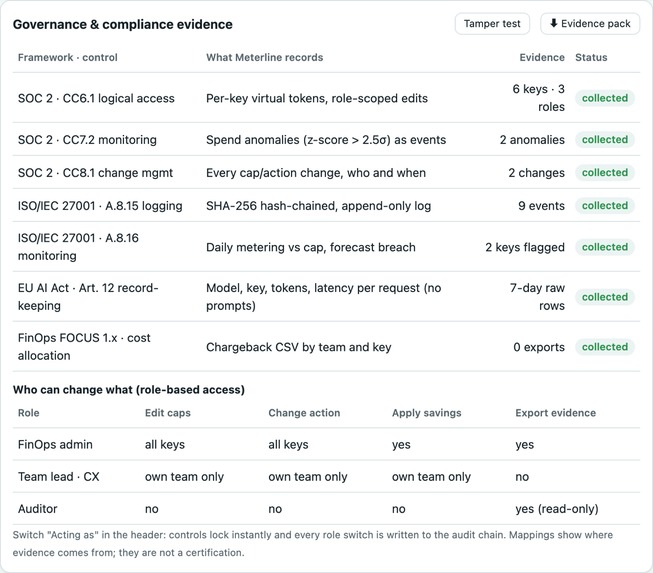
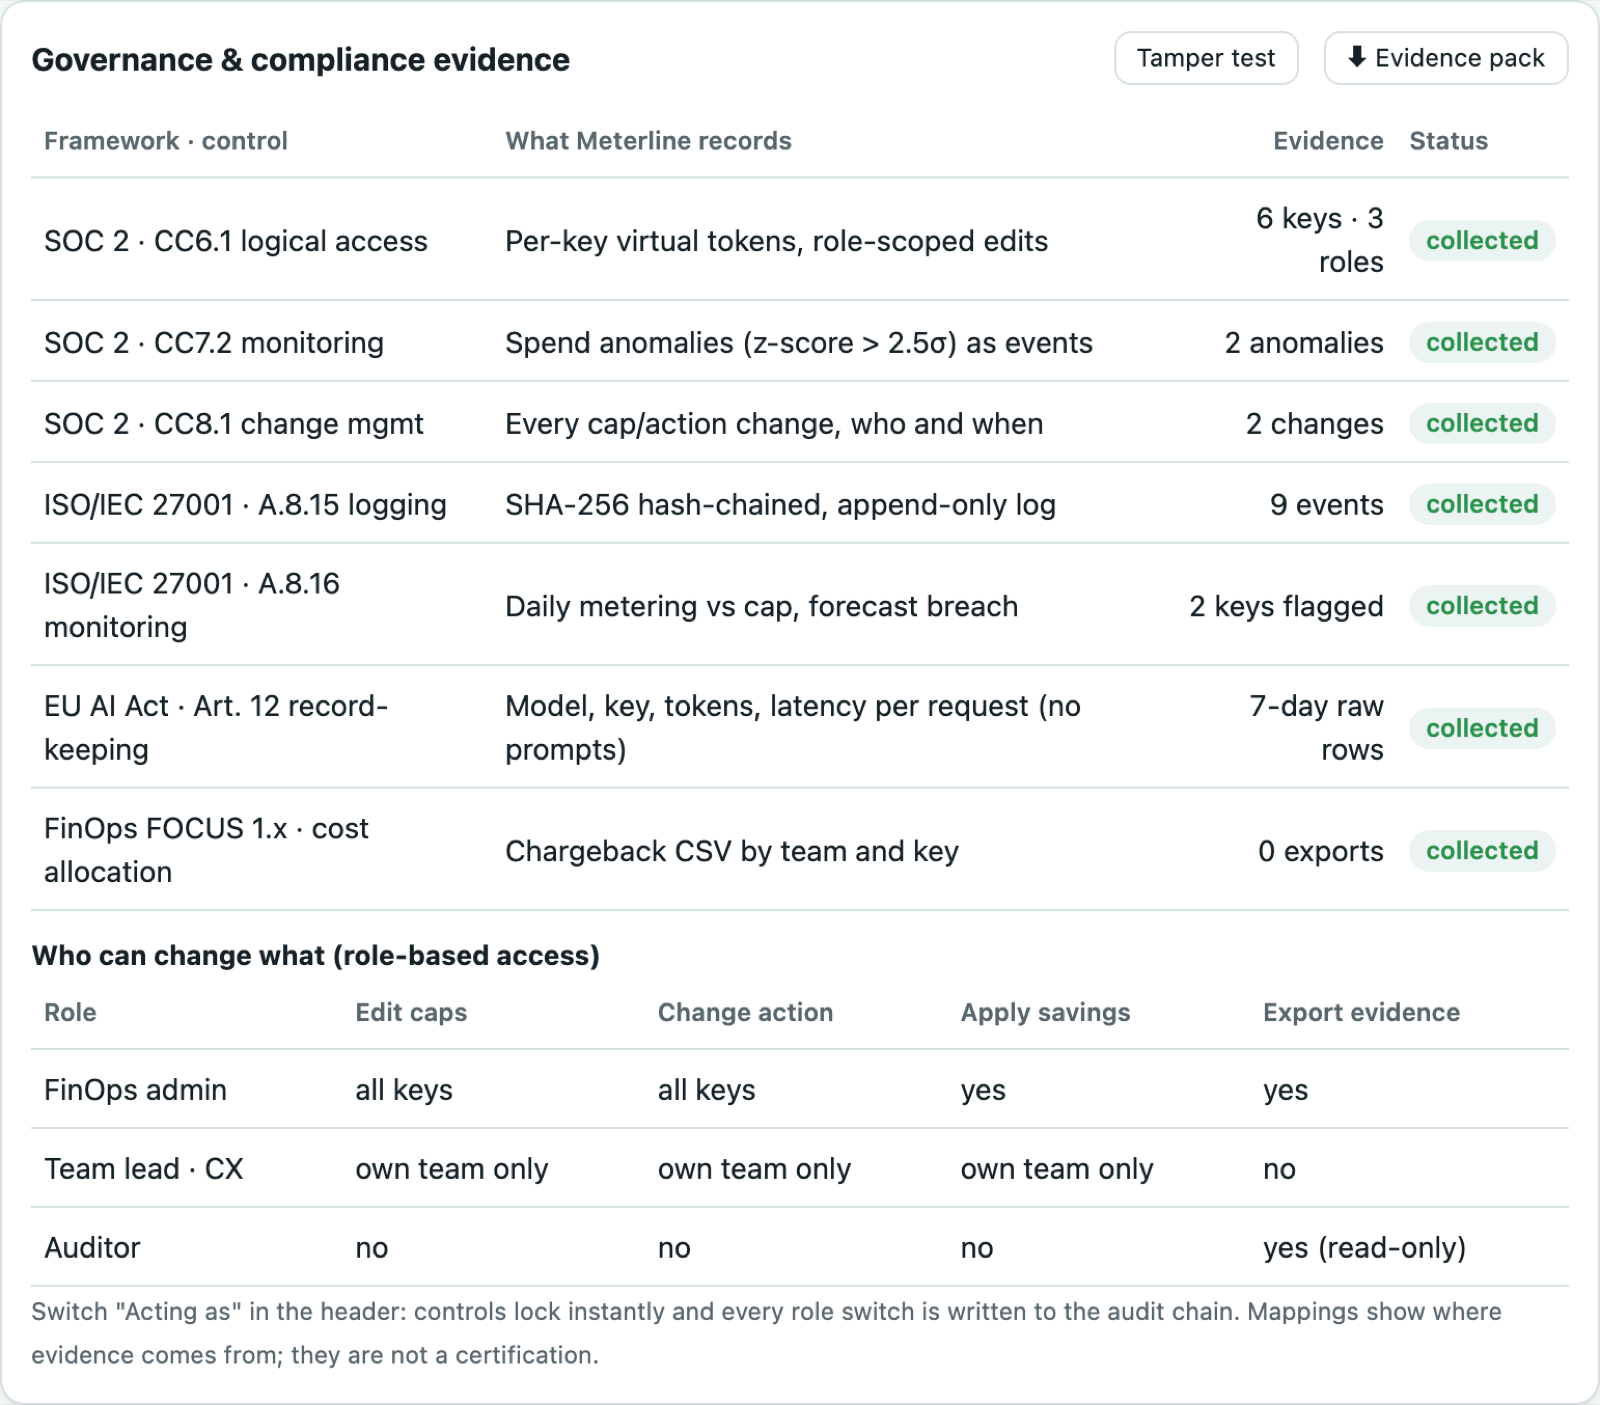
Governance and compliance evidence panel: RBAC, retention, SOC 2 / ISO 27001 / EU AI Act Art. 12 mapping
-
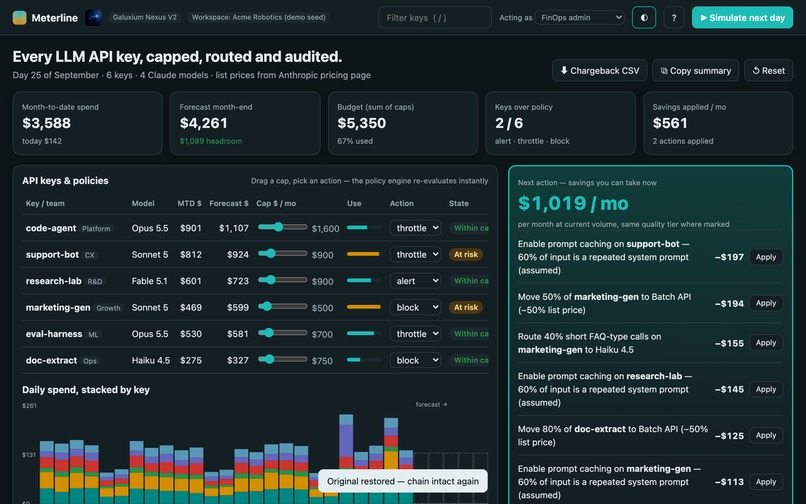
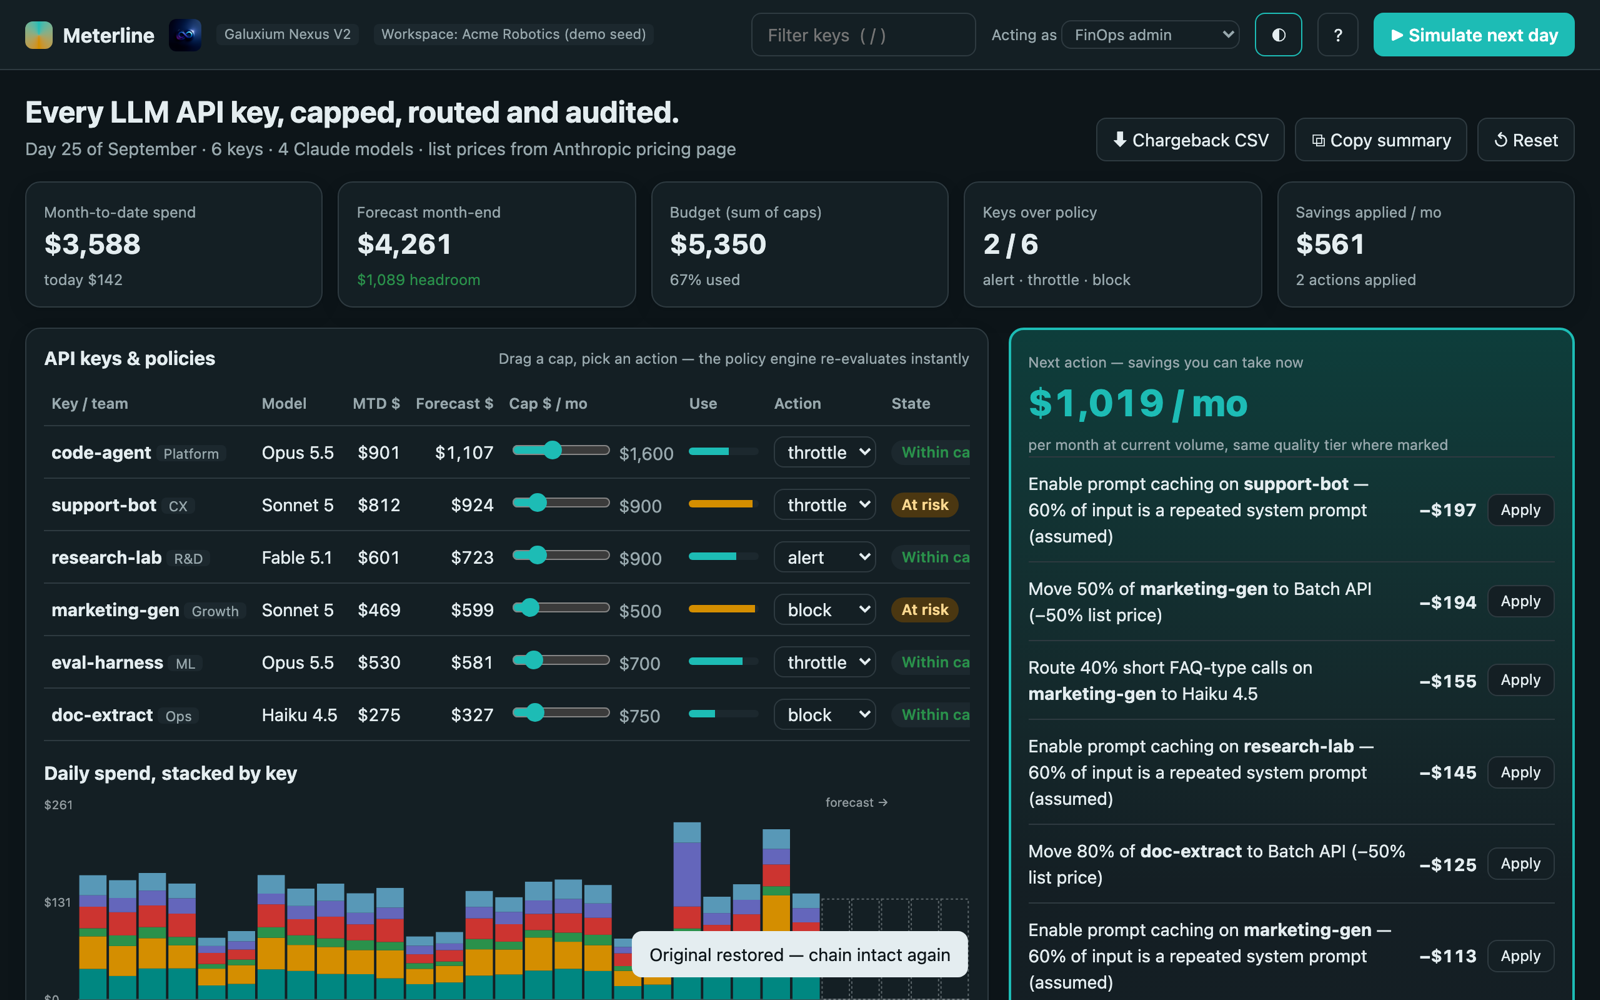
Dark mode of the dashboard
-
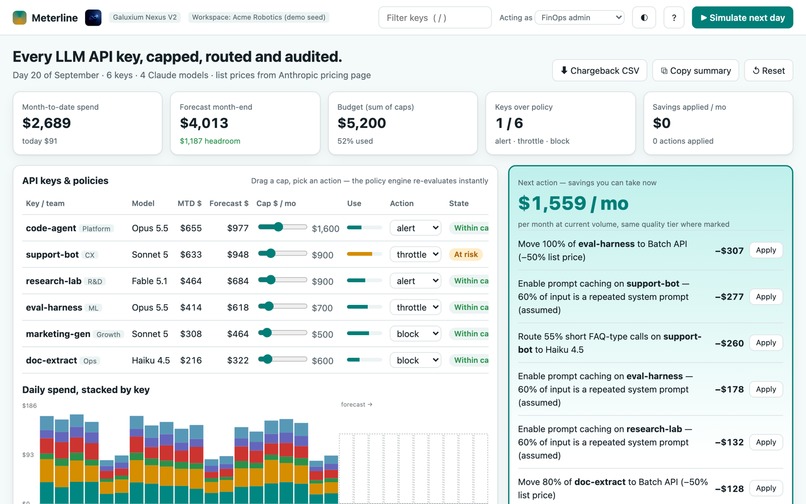
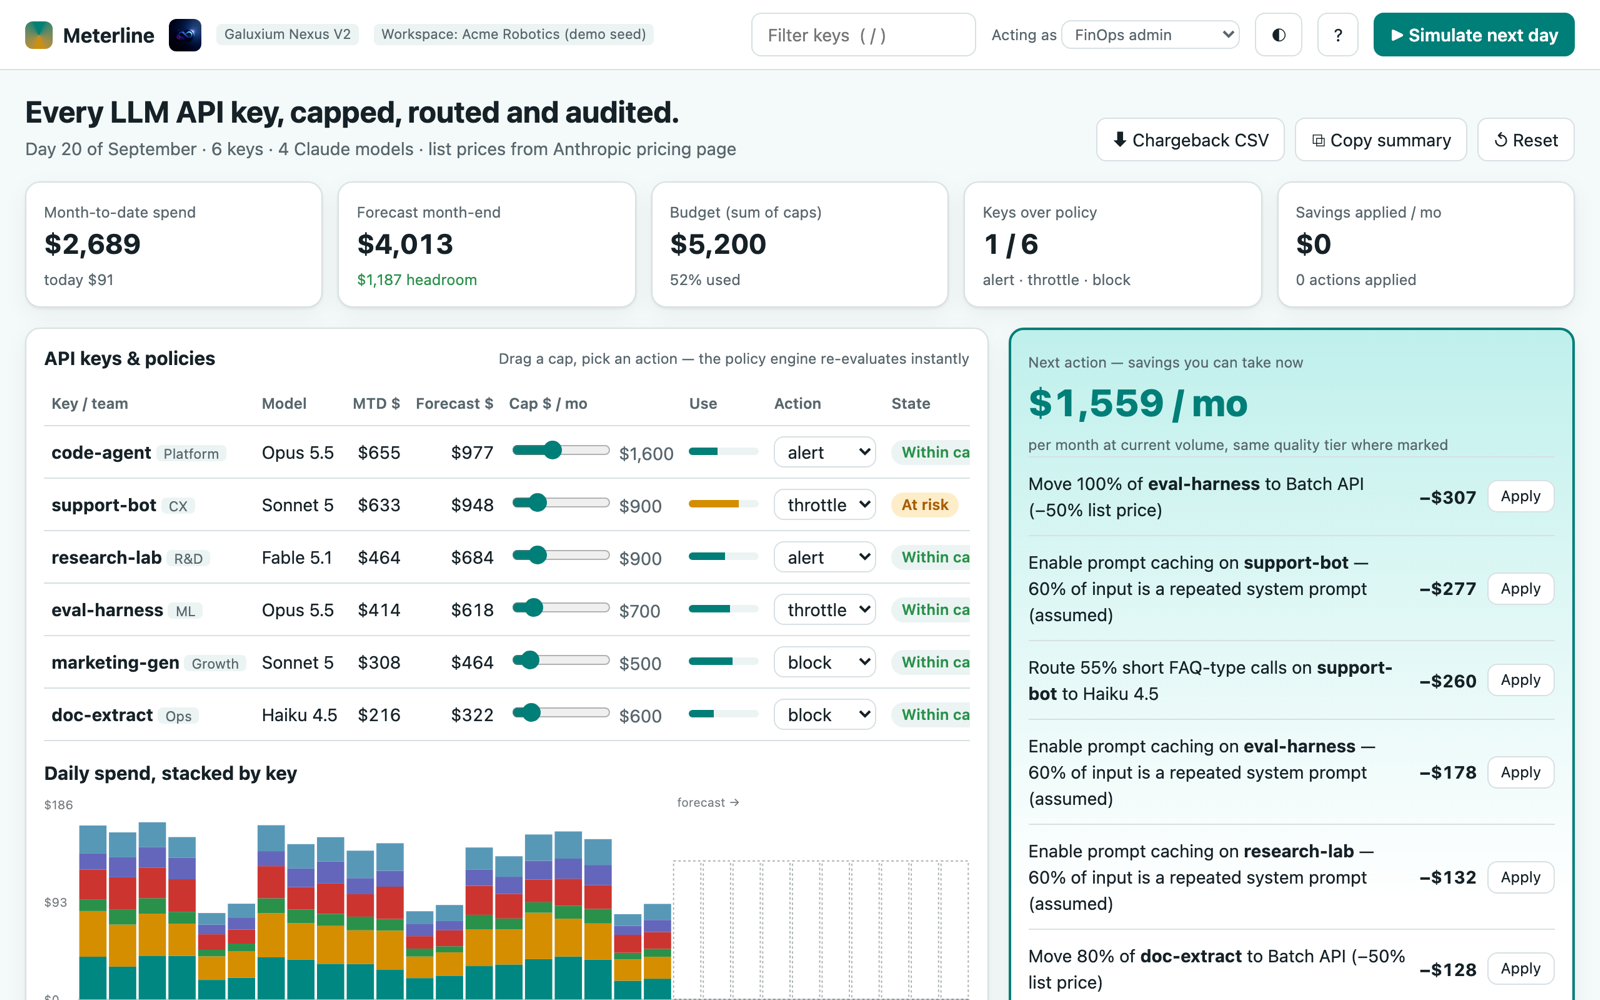
Dashboard on first load: KPI row, per-key table with caps and throttle state, and the nine priced recommendations
-
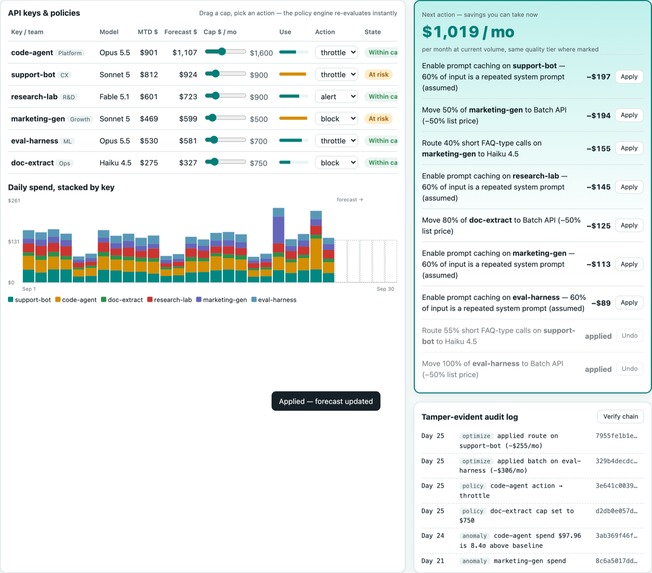
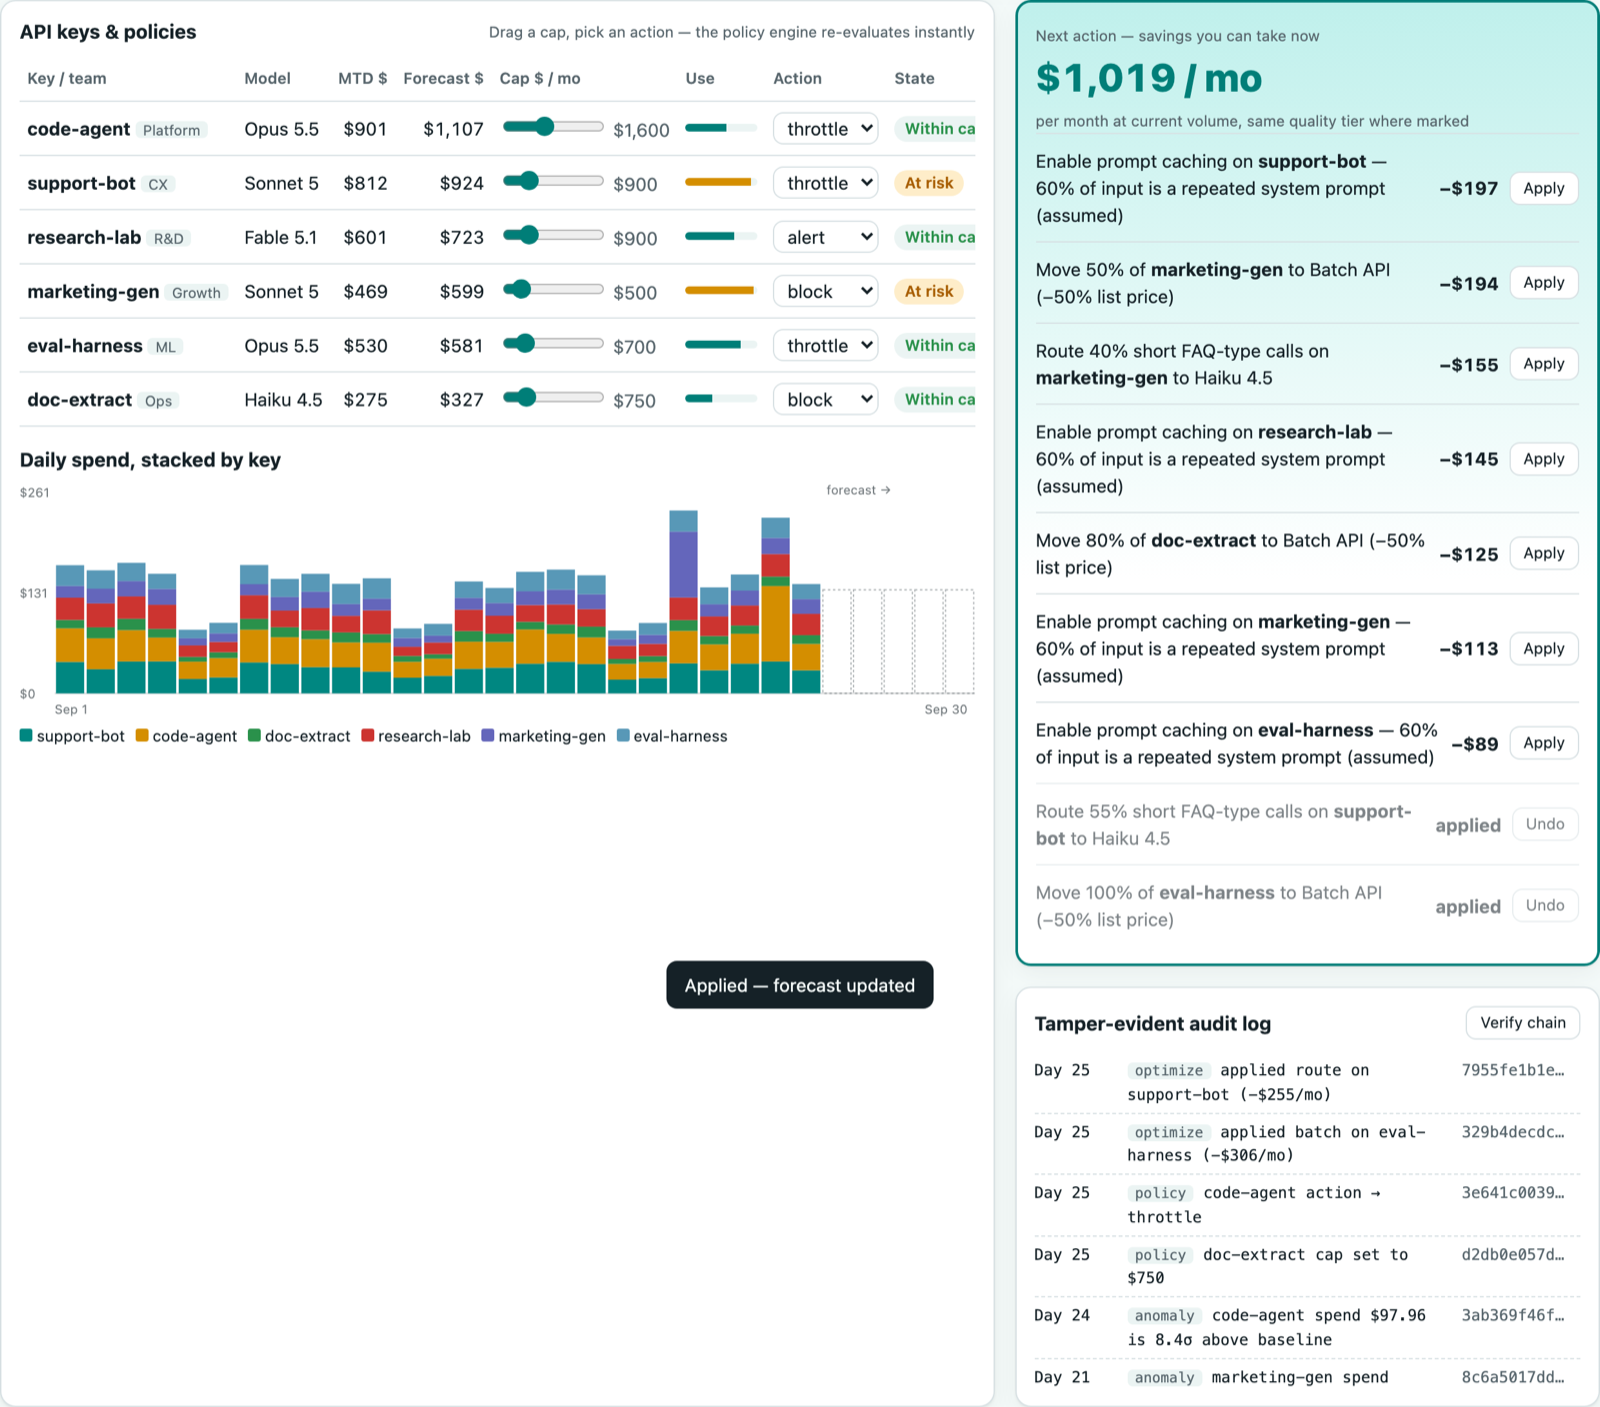
After simulating days of traffic and applying a recommendation: forecast drops and the remaining savings are recomputed
Meterline
Cap, route and audit every LLM API key your company pays for.
Galuxium Nexus V2 · Devpost project story and business & technical anatomy · Solo entry by Cheolhee Lee (Polaapp, Daejeon, Republic of Korea) · Version 2026-09-29
| Item required by the hackathon | Where to find it |
|---|---|
| Live, hosted SaaS demo | https://iamhuman-cheolheelee.github.io/meterline/ (GitHub Pages, public cloud CDN; no sign-up, opens on a seeded workspace). Mirror: https://link.chlee.dev/gvwvsbmd/meterline-demo.html |
| Demo video (2:33; the rules require 2–5 min) | https://link.chlee.dev/8n9y4fhq/meterline-demo-video.mp4 · YouTube: https://youtu.be/lcfwkgo3M6E |
| Public GitHub repository | https://github.com/iamhuman-cheolheelee/meterline (MIT; README with architecture, stack, database schema and local run steps; full DDL in docs/schema.sql) |
| Business & technical anatomy | Sections 1–6 and Appendix A–B of this document |
| Monetization blueprint | Section 7 and Appendix C |
One line. Instead of reading the LLM bill after the month closes, Meterline enforces a budget on every API key while the requests are still flowing, and shows the dollar value of the next fix.
\$1,559 / mocandidate savings surfaced in the seeded workspace, 39% of its \$4,013 month forecast
10×output price gap between the most and least expensive model on one public rate card
40%traffic kept alive by a throttled key, versus 0% under a provider-wide hard cap
22× ROIsavings versus Team plan fee at \$80k governed spend [Assumption: 22% savings rate]
Contents
- The problem, in numbers
- Who buys, who uses, why now
- The product: what a judge sees in 60 seconds
- Architecture and scalability
- Enterprise governance and compliance
- Measured and projected impact
- Monetization blueprint
- Go-to-market, roadmap and risks
- How we meet each judging criterion
- Team, originality and declaration
- Appendix A–E: data model, API, plan pricing, sources, figure list
1. The problem, in numbers
Generative AI moved from pilot to production within 24 months, and the invoice moved with it. The FinOps Foundation's State of FinOps survey reports that 98% of respondents now manage AI spend, up from 31% two years earlier. Most of that spend is not cloud compute that a FinOps suite already sees. It is a per-token API bill from one or more model providers, billed to one organisation account, and shared by several teams that never see each other's usage.
In the companies we talked to while building Meterline, three blunt tools carry the whole load:
- Provider dashboards. There is one per vendor, aggregated per organisation or project and refreshed with a delay. They answer "how much did we spend", not "which key, which team, and what should we change today".
- Hard organisation limits. A single kill switch. When the cap trips, the customer-facing support bot dies together with the overnight evaluation job that caused the spike.
- Spreadsheets for chargeback. Finance re-keys usage exports every month to split the bill across teams, usually two to three weeks after the money is gone.
The price spread between models turns this into a large, recoverable cost. On Anthropic's public list (fetched 2026-09-26) the output price ranges from \$5 to \$50 per million tokens, a 10× gap. A cache hit costs 10% of a normal input token, and the Batch API halves list price for work that can wait. Each of these levers is well documented. What teams lack is the per-key view that says which lever is worth pulling on which key, and what it is worth in dollars this month.
| Model (Anthropic list, USD per 1M tokens) | Input | Output | Cache hit | Output vs Haiku |
|---|---|---|---|---|
| Claude Fable 5.1 | 10.00 | 50.00 | 0.25 | 10.0× |
| Claude Opus 5.5 | 4.00 | 20.00 | 0.20 | 4.0× |
| Claude Sonnet 5 | 2.00 | 10.00 | 0.20 | 2.0× |
| Claude Haiku 4.5 | 1.00 | 5.00 | 0.10 | 1.0× |
What the gap costs a typical team
Take a support bot that sends 9.5 million input tokens and 1.6 million output tokens a day to Sonnet 5, which is the first key in our seeded workspace. That is about \$35 a day, or roughly \$1,050 a month. If 60% of the input is a repeated system prompt, caching it removes about \$277 a month. If 55% of the calls are short FAQ-type questions that Haiku answers equally well, routing them removes another \$260. Neither change touches product code beyond a header or a model name. Both are invisible in a provider console that shows one organisation-wide number.
Why existing tools do not close the gap
| Option teams use today | What it does well | What it misses |
|---|---|---|
| Provider consoles | Accurate usage for one vendor; organisation or project limits | One vendor at a time; limits are a hard stop for the whole project, not a graceful action per team key |
| Cloud FinOps suites | Chargeback and forecasting for cloud compute; FOCUS exports | Read the bill after it closes; cannot throttle a key while requests are flowing |
| Open-source LLM proxies | Routing, retries and request logs | Leave the savings maths, chargeback and tamper-evident audit to the team; often store prompts by default |
| Spreadsheets | Flexible and free | Manual, monthly, error-prone; no enforcement at all |
2. Who buys, who uses, why now
- Primary buyer: the engineering lead or CTO of a 20–500 person software company that ships at least two LLM-backed features and spends roughly \$2k–\$200k per month on model APIs.
- Daily user: platform and ML engineers who own the keys and need caps that degrade gracefully (throttle) instead of failing hard.
- Second seat: finance or FinOps, who need a monthly chargeback file by team, and security, who need proof that policies were not edited after the fact.
- Trigger event: the first surprise invoice, or the first outage caused by an organisation-wide cap. Onboarding is a base-URL change, so switching takes minutes rather than a migration.
[Assumption] The \$2k–\$200k band is our own sizing. Below \$2k the pain is small; above \$200k buyers usually run an in-house platform team. We will validate the band with the first 10 design partners (Section 8).
Personas and the job each one hires Meterline for
| Persona | Job to be done | Screen in the demo that does it |
|---|---|---|
| Platform engineer | Stop a runaway key without killing the customer-facing bot | Key table: cap slider and alert / throttle / block action per key |
| Engineering lead | Know this week which change saves the most money | "Next action" panel, sorted by dollars per month, one-click Apply |
| Finance / FinOps | Split the bill by team without a spreadsheet | Chargeback CSV export by key and team |
| Security / audit | Prove who changed which policy, and that the log is intact | Hash-chained audit log with in-browser Verify chain |
Why now
Three dated changes make 2026 the right moment. First, AI spend management went from a minority practice to near-universal within two years (31% to 98%, FinOps Foundation). Second, model catalogues now span a 10× price range inside a single vendor, so model choice has become a finance decision. Third, prompt caching and batch discounts are now generally available at list price, so the savings levers exist and only the per-key decision is missing.
3. The product: what a judge sees in 60 seconds
The demo opens already filled. There is no sign-up screen, no empty state and no "connect your key" step. A deterministic seed creates the workspace "Acme Robotics" on day 20 of the month, with six keys owned by six teams and four Claude models.
Figure 1. Live demo on first load. KPI row (month-to-date $2,689, forecast $4,013, budget $5,200), key table with per-key caps and actions, daily spend chart, and the "Next action" savings panel on the right. The Galuxium logo sits in the header. (see image gallery)
- Read the state. Five KPIs, then a table of keys with month-to-date cost, forecast, cap, usage bar, action and state. A spike on any key is flagged with its z-score.
- Simulate a day. "Simulate next day" advances the clock. On day 21 the marketing key spikes 4.2×; the policy engine evaluates the cap and blocks the key, and an audit event is written.
- Take the next action. The savings panel lists nine candidate changes, each with its monthly dollar value computed from the last seven days. Apply moves the value into "Savings applied" and lowers the forecast.
- Prove it. The audit log records every policy change, spike and optimisation. Verify chain recomputes every SHA-256 link in the browser.
- Check the raw data. A panel at the bottom shows the rate card and the raw usage rows that every number on the page is computed from.
- Govern it. A governance panel maps each record the product keeps to a named control, and a role switcher in the header ("Acting as") locks the controls a finance auditor or a team lead may not touch.
- Trace one request. "Send test request" pushes a 1,200-input, 300-output token call through the same six steps a production request takes, from key authentication to the audit event, and shows where a blocked key is refused.
The whole loop, from reading the state to exporting evidence, takes about 90 seconds of clicking. State persists in the browser, so a judge can close the tab and come back to the same workspace, or press Reset to return to the seed.
Figure 2. After five simulated days and two clicks on Apply: the forecast drops and "Savings applied" rises by the value shown on each card. (see image gallery)
Figure 3. Hash-chained audit log with anomaly and policy events, verified in the browser. (see image gallery)
Figure 4. "Raw data behind every number" panel. Left: the rate card with its source and version. Right: raw usage events (million tokens) for the last seven days and the cost computed from them. Judges can check any dollar on the page by hand. (see image gallery)
The nine recommendations in the seeded workspace
| Recommendation | Lever | Value / month |
|---|---|---|
| Move 100% of eval-harness to Batch API | Batch (−50%) | \$307 |
| Enable prompt caching on support-bot | Cache | \$277 |
| Route 55% of support-bot FAQ calls to Haiku 4.5 | Route | \$260 |
| Enable prompt caching on eval-harness | Cache | \$178 |
| Enable prompt caching on research-lab | Cache | \$132 |
| Move 80% of doc-extract to Batch API | Batch | \$128 |
| Move 50% of marketing-gen to Batch API | Batch | \$116 |
| Route 40% of marketing-gen calls to Haiku 4.5 | Route | \$93 |
| Enable prompt caching on marketing-gen | Cache | \$68 |
| Total, each measured on its own | \$1,559 |
Values are not strictly additive, because caching and routing on the same key overlap. The demo recomputes the remaining value of every card after each Apply, so the panel never double-counts. The cache share (60%) and routable share are marked as assumptions on screen.
4. Architecture and scalability
Meterline is a thin, stateless gateway plus an event pipeline. The request path stays short on purpose: the gateway needs only the virtual key, a cached policy snapshot and a counter. Everything expensive (pricing, forecasting, recommendations, audit anchoring) happens off the request path.
Figure 5. Architecture. Solid arrows are the synchronous request path (app → gateway → provider). Dashed arrows are asynchronous: usage events are priced, optimised and chained off the request path. (see image gallery)
| Stage | What it does | Production implementation |
|---|---|---|
| 1 · Proxy | OpenAI/Anthropic-compatible endpoint; each team gets a virtual key that maps to the real provider key | Rust (axum) on stateless containers; real keys sit in a KMS-backed vault and are never returned to clients |
| 2 · Meter | Reads token counts from the provider's own usage field and prices them with a versioned rate card |
Events to a queue, then Postgres/ClickHouse; every cost row stores the rate-card version it used |
| 3 · Policy | Monthly cap per key with an action: alert, throttle (40% pass-through), block | Counters in Redis, policy snapshot cached in-process; evaluation target under 2 ms p99 |
| 4 · Optimize | Computes the monthly dollar value of prompt caching, model routing and batch moves per key | Deterministic arithmetic on 7-day rolling usage; no LLM decides a number |
| 5 · Audit | Every policy change, spike and optimisation is an event; each event stores SHA-256(prev_hash \ | payload) |
Request sequence
Figure 6. One proxied call. The only added work on the hot path is one Redis read and one increment; pricing and audit happen asynchronously. (see image gallery)
The policy engine in detail
The policy engine is deliberately small. It is a pure function of three inputs: the key's policy (cap, breach action, throttle ratio, fail mode), the key's month-to-date spend, and the key's recent daily spend. It returns one of three decisions: allow, throttle or block. Because it has no hidden state, the same function runs in the gateway, in the console and in the browser demo, and an auditor can re-run any past decision from the stored inputs.
| Quantity | Formula | Seeded example (support-bot, day 20) |
|---|---|---|
| Cost of one day | I·(1−c)·Pin+ I·c·Pcache+ O·Pout, tokens in millions |
9.5 MTok in, 1.6 MTok out, c = 0 on Sonnet 5: 9.5·2 + 1.6·10 = \$35.00 on a weekday |
| Month-to-date (MTD) | Sum of priced daily rows, day 1 to today | \$812 after 25 days (Figure 9) |
| Forecast | MTD + mean(last 7 days) × days left |
Recomputed on every render and after every Apply |
| State | MTD ≥ cap → breach action; forecast > cap → at risk; else ok | support-bot moves to "at risk" when its forecast passes \$900 |
| Spike | z = (today − mean) / stdev over prior days; flag when z > 2.5 |
code-agent on day 24: \$97.96, 8.4σ above its baseline |
| Throttle | Token bucket refilled at ratio × normal rate, ratio 0.40 by default |
A throttled key keeps 40% of its traffic flowing |
In production the check runs on every request. The gateway reads the key's counter from Redis, compares it with the cached policy snapshot, and either forwards the call, delays it through the key's token bucket, or returns HTTP 429 with a JSON body that names the policy and the owner. The counter is incremented with the estimated cost as soon as the provider responds, and corrected by the meter a few seconds later when the exact usage event is priced. The estimate can drift by at most one in-flight request per gateway instance, which is why a cap is a budget control rather than a billing-grade meter; the billing figure always comes from the priced event.
Figure 7. Policy as code and the live request trace in the demo. The six boxes are the steps of a production call; the YAML below is generated from the key table and changes version with every policy event.Policies are stored as code. The console writes a YAML document per workspace (Figure 7) with the rate-card version, the anomaly threshold, the prompt-storage switch and, for each key, its team, model, cap, breach action and applied optimisations. Each change increments the version and emits a policy audit event, so the YAML file and the audit chain always tell the same story. In production the same file can live in the customer's Git repository and be applied through a pull request, which gives platform teams the review workflow they already use for infrastructure.
Latency and capacity budget
| Step on the hot path | Budget (p99) | How it is kept |
|---|---|---|
| TLS termination and routing at the edge | 3 ms | Edge region closest to the customer |
| Virtual-key lookup | 0.3 ms | In-process LRU cache of key hashes, refreshed on change events |
| Counter read and policy decision | 1.5 ms | One Redis GET in the same region; pure function |
| Counter increment after response | 0 ms added | Fire-and-forget after the response has started streaming |
| Event publish | 0 ms added | Asynchronous, batched every 200 ms |
| Total added latency | < 5 ms | Against a typical model latency of 400–4,000 ms, i.e. about 0.1–1% |
Capacity follows from the same budget. A customer at \$20,000 per month on Sonnet-class models sends on the order of 1.5 to 3 million calls a month, about one call per second on average and perhaps 20 per second at peak. One Redis node handles well over 50,000 simple operations per second, so a single regional node serves more than a thousand such workspaces before sharding is needed [Assumption: vendor benchmarks, to be load-tested]. Storage grows with calls, not with tokens: a usage event is about 120 bytes, so 3 million events a month are roughly 360 MB before compression, and the daily roll-up keeps only 30 rows per key per month for the console.
Deployment, reliability and data lifecycle
- Hosting. The hackathon console is a static site on GitHub Pages (public CDN) with a mirror on our own object storage. The production gateway targets Fly.io or Cloudflare edge regions, with managed Postgres and Redis in the same region as each customer's traffic.
- Service levels. Target 99.95% monthly availability for the gateway, measured per region. When the gateway itself is unhealthy, customers can point their base URL back at the provider in one configuration change, because Meterline never changes request or response bodies.
- Retention. Raw usage events are kept for 30 days, daily roll-ups for 25 months, audit events for 7 years or the customer's own policy. Nothing in these tables contains prompt text.
- Backups. Point-in-time recovery for Postgres, and a daily export of the audit chain anchor hash to the customer's SIEM so a restored database can be proven identical.
Scalability
- Horizontal gateway. The gateway holds no request bodies and no session state, so it scales behind any load balancer. A single 2-vCPU container comfortably handles hundreds of proxied calls per second because model latency (hundreds of milliseconds) dwarfs the policy check [Assumption: to be load-tested].
- Sharded counters. Counters are keyed by virtual key, so one noisy tenant cannot create a hot shard for others.
- Aggregation. Raw usage events roll up into daily rows per key, which keeps the console query cost flat as traffic grows.
- Fail-open per key. If Redis is unreachable, each key follows its configured mode: fail-open (customer-facing) or fail-closed (batch jobs).
- Adding a provider. One rate-card table and one protocol adapter. Adding a customer is a base-URL change.
The hackathon demo is a single static HTML file that runs the same metering, policy, recommendation and audit code in the browser against seeded traffic. Every number is recomputed on each render, and the page loads with zero console errors (checked with Playwright, 2026-09-29). The source, the build script and the production schema are public at https://github.com/iamhuman-cheolheelee/meterline.
5. Enterprise governance and compliance
- No prompt storage. Meterline records token counts, model, key, latency and cost. Prompt and completion bodies stay in memory for the length of the proxied call and are never written to disk or logs.
- Tamper-evident audit. Each event carries the hash of the previous one. The demo's Verify chain button recomputes every hash in the browser; editing any past event breaks the chain from that point on (Figure 3).
- Least privilege. Teams receive virtual keys. Rotating a provider key is one vault update with no redeploy for any team, and revoking a team is one row.
- Explainable numbers. Every saving shown on screen is plain arithmetic on the rate card and the last seven days of usage, and the raw rows are on the same page (Figure 4). The LLM is never asked to produce a dollar figure.
- Graceful enforcement. Throttle keeps customer-facing features alive at 40% volume while the alert goes to the owner, instead of an organisation-wide cut-off.
- Data residency. On the Enterprise plan the gateway is self-hosted; only aggregated usage leaves the customer's network.
Role-based access and change control
Governance starts with who may change a policy. The demo ships three roles, and the header switch lets a judge act as each of them. A FinOps admin can edit every cap and action, apply every saving and export evidence. A team lead can change only the keys of their own team, which is how a platform group delegates day-to-day budget ownership without handing out the whole workspace. An auditor can read everything and export the evidence pack, but every slider and selector is locked (Figure 10). Each role switch is itself an access event in the chain.
Figure 8. Governance and compliance evidence panel: seven controls, the record that answers each, and a live evidence count. Below it, the role matrix. (see image gallery)
Figure 9. Tamper test: one past event is edited in place, and Verify chain reports the break. The original is restored a few seconds later and the chain verifies again. (see image gallery)
Figure 10. The key table while acting as Auditor. Caps and breach actions are visible but locked; the same view is what an external auditor receives. (see image gallery)
Changes follow a simple rule: every mutation is an event before it is a state. The console writes the audit event and then updates the policy, so there is no state in the system that the chain cannot explain. The evidence pack button exports the whole chain as JSON with each event's previous hash, so a third party can re-verify it with ten lines of code and without access to Meterline.
Mapping to named controls
The governance panel (Figure 8) maps what Meterline records to controls that security and compliance teams already track. The mapping says where evidence comes from; it is not a certification, and the customer's auditor decides whether it is sufficient.
| Framework and control | What Meterline records | Evidence produced |
|---|---|---|
| SOC 2, CC6.1 logical access | Per-key virtual tokens; role-scoped edits | Key list with owners; role matrix; access events |
| SOC 2, CC7.2 system monitoring | Spend anomalies above 2.5σ as events | anomaly events with value and z-score |
| SOC 2, CC8.1 change management | Every cap and action change, with actor and time | policy events; versioned policy YAML |
| ISO/IEC 27001:2022, A.8.15 logging | Append-only, SHA-256 hash-chained log | Evidence pack (JSON) and daily anchor hash |
| ISO/IEC 27001:2022, A.8.16 monitoring activities | Daily metering against cap; forecast breach | Key states and forecast history |
| EU AI Act, Art. 12 record-keeping | Model, key, tokens and latency per request, without prompts | Usage events retained per policy; supports deployers of high-risk systems |
| FinOps FOCUS, cost allocation | Cost by team and key, with rate-card version | Chargeback CSV; FOCUS export (roadmap) |
Threat model
| Threat | Control in Meterline |
|---|---|
| A leaked team key runs up a bill overnight | Virtual key is revocable in one row; cap with block action stops spend at a known dollar limit; anomaly event fires on the first abnormal day |
| An insider raises their own cap and hides it | Role scope limits who can edit; the change is an event before it is a state; the chain cannot be rewritten without detection |
| Meterline staff read customer prompts | Prompts are never persisted; Enterprise gateway runs in the customer's network |
| The gateway is compromised | Provider keys are fetched per request from a KMS-backed vault with short-lived credentials; gateway images are signed; blast radius is one region |
| The database is restored from an old backup | Daily anchor hash in the customer's SIEM proves which chain head is authentic |
Mapping to common audit controls
| What an auditor asks | Where Meterline answers it |
|---|---|
| Who could spend on which model, and who changed it? | Virtual key per team; every cap or action change is a hash-chained policy event with the actor |
| Can the log be edited after the fact? | Each event stores SHA-256 of the previous one; the daily anchor hash leaves the system for the customer's SIEM |
| Is customer data sent to or kept by a third party? | Only token counts and cost are stored; the Enterprise gateway runs inside the customer's network |
| Who pays for what? | Monthly chargeback CSV by team and key, priced with the rate-card version in force that day |
| How are secrets handled? | Provider keys live in a KMS-backed vault; clients only ever hold revocable virtual keys |
| What happens when enforcement fails? | Per-key fail-open or fail-closed mode, chosen by the owner and itself recorded as a policy event |
Responsible AI stance
Meterline does not generate content and does not make decisions about people. The only AI-adjacent decision it makes is which model serves a request, and that decision is a rule the key owner writes and can read back. Routing suggestions state the share of traffic they assume is routable, so an engineer can reject them when quality matters more than cost.
6. Measured and projected impact
We separate what the demo measures from what we project. Measured values come from the seeded workspace and can be reproduced by anyone who opens the link. Projected values are marked as assumptions.
| Metric | Before Meterline | With Meterline | Basis |
|---|---|---|---|
| Candidate monthly savings visible per key | \$0 (not visible) | \$1,559 on a \$4,013 month (39%) | Measured in demo seed |
| Traffic kept alive when a cap trips | 0% (org hard cap) | 40% (throttle) | Product rule |
| Time from spike to owner alert | Next invoice or console check | Same simulated day | Measured in demo (day 21 spike) |
| Monthly chargeback preparation | ≈ 6 hours in spreadsheets | One CSV export | [Assumption] interview estimate |
| Onboarding time | - | Under 10 minutes (base-URL change) | Product design |
| Savings rate on governed spend | - | 22% | [Assumption] conservative vs 39% in seed |
Figure 11. Savings waterfall for the seeded workspace, each recommendation valued on its own. Upper bound: the demo recomputes overlaps after each Apply, so the realised figure is slightly lower. (see image gallery)
How each saving is calculated
Every value in the savings panel comes from one of three formulas applied to the key's last seven days of usage, then scaled to a 30-day month. Weekends in the seed run at 55% of weekday volume, so a seven-day average is about 0.87 of a weekday. The worked examples below reproduce the panel's figures to within a few dollars; the remaining difference is the day-to-day noise in the seeded traffic.
| Lever | Formula (per day) | Worked example from the seed |
|---|---|---|
| Prompt caching | I × c × (Pin− Pcache), with c the cacheable share of input |
support-bot: 9.5 × 0.6 × (2.00 − 0.20) = \$10.26 a weekday; × 0.87 × 30 ≈ \$268 (panel: \$277) |
| Model routing | s × (cost on current model − cost on Haiku 4.5), with s the routable share |
support-bot: 0.55 × (\$35.00 − \$17.50) = \$9.63; × 0.87 × 30 ≈ \$251 (panel: \$260) |
| Batch API | b × 0.5 × daily cost, with b the batchable share |
eval-harness: 1.0 × 0.5 × \$24.40 = \$12.20; × 0.87 × 30 ≈ \$318 (panel: \$307) |
The shares c, s and b are the only judgement calls, and they are shown on each card so an engineer can disagree with them. In production they are measured rather than assumed: the cacheable share comes from the length of the repeated prefix in each key's requests (hashed, never stored), the routable share from output-length and tool-use patterns, and the batchable share from the time of day and latency tolerance declared on the key.
What the numbers mean for one customer and for the portfolio
| Effect | Calculation | Value |
|---|---|---|
| Monthly savings for an average Team workspace | \$20,000 × 22% [Assumption] | \$4,400 / mo |
| Finance time saved on chargeback | 6 h × \$75 loaded hourly cost [Assumption] | \$450 / mo |
| Net benefit after the Team fee | \$4,400 + \$450 − \$199 | \$4,651 / mo |
| Customer-facing traffic kept during a cap event | 40% throttle vs 0% under a hard cap | +40 points |
| Spend stopped by a block action after a leak | Loss bounded at the cap instead of the provider limit | ≤ cap |
| Portfolio savings at month 18 (150 Team workspaces) | 150 × \$4,400 × 12 | ≈ \$7.9M / yr |
The seeded workspace shows a larger effect than we assume for customers: \$1,559 of \$4,013, or 39%. We plan and price on 22% because real traffic has less obvious waste than a seed built to show all three levers, and because overlapping levers on one key reduce each other's value.
7. Monetization blueprint
Meterline charges on the spend it governs. The price scales with the value delivered and stays small relative to the savings it finds, which makes the purchase easy to defend to a CFO.
| Plan | Price | Includes |
|---|---|---|
| Starter | Free up to \$2k governed spend / month | 3 keys, alerts, 30-day history; the self-serve funnel |
| Team | \$49 / month + 1% of governed spend above \$5k | Unlimited keys, throttle/block, savings engine, CSV chargeback |
| Enterprise | max(\$1,500, 0.6% of governed spend) / month | SSO, SIEM export, self-hosted gateway, custom rate cards, SLA |
Worked example (from the live demo)
At \$24,000 governed spend the Team plan costs \$239 per month. At \$80,000 it costs \$799. The seeded workspace surfaces savings worth 39% of its forecast. Even at a conservative 22% savings rate, a customer at \$24,000 saves about \$5,280 a month against a \$239 fee, and a customer at \$80,000 saves about \$17,600 against \$799, roughly a 22× return in both cases.
Figure 12. Plan calculator in the demo. The recommended plan is highlighted as the governed-spend slider moves, and the ROI line updates.18-month revenue path [Assumption]
Figure 13. Target MRR path to 150 Team and 5 Enterprise workspaces by month 18 (≈ $29.9k Team + ≈ $7.5k Enterprise). (see image gallery)
| Unit economics [Assumption] | Value |
|---|---|
| Average governed spend per paying Team workspace | \$20,000 / mo |
| Average revenue per Team workspace | \$199 / mo |
| Infrastructure cost per workspace (gateway share + storage) | ≈ \$12 / mo |
| Gross margin | ≈ 94% |
| Blended CAC (content + founder-led sales) | ≈ \$600 |
| CAC payback | ≈ 3.2 months |
| Target: 150 Team + 5 Enterprise workspaces in 18 months | ≈ \$37k MRR |
How the unit economics are derived
- Revenue per Team workspace. \$49 + 1% × (\$20,000 − \$5,000) = \$199 a month.
- Cost to serve. Gateway compute share ≈ \$5, Postgres and TimescaleDB storage ≈ \$4, Redis ≈ \$2, logging and egress ≈ \$1, total ≈ \$12 a month. Gross margin is (\$199 − \$12) / \$199 ≈ 94% before payment fees, and about 91% after card processing (2.9% + \$0.30).
- Lifetime value. At an assumed 3% monthly logo churn the average lifetime is about 33 months, so LTV ≈ \$187 × 33 ≈ \$6,200 and LTV / CAC ≈ 10 [Assumption].
- Payback. \$600 CAC / \$187 monthly gross profit ≈ 3.2 months.
- Billing mechanics. Governed spend is already measured by the meter, so it is reported to Stripe Billing as a daily metered usage record; the invoice at month end is the plan fee plus 1% of the spend above \$5,000. There is no separate usage estimate to dispute: the customer sees the same number in the console.
Sensitivity: the fee stays small even if savings disappoint
| Realised savings rate | Savings at \$20k spend | Team fee | Return on fee |
|---|---|---|---|
| 5% | \$1,000 | \$199 | 5× |
| 10% | \$2,000 | \$199 | 10× |
| 22% (planning case) | \$4,400 | \$199 | 22× |
| 39% (demo seed) | \$7,800 | \$199 | 39× |
Acquisition funnel to 150 paying workspaces [Assumption]
A public "LLM price diff" page that tracks list-price changes across providers is the top of the funnel. At 10,000 monthly visitors and a 3% sign-up rate we get about 300 free workspaces a month. If 20% route real traffic through the gateway (60) and a quarter of those cross \$5,000 of governed spend within three months, about 15 workspaces convert to Team each month. After churn, that reaches roughly 150 paying Team workspaces by month 18, which is the path shown in Figure 13. Enterprise deals come from founder-led sales to design partners that outgrow the Team plan.
8. Go-to-market, roadmap and risks
Figure 14. Roadmap. Teal bars are the self-serve track, amber bars the enterprise track. (see image gallery)
- Weeks 1–4: ship the proxy for Anthropic and OpenAI-compatible APIs, Stripe metered billing for the Team plan, GitHub OAuth sign-up.
- Weeks 5–8: 10 design partners from Korean AI startups in our own network; publish a public "LLM price diff" page as the SEO entry point.
- Quarter 2: FOCUS-format export for FinOps tools, SSO, Slack alerts, per-feature tags inside a key.
- Quarters 3–6: self-hosted Enterprise gateway, SIEM connectors, custom rate cards for negotiated contracts.
Success metrics we will report to design partners
| Metric | Target at month 3 |
|---|---|
| Design partners live on the gateway | 10 |
| Governed spend through the gateway | \$150k / mo |
| Recommendations applied per workspace | ≥ 3 |
| Realised savings rate | ≥ 15% |
| Added gateway latency, p99 | < 10 ms |
Risks and mitigations
| Risk | Mitigation |
|---|---|
| Providers improve their own consoles | Multi-provider view and per-key in-path enforcement, which a single vendor has little reason to build for competitors' models |
| Gateway adds latency or becomes a single point of failure | Edge deployment, per-key fail-open mode, latency budget published on a status page |
| Customers distrust a proxy with their keys | Virtual keys, no prompt storage, self-hosted gateway on Enterprise |
| Savings rate lower than assumed | Fee is a small share of spend; at 5% savings the Team plan still returns about 5× its fee |
9. How we meet each judging criterion
| Criterion (weight) | Evidence in this submission |
|---|---|
| Technical Architecture & Scalability (20%) | Stateless gateway, per-key sharded counters, async pricing and audit, daily aggregation, a pure-function policy engine with a published latency budget (Section 4, Figures 5–7); versioned rate card; public repository with schema; deterministic seeded demo with zero console errors. |
| Enterprise Governance & Compliance (20%) | No prompt storage, SHA-256 hash-chained audit with in-browser verification and tamper test, three-role access control, policy as code, evidence pack, mapping to SOC 2, ISO/IEC 27001, EU AI Act and FOCUS, threat model (Section 5, Figures 8–10). |
| Product Innovation & Market Fit (20%) | Existing tools show cost after the fact; Meterline enforces per-key policy in the request path and prices the next fix. Pain backed by FinOps Foundation data and a 10× public price gap (Sections 1–2). |
| Monetization & Fiscal Design (15%) | Free → percentage of governed spend → enterprise floor; worked example, derived unit economics, sensitivity table, funnel, 18-month MRR path, all assumptions marked (Section 7, Figures 12–13); in-app calculator. |
| UI/UX & Visual Refinement (15%) | Opens already filled with data; one primary button; raw-data panel; sortable table, filter, keyboard shortcuts, dark mode, mobile layout, toast feedback, local persistence, role-aware locked controls (Figures 1–4, 10, 15–16). |
| Keynote Pitch & Demo Completeness (10%) | 2:33 narrated video walking the full loop: spike → policy → recommendation → apply → audit verify → chargeback → pricing. The governance panel and request trace are live in the hosted demo. |
Figure 15. Dark mode (shortcut d). (see image gallery)
10. Team, originality and declaration
Meterline is a solo entry by Cheolhee Lee (full-stack and AI engineering; Polaapp, Daejeon, Republic of Korea). He did the product design, code, writing and video. He has operated multi-provider LLM API keys and billing consoles in production, which is where the per-key throttle idea came from.
All code for Meterline was written during the hackathon window, starting on 2026-09-26. No earlier product or previous hackathon entry was reused. Open-source libraries and public model APIs are used as permitted by the rules. The entrant retains the IP and grants Galuxium the non-exclusive promotional licence set out in the rules. Contact details are on our Devpost profile for judging and prize delivery.
Cheolhee Lee (solo entrant)
Date: 2026-09-29
Appendix A. Data model (core tables)
PostgreSQL 16 with TimescaleDB for raw usage. The complete DDL is docs/schema.sql in the public repository.
| Table | Columns | Notes |
|---|---|---|
workspace |
id, name, plan, region, created_at | One per customer organisation |
member |
id, workspace_id, email, role, team | role ∈ admin, team_lead, auditor; team scopes a lead |
rate_card |
version, provider, model, input_usd, output_usd, cache_usd, batch_discount, fetched_at | Immutable per version; primary key (version, provider, model) |
api_key |
id, workspace_id, name, team, provider, model_default, vault_path, virtual_token_hash, cap_usd, on_breach, throttle_ratio, fail_mode, revoked_at | Virtual key; the real key is referenced by vault path only |
usage_event |
ts, key_id, model, input_tokens, output_tokens, cached_tokens, latency_ms, cost_usd, rate_card_version, decision | Hypertable, 30-day raw retention; no prompt column by design |
usage_daily |
key_id, day, input_mtok, output_mtok, cached_mtok, cost_usd, rate_card_version | Rolled up from raw events; drives the console |
recommendation |
id, key_id, kind, value_usd_month, assumptions (jsonb), status, computed_at | kind ∈ cache, route, batch |
audit_event |
seq, workspace_id, ts, actor, kind, message, prev_hash, hash | Append-only; `hash = sha256(prev_hash |
Appendix B. Public API (planned)
| Endpoint | Purpose |
|---|---|
POST /v1/messages, POST /v1/chat/completions |
Drop-in proxy endpoints (Anthropic and OpenAI-compatible) |
GET /api/keys · PATCH /api/keys/:id |
List keys; change cap, action or fail mode (writes a policy event) |
GET /api/recommendations · POST /api/recommendations/:id/apply |
Read and apply savings actions |
GET /api/audit/evidence.json |
Evidence pack: the full chain with previous hashes, for third-party verification |
GET /api/audit/verify |
Recompute the chain and return the first broken link, if any |
GET /api/export/chargeback.csv · /focus.csv |
Monthly chargeback and FOCUS exports |
Appendix C. Plan pricing at different spend levels
| Governed spend / mo | Recommended plan | Fee / mo | Savings at 22% | Return on fee |
|---|---|---|---|---|
| \$2,000 | Starter | \$0 | \$440 | - |
| \$24,000 | Team | \$239 | \$5,280 | 22× |
| \$80,000 | Team | \$799 | \$17,600 | 22× |
| \$200,000 | Enterprise | \$1,500 | \$44,000 | 29× |
At \$200,000 the Team formula would give \$1,999, so the Enterprise floor of \$1,500 (0.6% = \$1,200, floor applies) is the cheaper and recommended plan.
Appendix D. Sources and assumptions
- Anthropic model pricing, fetched 2026-09-26: https://docs.anthropic.com/en/docs/about-claude/pricing
- FinOps Foundation, State of FinOps: https://data.finops.org/
- AICPA Trust Services Criteria (SOC 2); ISO/IEC 27001:2022 Annex A; Regulation (EU) 2024/1689 (AI Act), Article 12; FinOps Foundation FOCUS specification.
- Galuxium Nexus V2 requirements and judging criteria: https://galuxium-nexus-v2-29411.devpost.com/
- Items marked [Assumption] are our estimates. The demo workspace "Acme Robotics" and its traffic are synthetic and marked as such on screen; the seed is fixed so every judge sees the same numbers.
Appendix E. Figure list
The image gallery on this page holds the product screenshots (figures 1–4, 7–10, 15–16). All 16 figures, including the architecture diagram, sequence diagram, savings waterfall, plan calculator, MRR path and roadmap, are in the full write-up PDF: https://link.chlee.dev/mu74r4vs/meterline-submission-v3.pdf
| Figure | Content |
|---|---|
| 1 | Dashboard on first load |
| 2 | After simulated days and Apply |
| 3 | Hash-chained audit log |
| 4 | Raw data panel (rate card and usage events) |
| 5 | Architecture diagram |
| 6 | Request sequence |
| 7 | Policy as code and live request trace |
| 8 | Governance and compliance evidence panel |
| 9 | Tamper test breaks the chain |
| 10 | Key table while acting as Auditor |
| 11 | Savings waterfall |
| 12 | Plan calculator |
| 13 | 18-month MRR path |
| 14 | Roadmap |
| 15 | Dark mode |
| 16 | Mobile layout |
Built With
- anthropic-api
- css3
- github
- html5
- javascript
- localstorage
- postgresql
- redis
- svg
- timescaledb

Log in or sign up for Devpost to join the conversation.