-
-
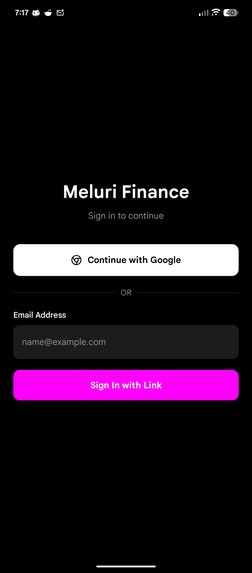
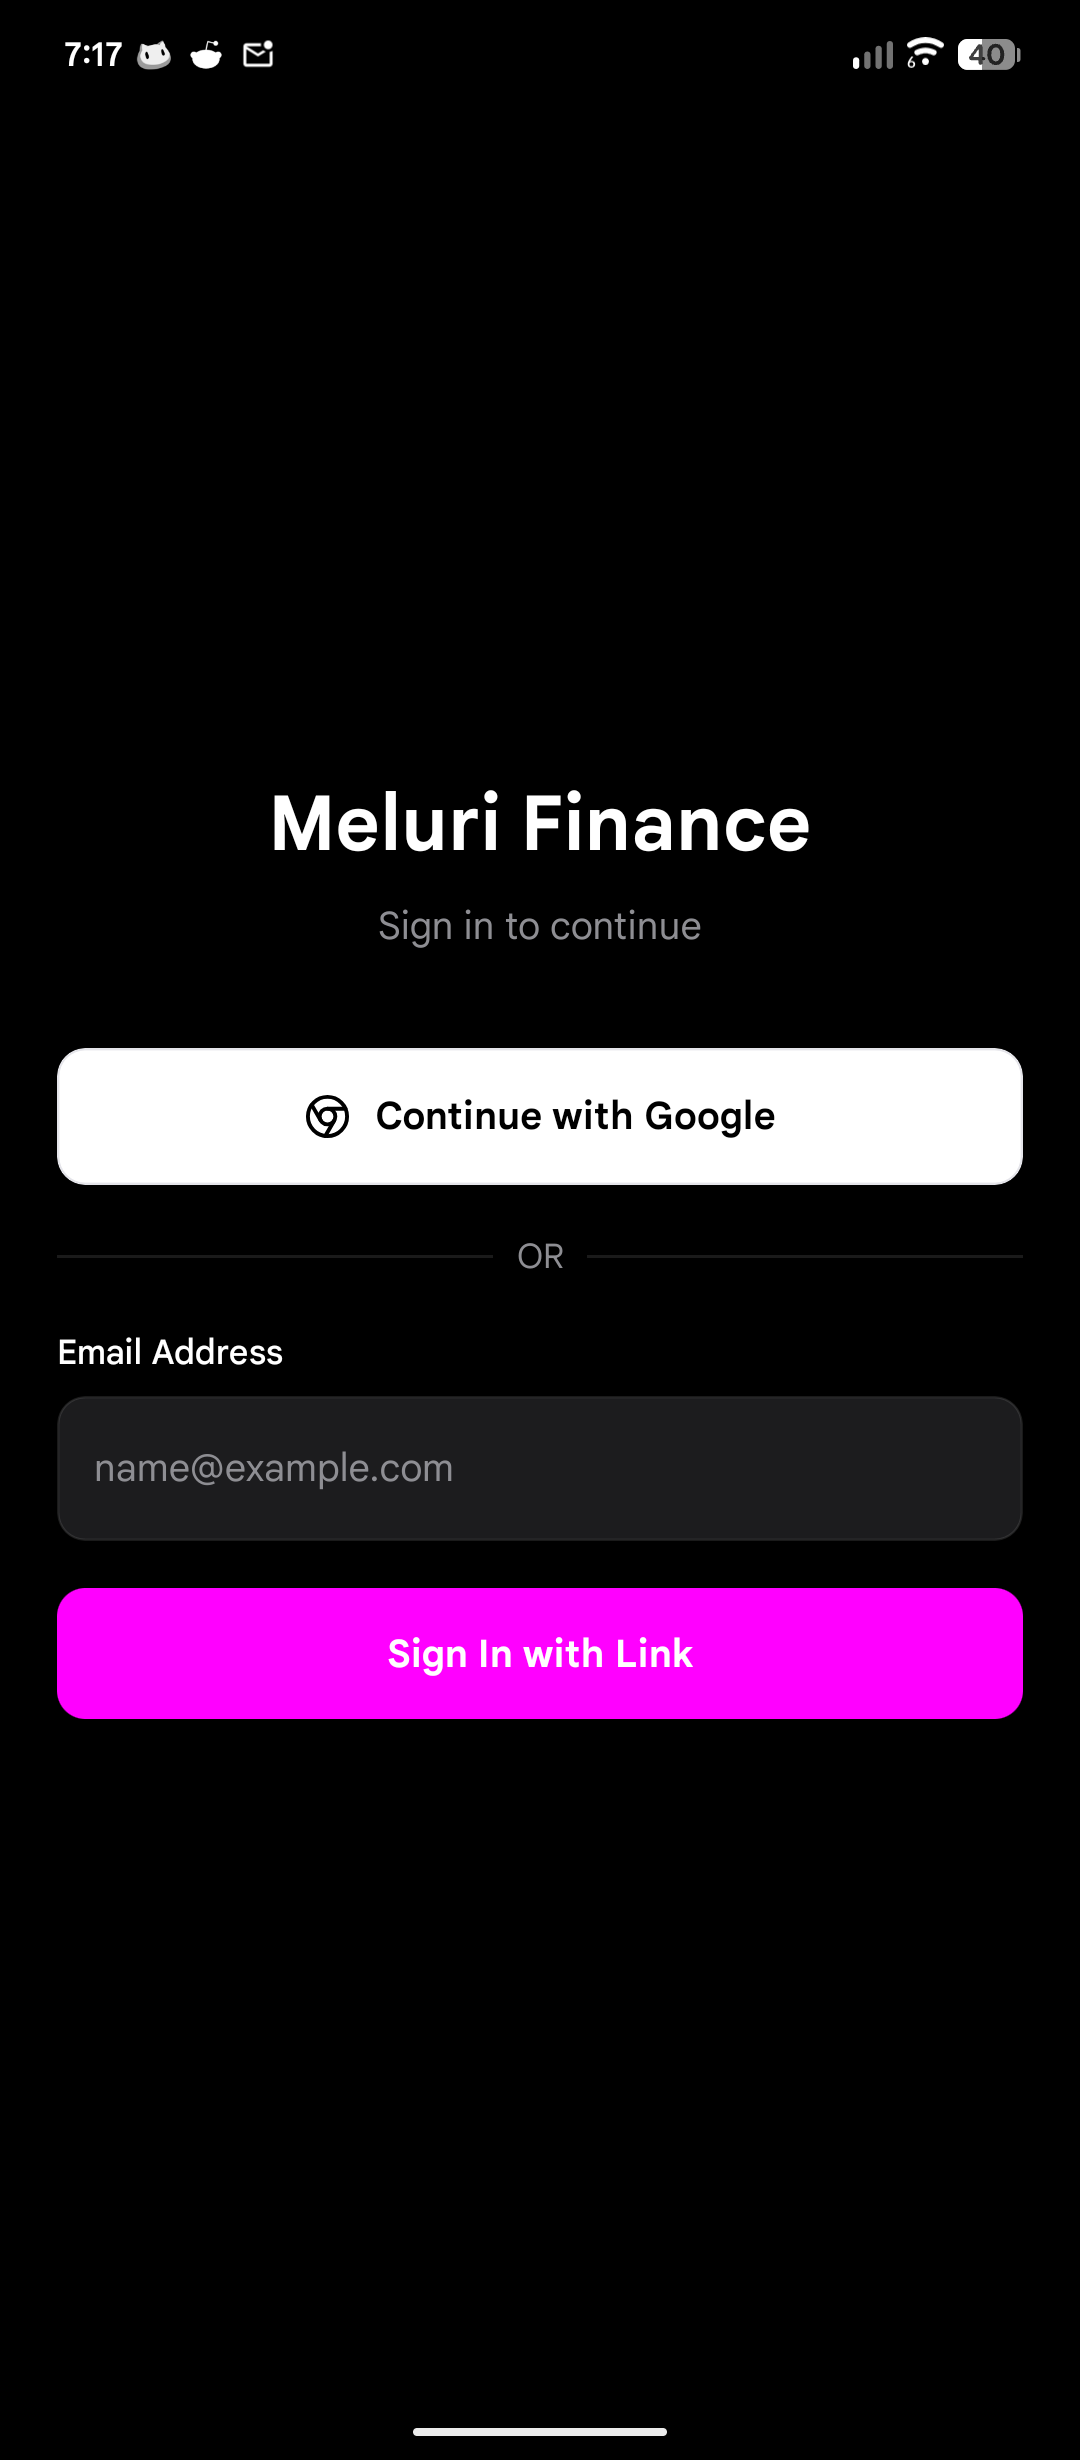
Welcome Screen
-
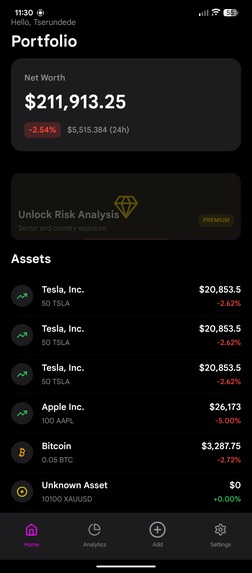
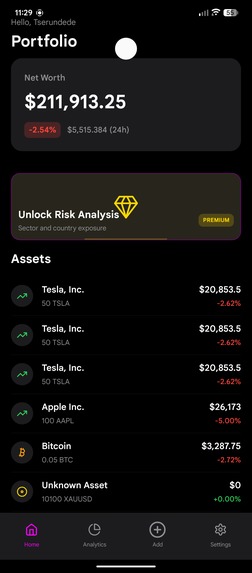
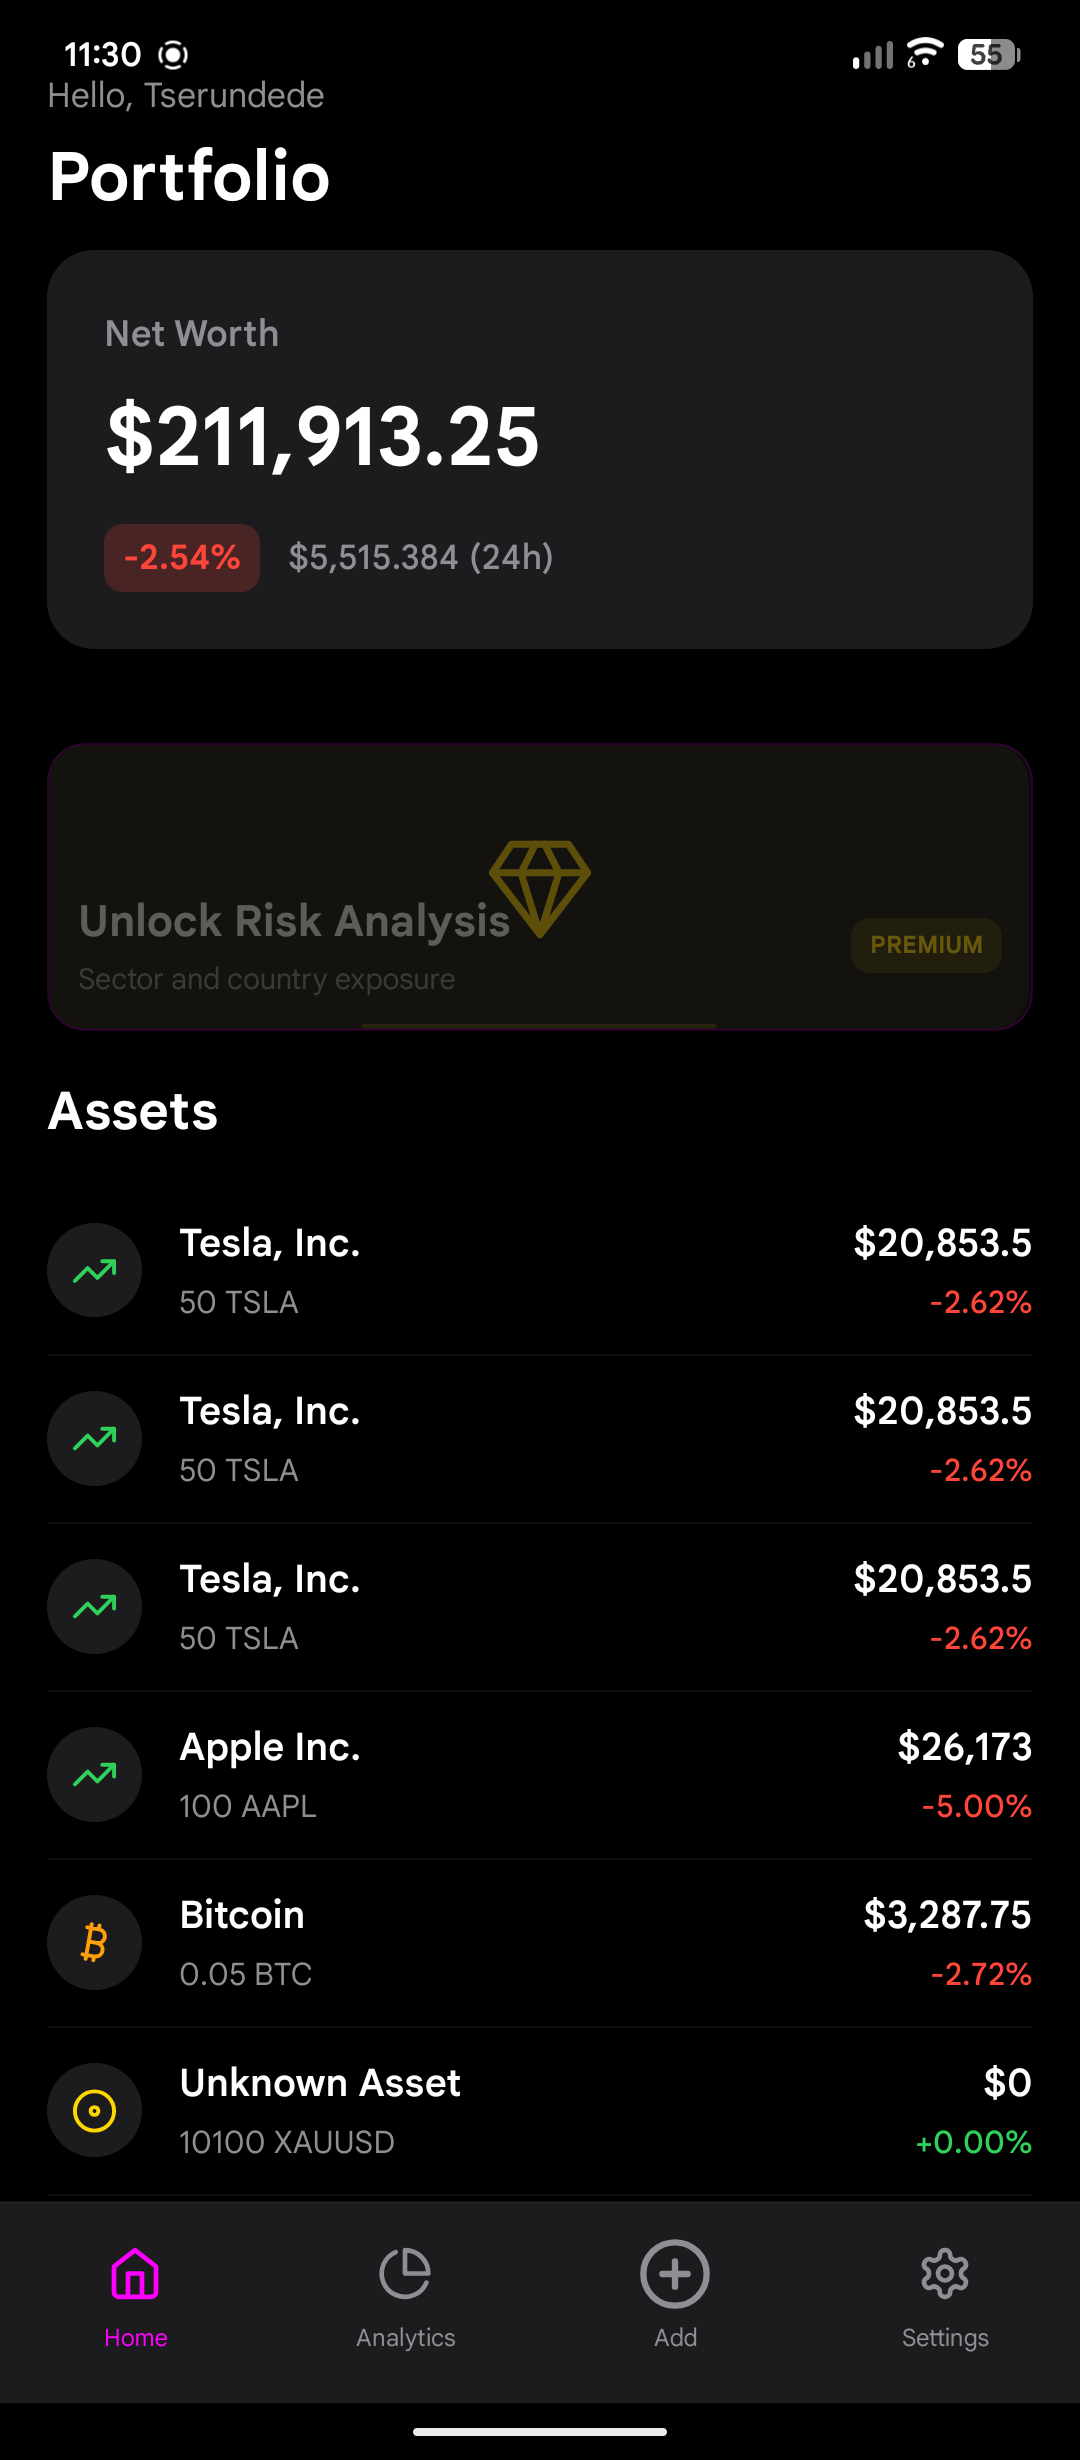
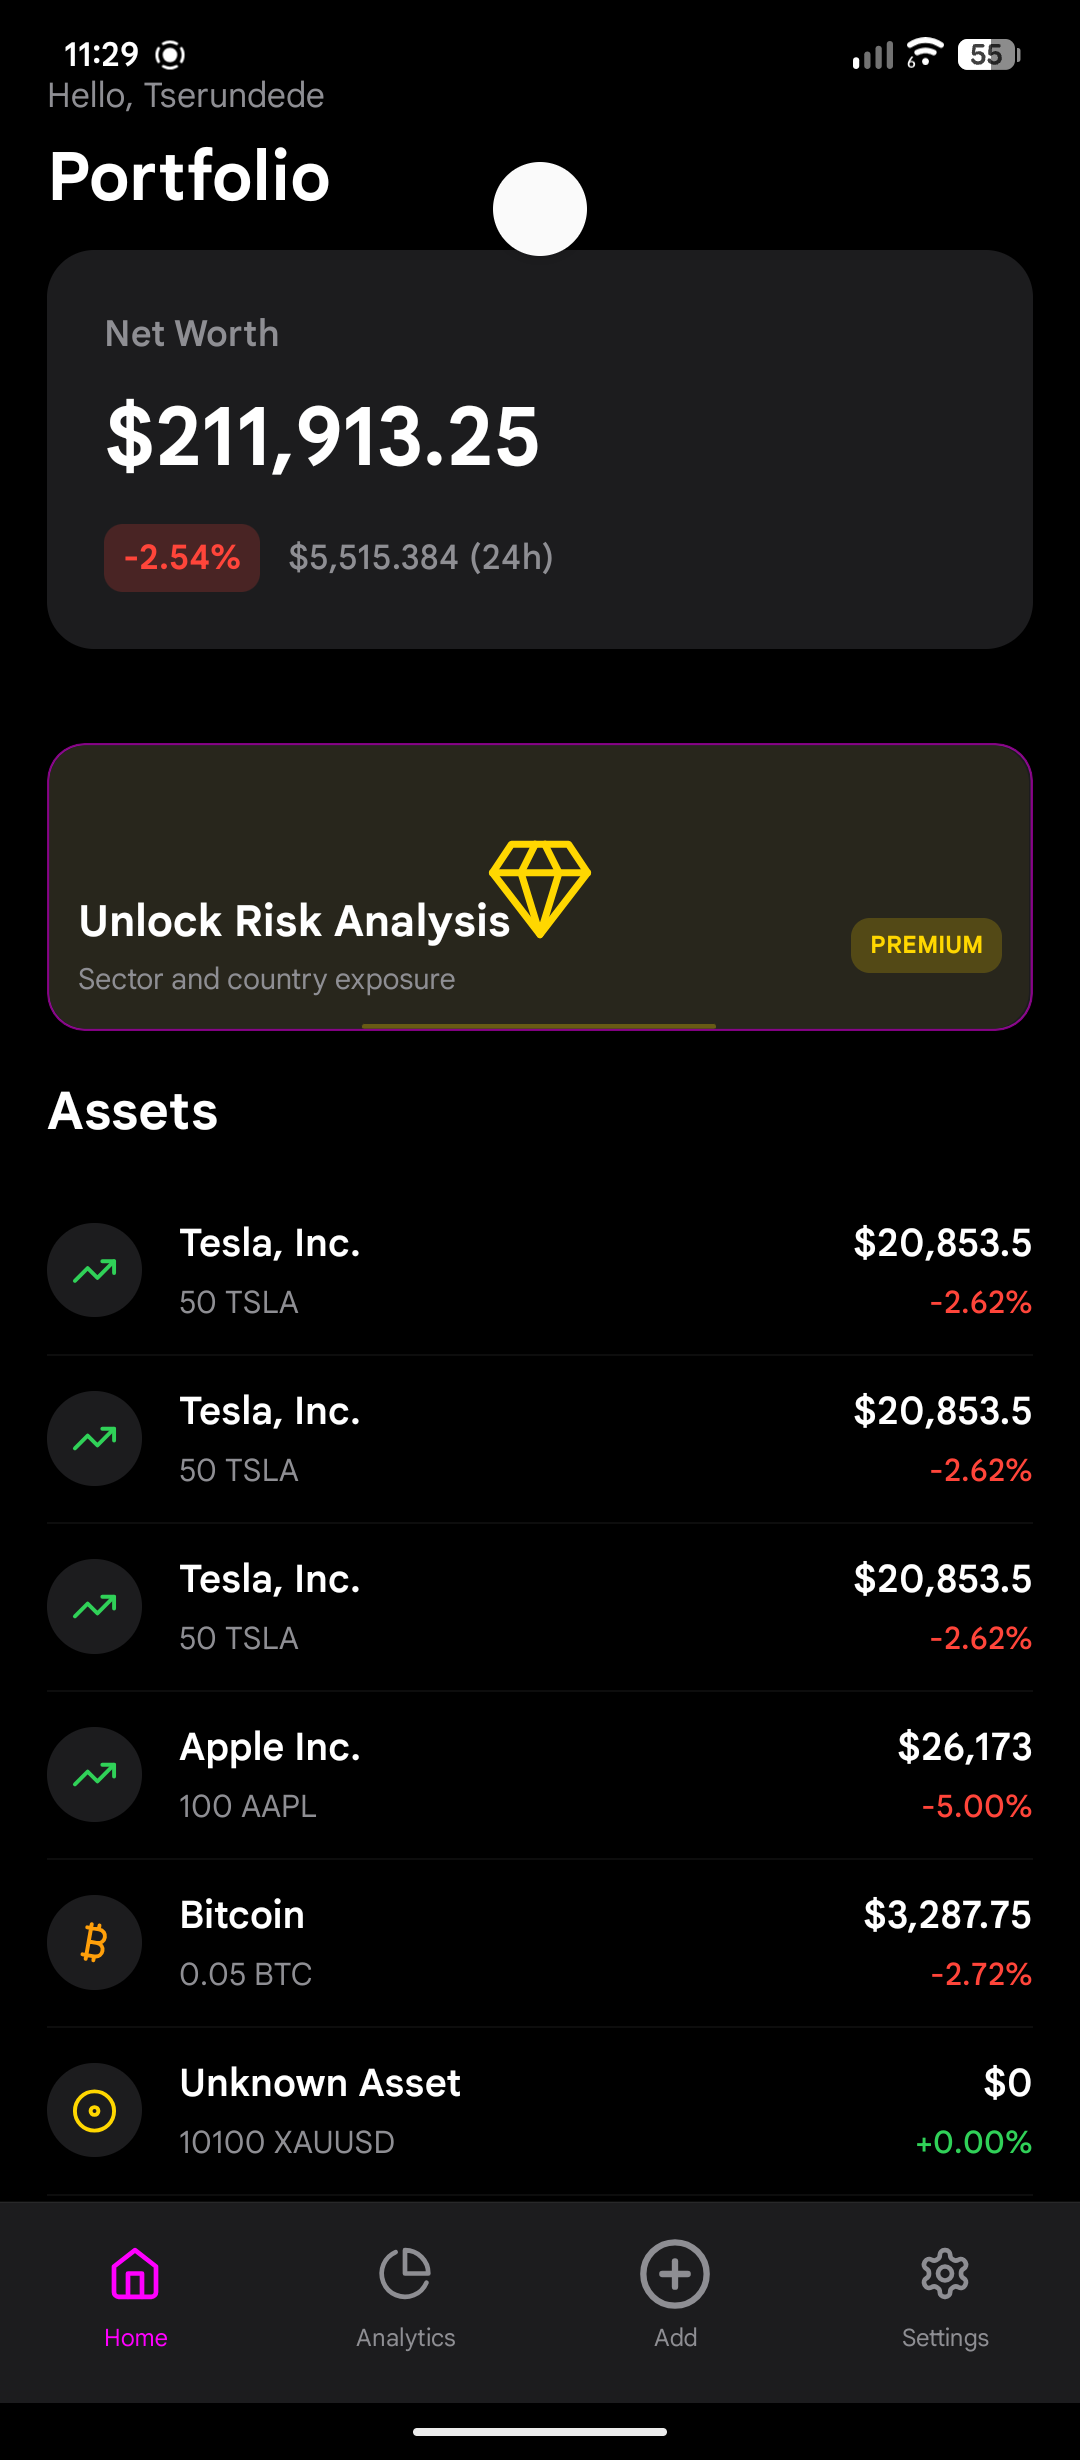
Home Screen
-

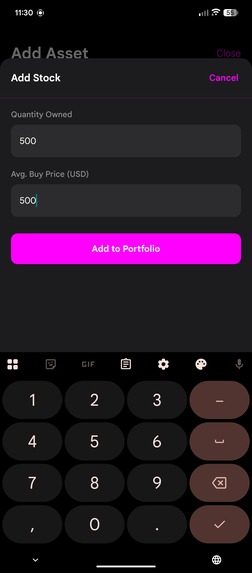
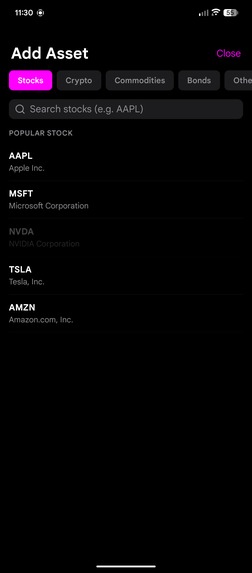
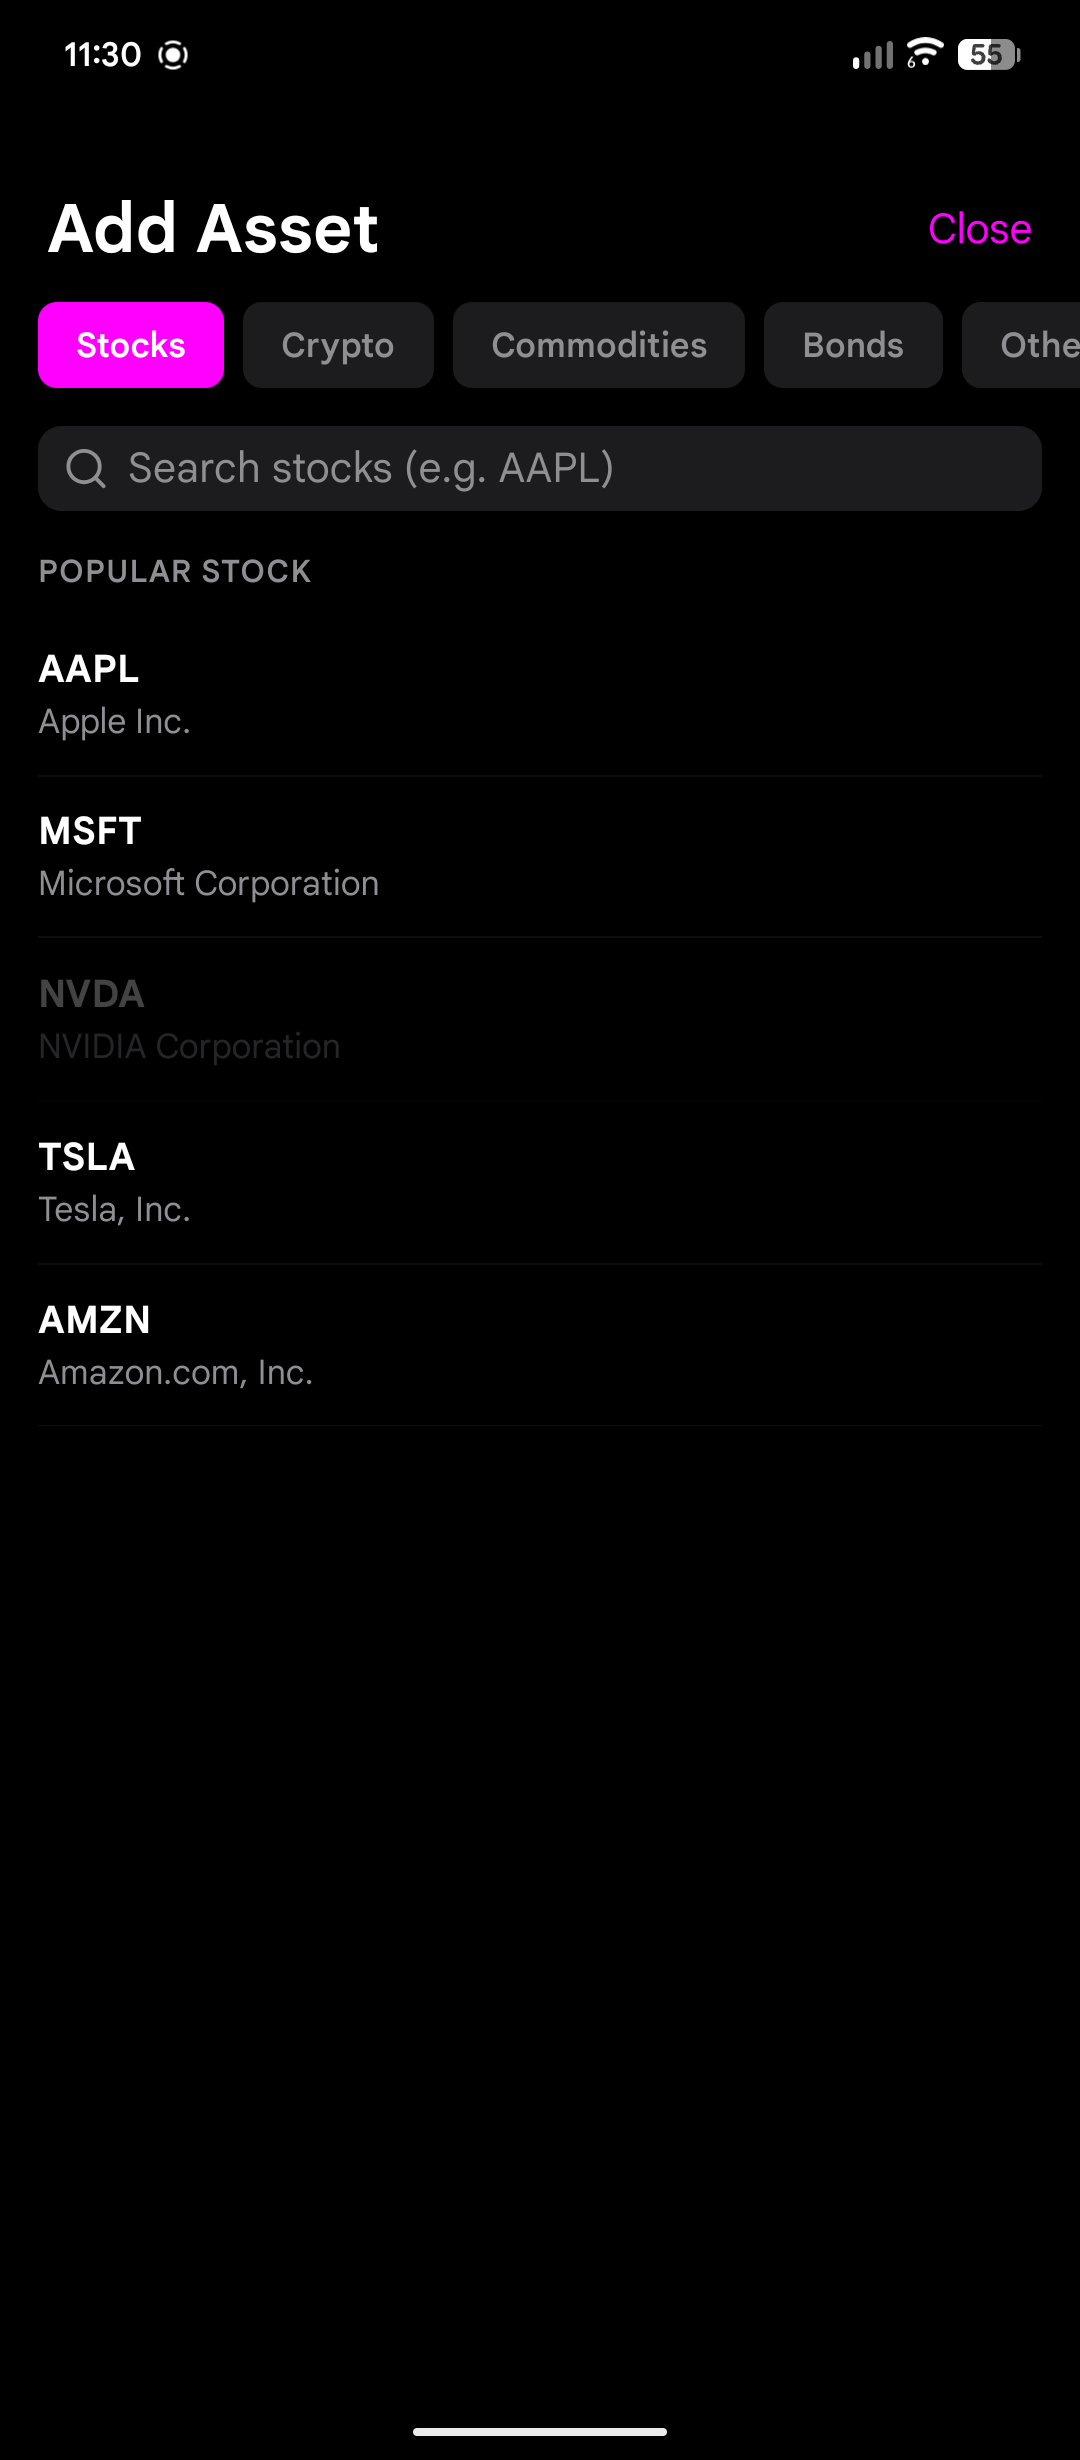
Add Asset Screen
-
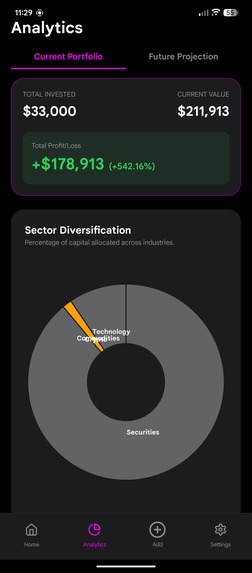
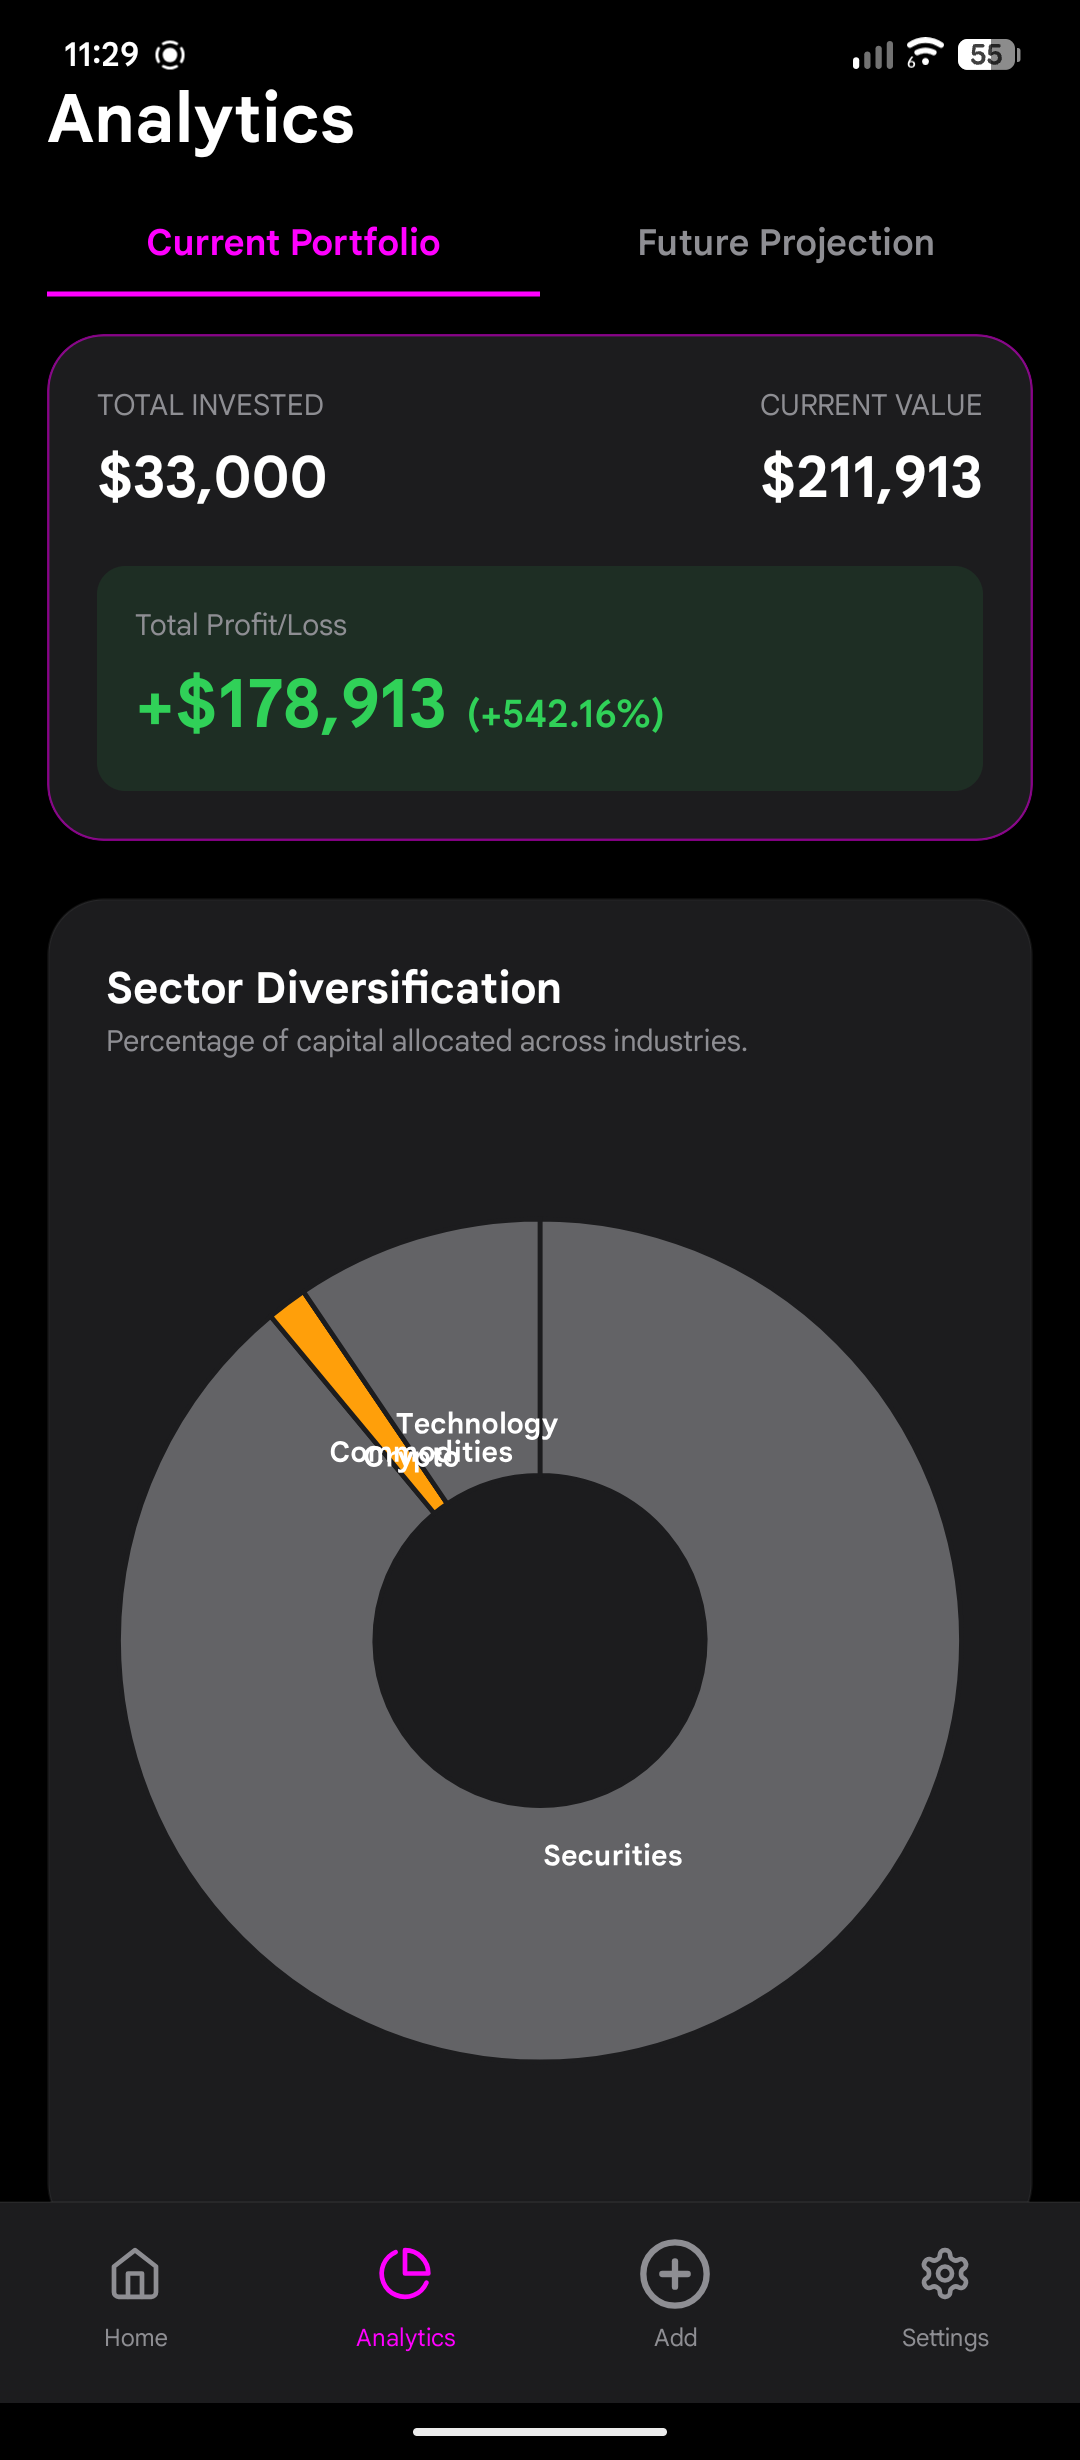
Analytics Screen
-
-

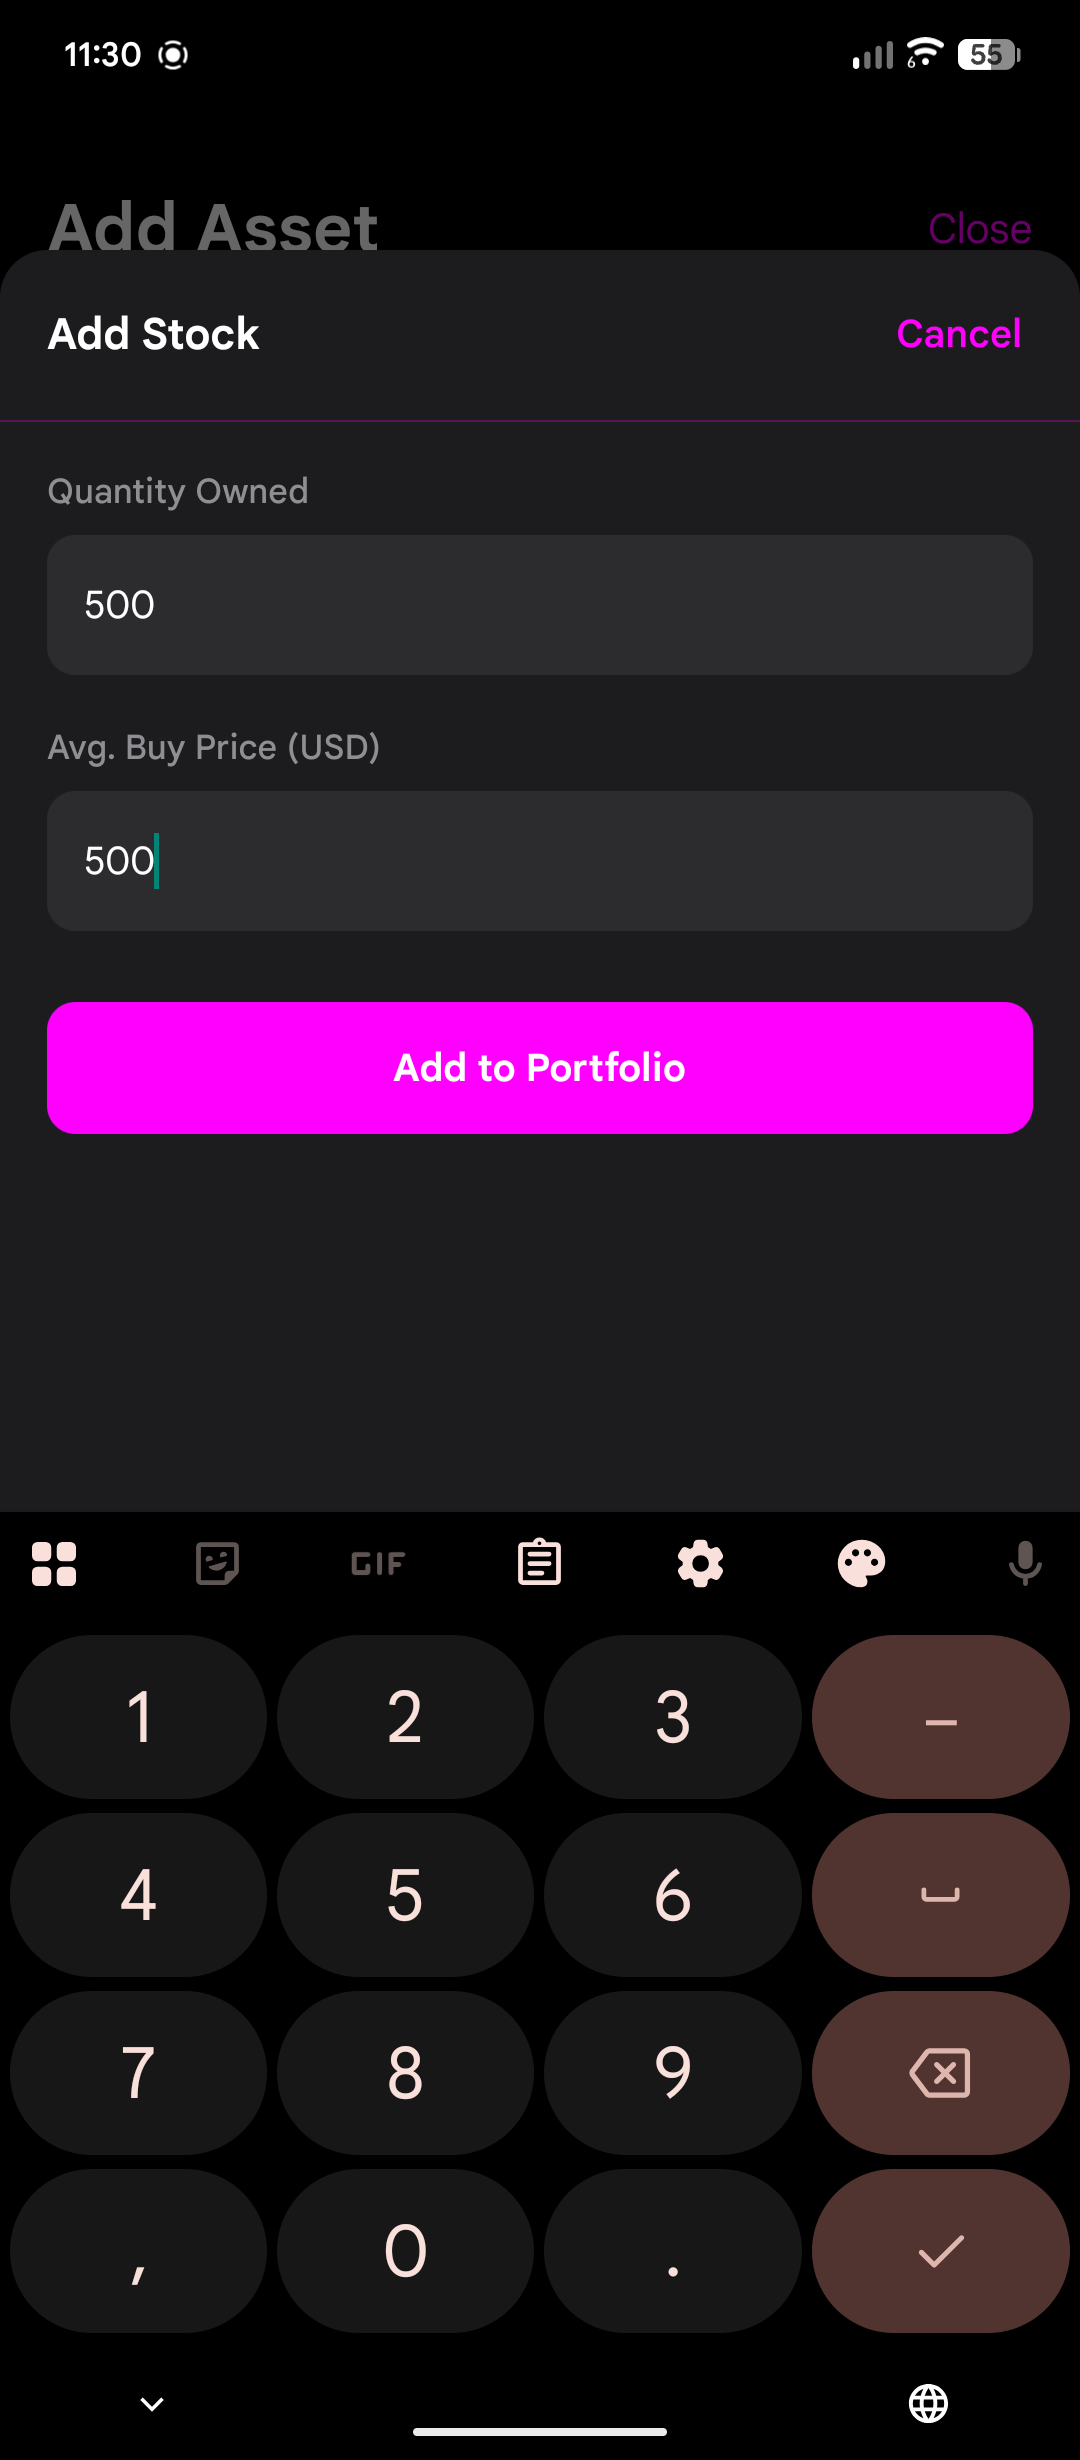
Keyboard adding assets
-

-
-

-
-


Inspiration
Investing can be overwhelming. Most people juggle multiple platforms — stocks, gold, funds, fixed income, real estate, and more — making it hard to get a clear picture of their overall portfolio. We wanted to create a single app where users can track everything at a glance, receive real-time price updates, set reminders for non-listed products, and get smart insights about risk and diversification. The goal was to simplify financial management and make investing more transparent.
What it does
Meluri Finance is a unified investment tracker that allows users to:
- Log all types of investments in one place.
- Receive real-time updates for listed assets.
- Set amortization and reminder alerts for non-listed assets.
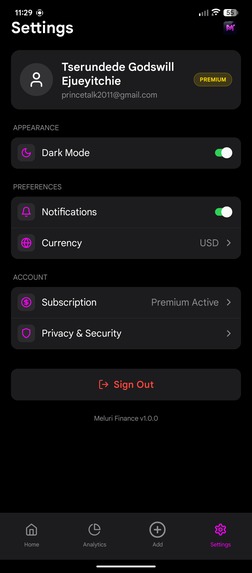
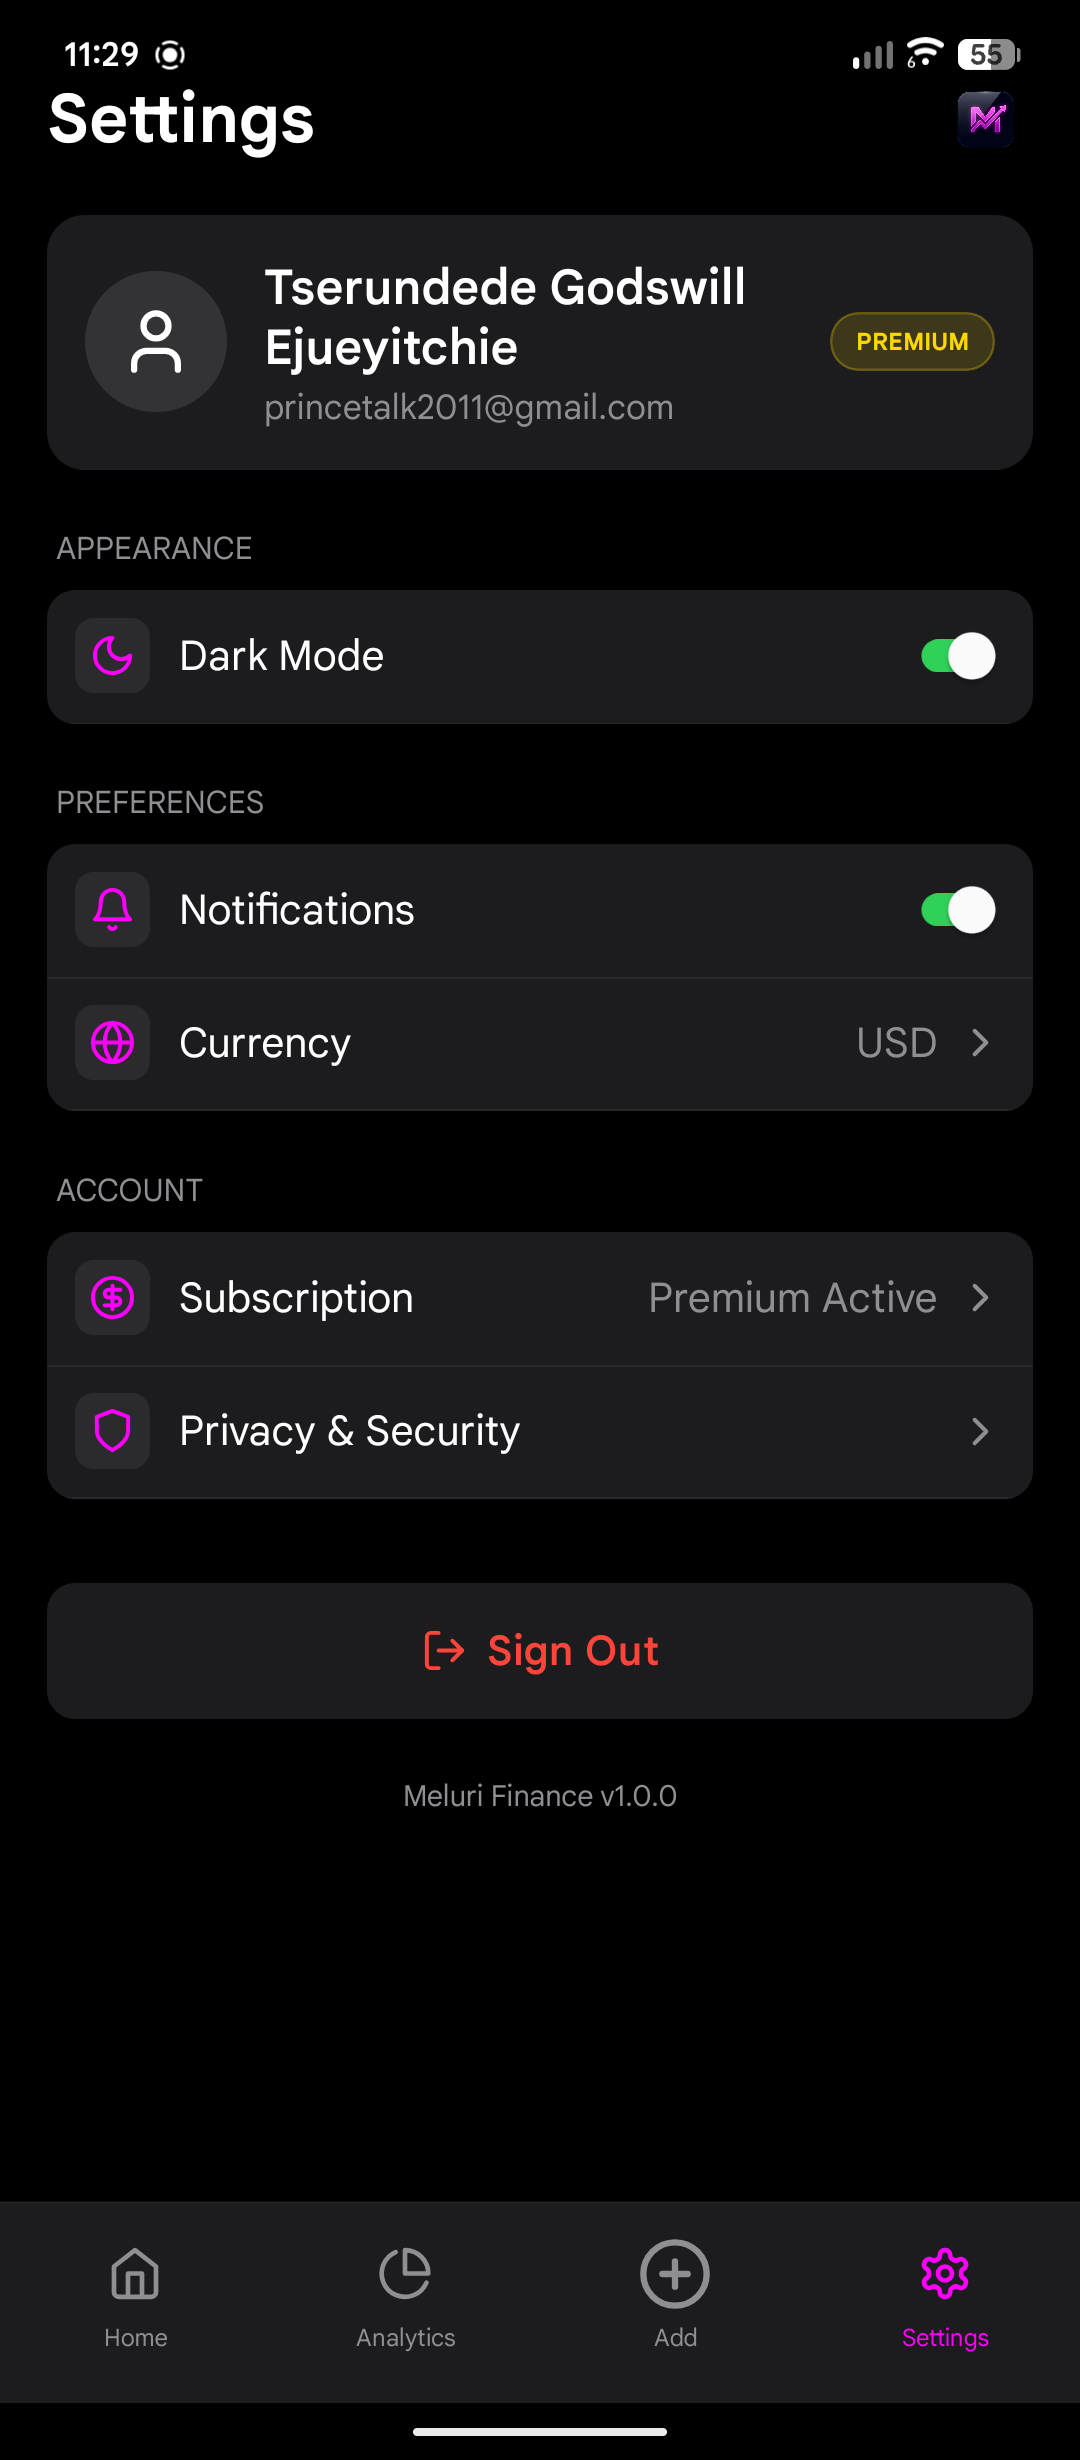
- Unlock premium analytics, including risk assessment and diversification insights, like sector and country exposure.
The app provides an intuitive dashboard where users can see their full financial picture instantly, helping them make informed decisions.
How we built it
The app was built using a modern tech stack:
- Frontend: React Native for cross-platform mobile support
- Backend: Node.js with Express for API handling
- Database: PostgreSQL for structured storage of portfolios and transactions
- APIs: Integrated financial market APIs to fetch live prices for stocks, gold, and funds
- Analytics: Implemented risk metrics and diversification analysis using Python and NumPy/Pandas, including calculations like portfolio variance:
[ \sigma_p^2 = \sum_{i=1}^{n} w_i^2 \sigma_i^2 + \sum_{i \neq j} w_i w_j \text{Cov}(r_i, r_j) ]
where (w_i) is the weight of asset (i), (\sigma_i^2) its variance, and (\text{Cov}(r_i, r_j)) the covariance between assets.
Challenges we ran into
- Data Integration: Combining live market data with manually tracked assets required careful database design.
- Real-Time Updates: Ensuring fast, accurate updates for multiple asset types was tricky, especially for non-listed assets.
- Analytics Complexity: Calculating meaningful risk and diversification metrics that were easy for users to understand took iterative testing.
Accomplishments that we're proud of
- Created a single, unified dashboard for all investment types.
- Successfully integrated real-time market data with non-listed asset tracking.
- Developed premium analytics that clearly show risk and diversification across sectors and countries.
What we learned
- Handling mixed asset types in a single dashboard taught us the importance of a flexible data model.
- Building user-friendly financial analytics reinforced the value of simplicity in design.
- Integrating real-time APIs showed how crucial efficiency is when handling live data streams.
Built With
- coingecko
- finnhubapikeys
- firebase
- firestore
- react-native
- revenuecat

Log in or sign up for Devpost to join the conversation.