-
-
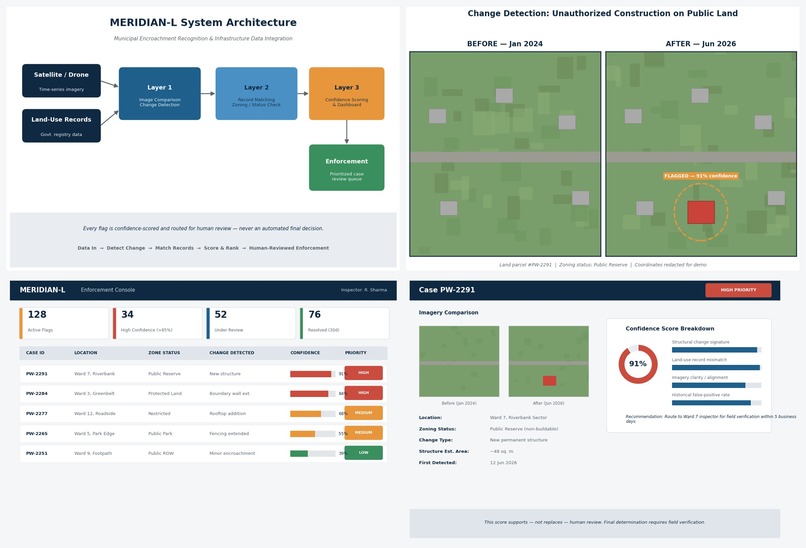
MERIDIAN-L's full pipeline: change detection, architecture, dashboard, and case review.
Inspiration
Every city has land that's supposed to be protected — parks, riverbanks, government reserves, footpaths, public parks — but somehow it keeps shrinking. Talking to people who've dealt with municipal offices, a pattern kept coming up: land encroachment is rarely caught in real time. Someone builds an illegal extension, a wall creeps a few feet further each year, or a plot marked "public" quietly becomes private — and it's often not discovered until a dispute, an audit, or a scandal forces someone to look. Manual land surveys happen once every few years if that, and with limited inspectors covering huge areas, most violations simply slip through.
We kept asking: land use changes visibly — so why isn't anyone watching continuously? Satellite and drone imagery already exists and gets updated regularly. The missing piece wasn't data, it was a system connecting that data to enforcement action. That gap became the seed for MERIDIAN-L.
What it does
MERIDIAN-L compares satellite/drone imagery of a location across two time points — say, one year ago and today — and automatically detects structural changes: new construction, extended boundaries, or land-use shifts. It then cross-references those changes against official land-use records to check whether the change is happening on land marked as public, protected, or restricted.
Every flagged case is given a confidence score rather than a binary verdict, because we didn't want to falsely accuse anyone — the system surfaces likely violations for human review, not automatic judgment. Enforcement teams get a prioritized dashboard, ranked by confidence and severity, instead of manually reviewing complaint tickets or waiting for the next survey cycle.
How we built it
We split the system into three layers:
Image comparison layer — using image-differencing and change-detection techniques (OpenCV-based pixel/structure comparison, with more advanced approaches like a pretrained segmentation model to identify built structures vs. vegetation vs. empty land) to isolate what changed between two time-stamped images of the same coordinates. Record-matching layer — a lookup service that takes the flagged coordinates and checks them against a structured (simulated, for demo purposes) land-registry dataset to determine the land's designated status. Scoring and dashboard layer — a simple web dashboard that lists flagged locations, their confidence scores, before/after image pairs, and land-status context, so an inspector can review and act quickly.
For the hackathon build, we used publicly available satellite imagery samples and a synthetic land-record dataset to simulate a realistic municipal environment, since real government land databases aren't publicly accessible.
Challenges we ran into Image alignment: satellite images from different dates aren't always captured at the same angle, resolution, or lighting condition, which made naive pixel-diffing produce a lot of false positives. We had to normalize and align images before comparing them. Avoiding false accusations: early versions flagged almost anything that changed, including harmless changes like tree growth or seasonal variation. We had to iterate on the confidence-scoring logic to distinguish "structural" changes (new construction) from natural or non-structural changes. Lack of real data: government land-use records aren't openly available in a clean format, so we had to construct a realistic synthetic dataset that still demonstrated the full pipeline convincingly. Balancing automation with human oversight: we deliberately avoided designing the system to make final legal determinations — encroachment has real legal and human consequences, so the confidence-score-plus-human-review model took real design discussion to get right. Accomplishments that we're proud of Building a working end-to-end pipeline — image comparison → record matching → confidence scoring → dashboard — within the hackathon timeframe. Designing the system to be a decision-support tool, not an automated judge, which we believe is the more responsible and realistic path to real-world government adoption. Creating a demo that clearly shows the "before vs. after vs. flagged" story in under a minute — something a policymaker or judge could understand instantly. What we learned
We learned a lot about the practical messiness of remote-sensing data — real-world imagery is noisy, inconsistent, and rarely as clean as demo datasets suggest. We also learned how important it is, when building any tool meant for government enforcement, to design for transparency and appeal-ability — every flag needs to be explainable and reviewable by a human, not just a black-box score.
What's next for Project MERIDIAN-L Integrating with real open satellite data sources (e.g., Sentinel-2, publicly available drone survey data) for more robust testing. Partnering with a municipal body for a pilot in a small ward or district to validate real-world accuracy. Adding a citizen-facing transparency layer, so flagged cases (once verified) become part of a public accountability record. Building appeal and review workflows, so property owners can contest a flag with documentation before any enforcement action is taken.

Log in or sign up for Devpost to join the conversation.