-
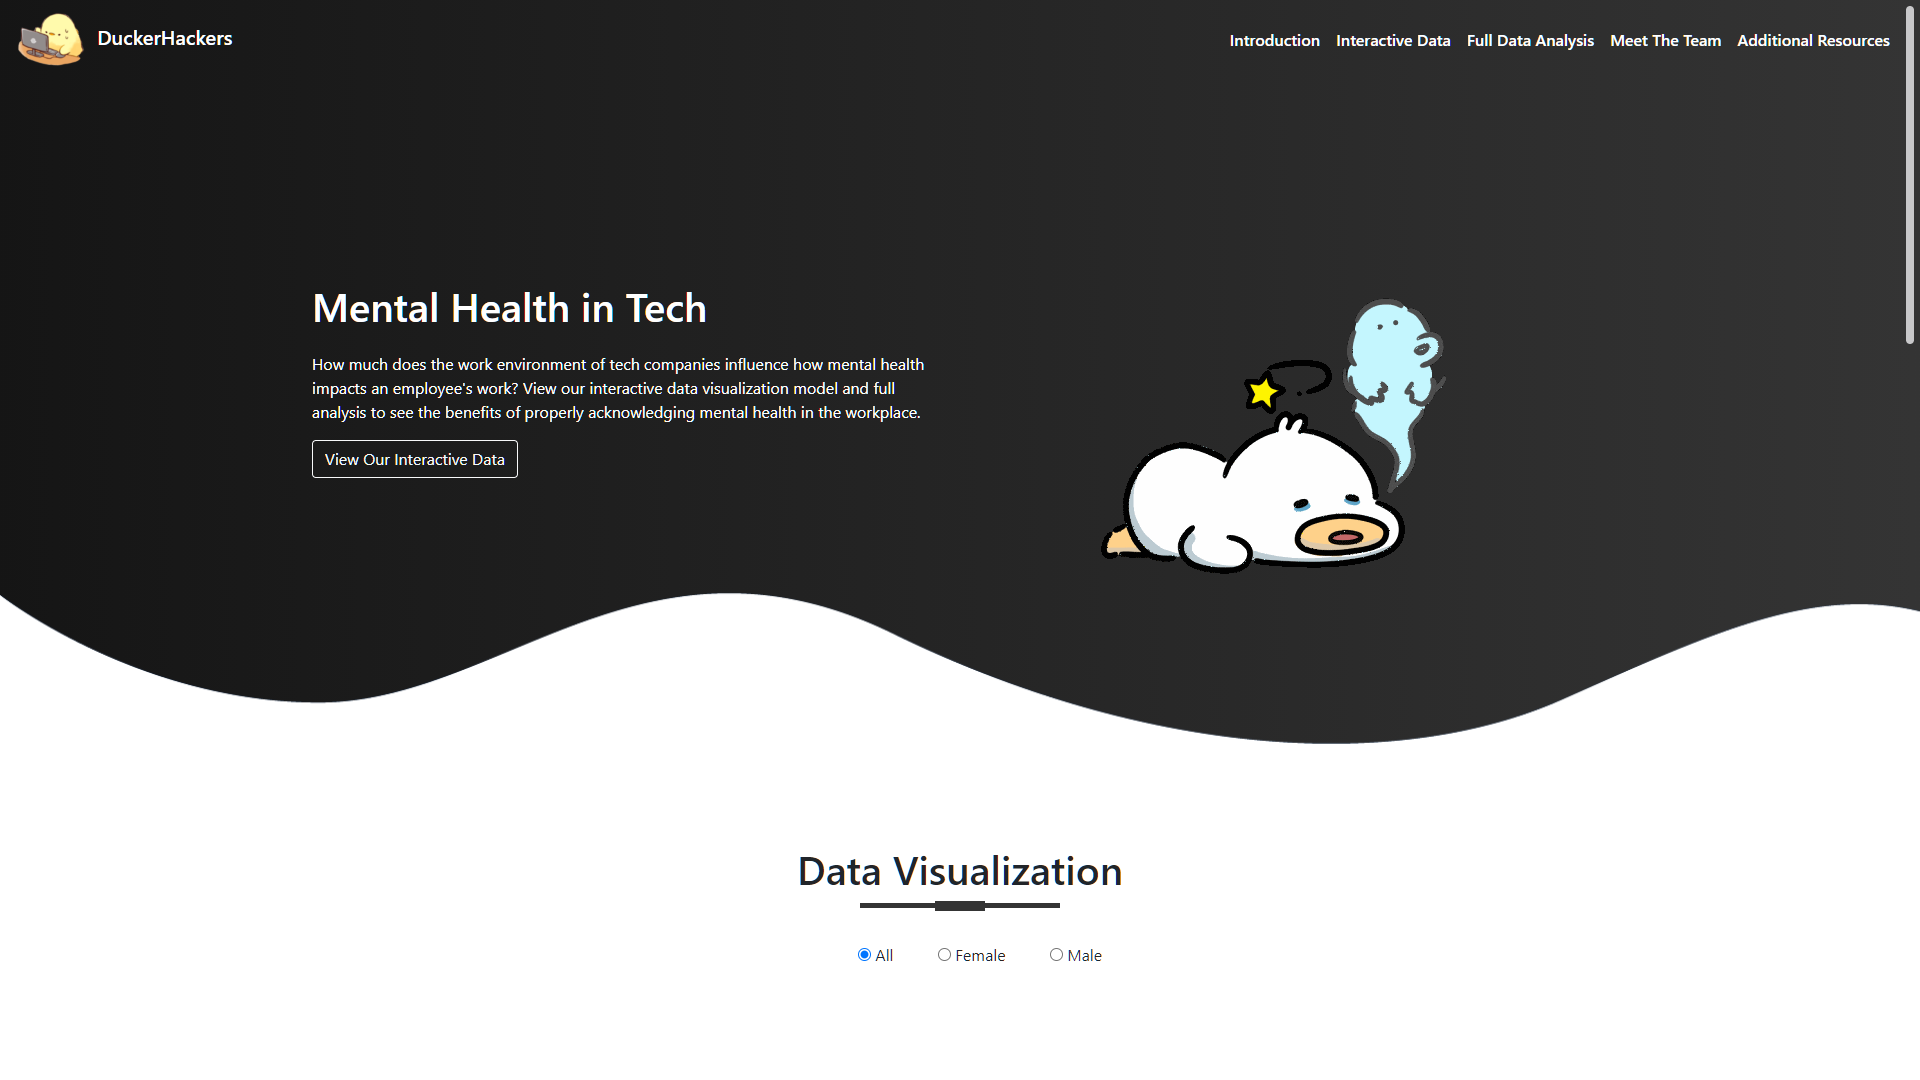
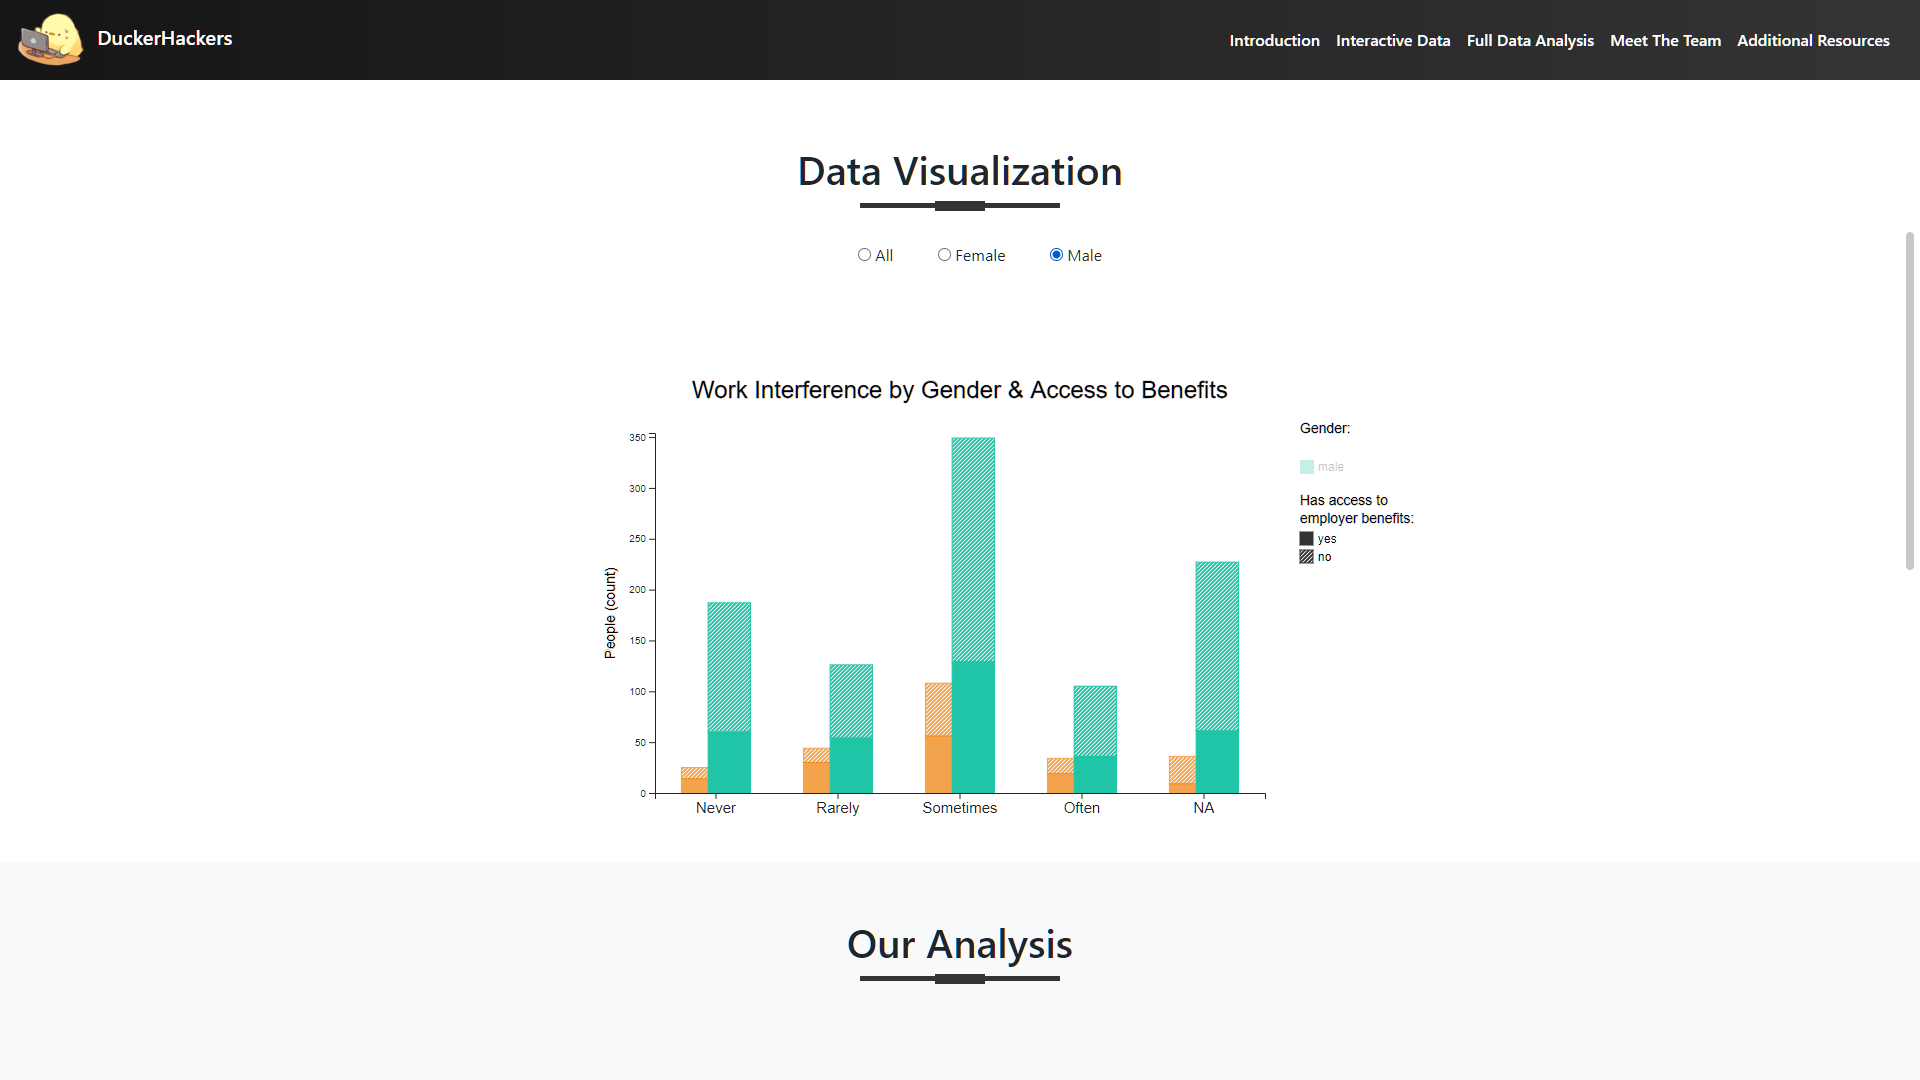
Home Page of Website
-
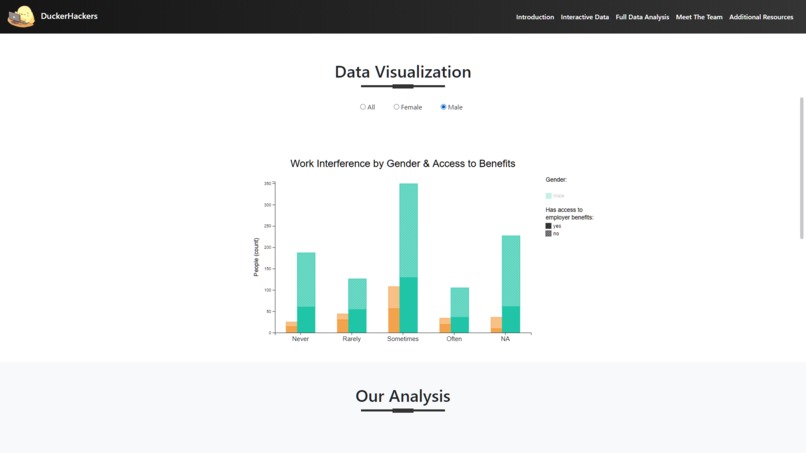
Interactive Data Model (On the Website)
-
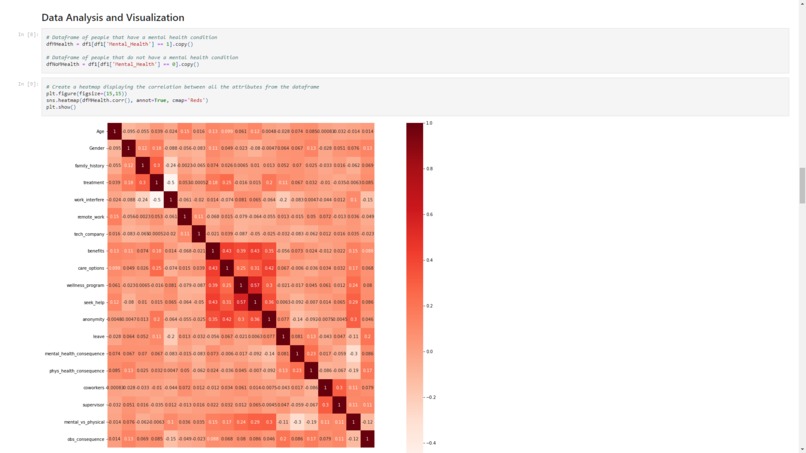
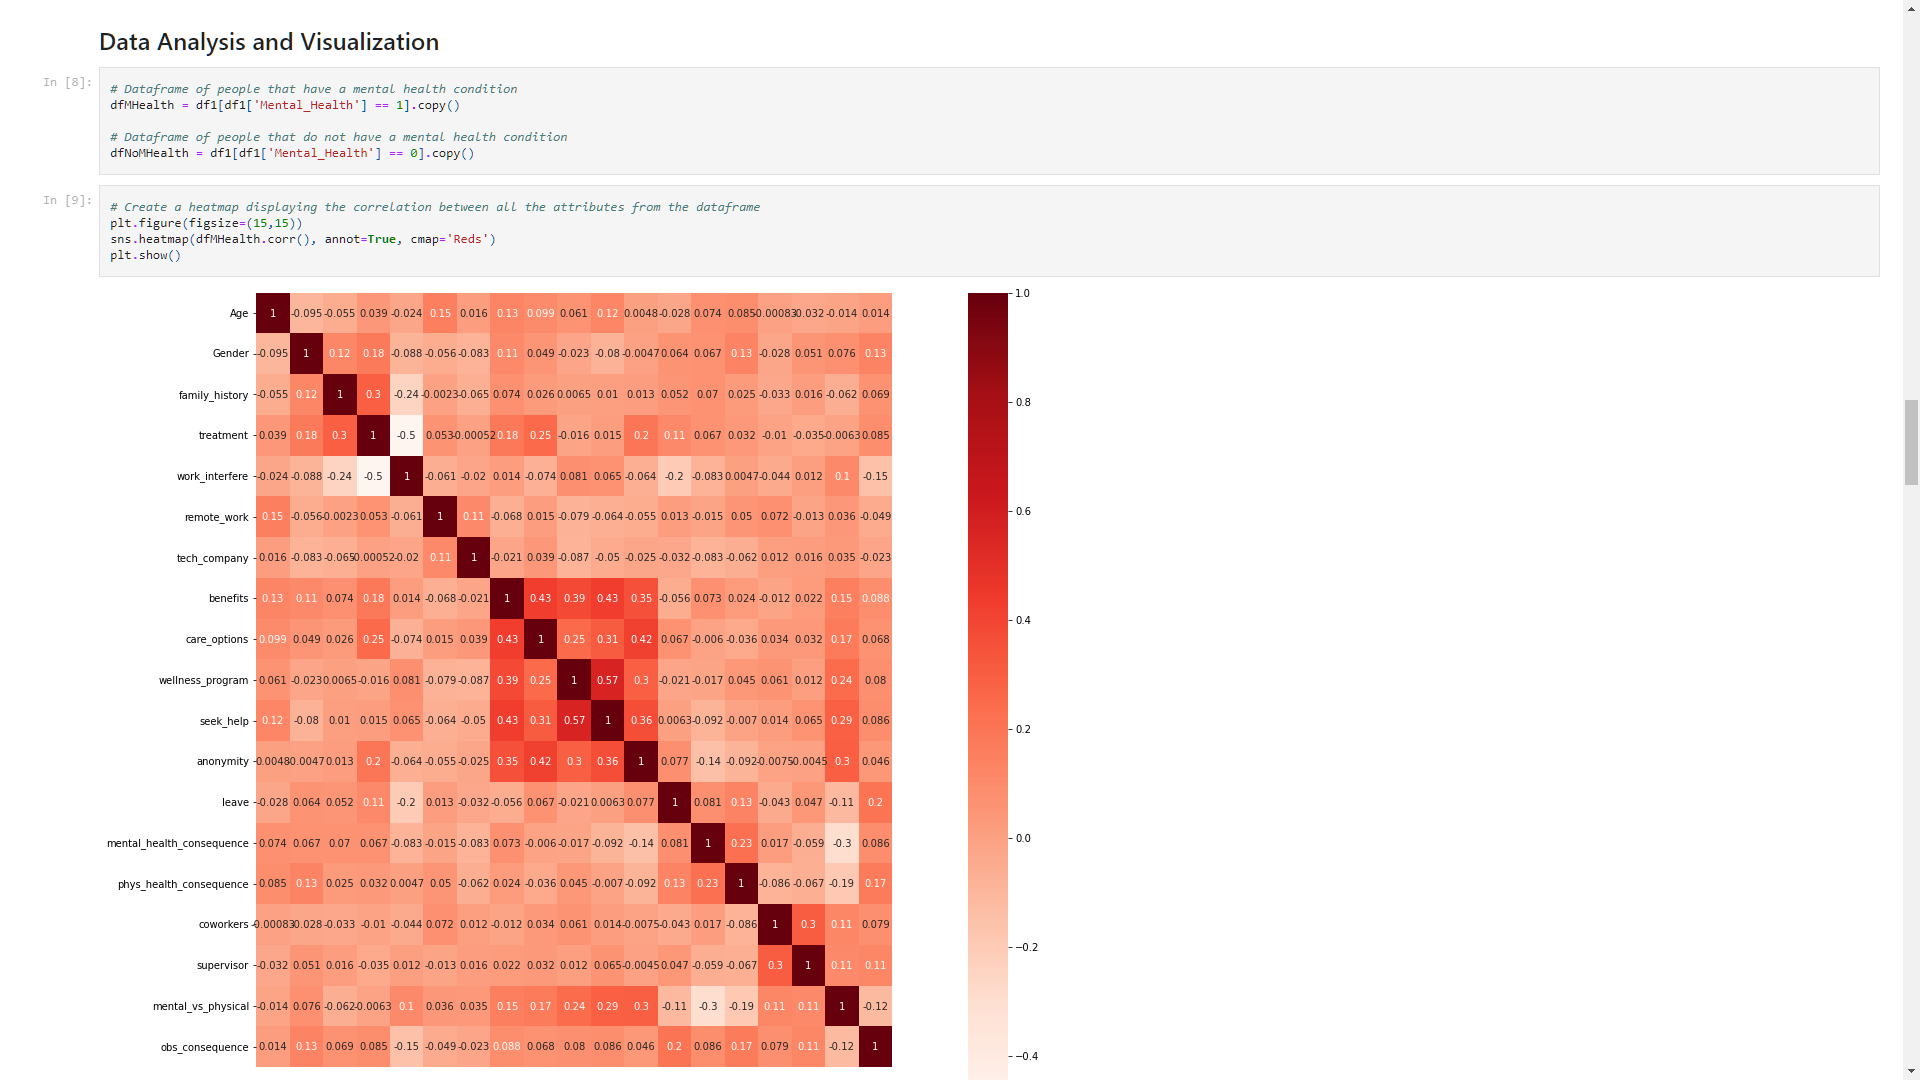
Jupyter Notebook Capture of First Analysis Model
HackDuke 2021 (Code For Good) - Health Track Submission
Inspiration
When looking through the different tracks, our team decided that our goal was to find a dataset among the hundreds of millions on the internet that had the potential to make an impact on the world, and give it the attention it deserves. When we came across the Survey on Mental Health in the Tech Workplace in 2014 published by the group, Open Sourcing Mental Illness, that hidden potential immediately started to show. From there, our team immediately went to work and began to tidy the data before jumping headfirst into the analyses. Our result is our fully documented Jupyter Notebook.
The inspiration for the overall website which houses our project was the idea to display one main piece of information as a interactive model that allows the user to easily view an important statistic. Although the majority of our analysis is within the Jupyter Notebook, the goal of the website was to convey the current situation of mental health in the technology field even without opening the Jupyter Notebook.
What it does
The Website: Provides an overview of our project in addition to an interactive data mo del that shows the relationship of how often employees are interfered at work depending on their gender, as well as their access to health benefits that include mental health within them. The website also provides a way to navigate to the full Jupyter Notebook analysis.
The Notebook: Includes our team's full exploratory data analysis on the 2014 survey data and is comprised of multiple regression models, statistical prediction tests, and a variety of graphs to best represent certain relations between variables. The goal of this analysis is to clearly show the advantages that employers are losing if they are not adequately acknowledging mental health in their workplace. We believe that seeing these advantages in clear, numerical values will result in more companies in the technology field to grow and recognize the importance of accommodating for mental health issues. All of these goals come together in our ultimate hope that one day, all technology workplaces will grow to be a safe and inclusive place for everyone.
How we built it
The Website: The website was built from the ground up using HTML, CSS, and several snippets from Bootstrap. The design of the website was a mix of individual team design and inspiration from an online resource that provided the fundamentals for learning HTML and CSS for this project. The website itself is hosted on a stand-alone GitHub page.
The Interactive Graph: This interactive graph was created from the ground up using d3.js as the core language to design and build the model. This graph was then added within the HTML code of the website to be displayed.
The Notebook: The Python Jupyter Notebook utilized the pandas, seaborn, numpy, matplotlib, statsmodel, and scikit learn libraries throughout all of the analysis. All of the data was first tidied and then sorted into a dataframe that contained the specific sample that would be focused on during each analysis. Depending on the variables being analyzed, various models and graphs would be generated, followed by a text description of each analysis.
Challenges we ran into
One of the main challenges that we expected to run into (and ended up doing so) during this project is identifying specific variables within the data set that would convey the most impact through certain analyses. In order to overcome this obstacle, our team all sat down and took turns pointing out observations we found within the dataset as a whole. Through our conversations, we were able to identify correlations that ended up supporting our goal of finding data that shows the benefits of acknowledging mental health in the technology workplace environment.
Accomplishments that we're proud of
For the team members who worked on the website, their favorite accomplishment was getting the interactive d3.js graph to look proper and function properly after being translated to the website. Seeing the finished product of the website was another major accomplishment.
Similarly, for the team members who worked on the Notebook analysis, their most proud accomplishments were seeing relations that supported our hypothesis, as well as seeing the final product of the notebook as a whole. Having all the documentation within the notebook finally finished was a big moment of celebration for us all.
What we learned
Every team member gained a significant amount of experience after working with their aspect of the project. The team member who worked with HTML and CSS got a much better understanding of how a website is built (even with the use of online tutorials and resources).
The d3.js team member grew even more familiar with creating interactive visualizations using the D3 JavaScript library, including discovering Riccardo Scalco's handy textures.js library for SVG patterns, and even improved their HTML and CSS skills while inserting the graph into the web page.
The Notebook team members both gained a lot of experience with exploratory data analysis in Python, including visualizing the data, generating regression models, and determining whether a hypothesis has the statistical support behind it or not.
What comes next?
There is more analysis to be done using additional data sets that support our mission to make the technology workplace a more inclusive space, especially regarding mental health. Our team hopes to continue our process of using data to present clear proof as to why companies should acknowledge mental health in the workplace. As the team's experience with data analysis grows, we hope to expand into even more rigorous analysis methods.
Resources Referenced
- d3.js: https://github.com/d3/d3
- textures.js: https://github.com/riccardoscalco/textures
- smooth-scroll.js: https://github.com/cferdinandi/smooth-scroll


Log in or sign up for Devpost to join the conversation.