-

Main Page
-

Working on our model
Inspiration
We wanted to create something educational about mental health in the tech industry, so we decided to explore some datasets and create a project based on what we found.
What it does
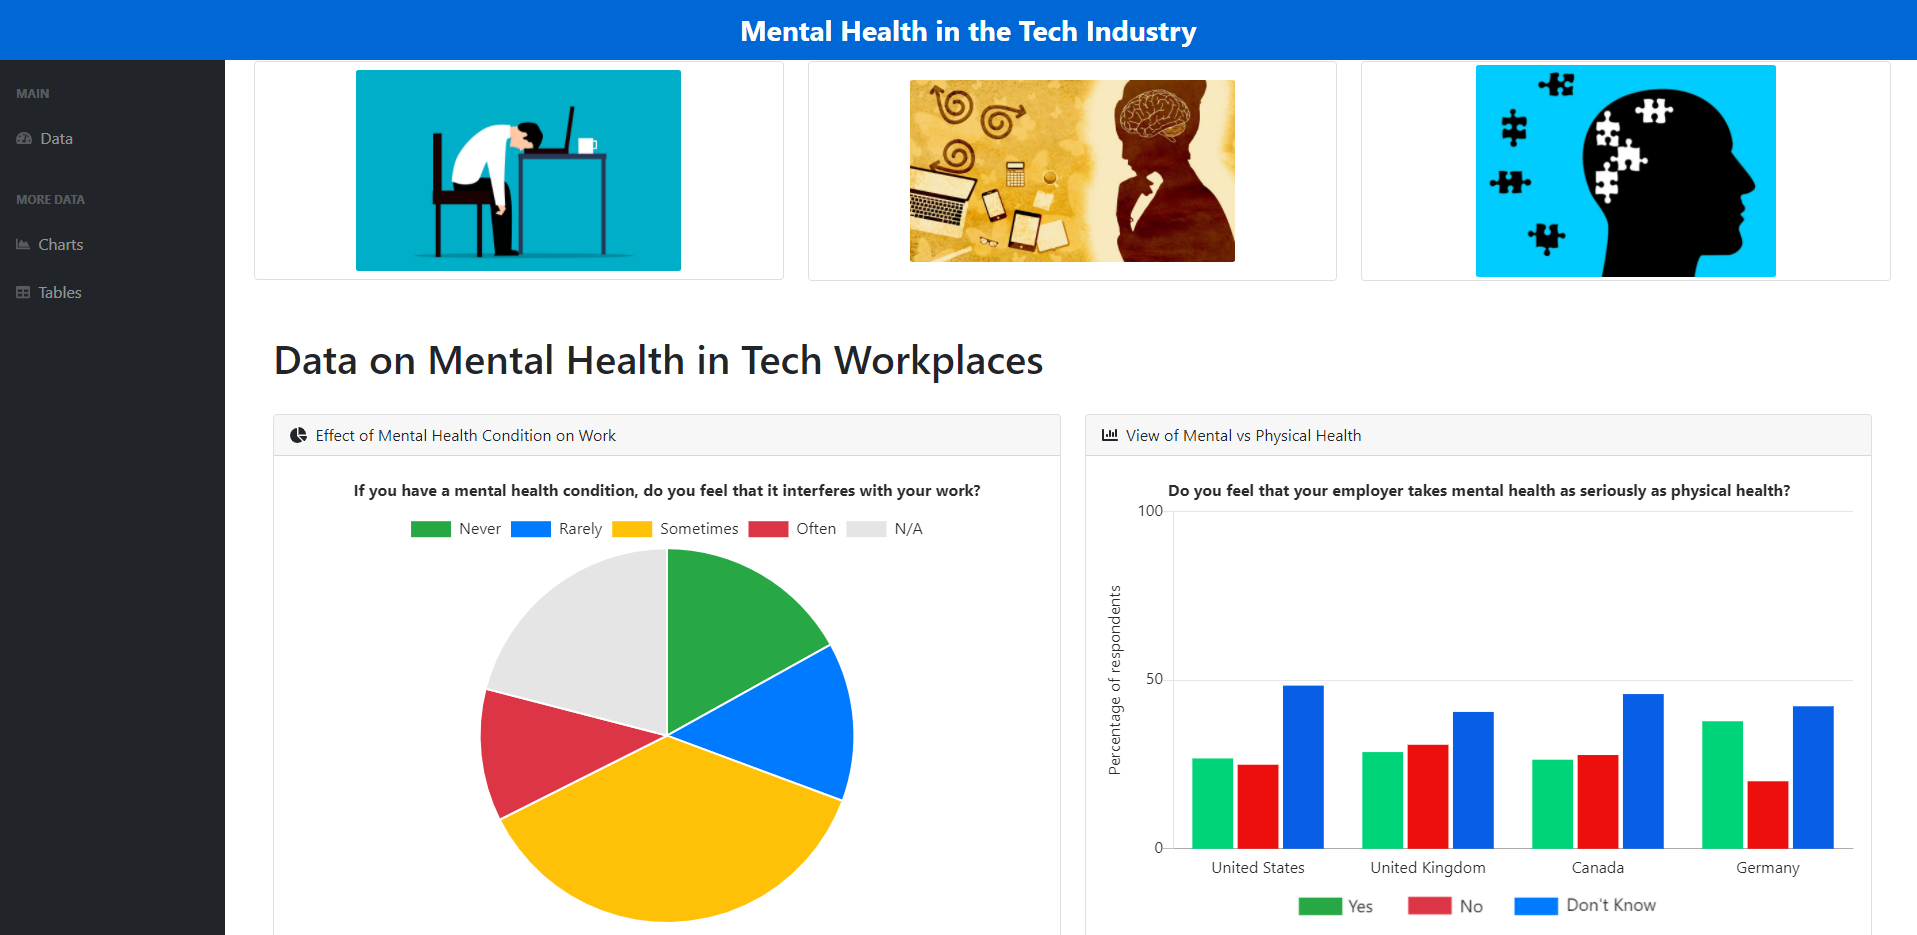
Our website visualizes data on mental health in the tech industry. The goal is to present information about mental health in an easy-to-understand format and promote further support for workers' mental health.
How we built it
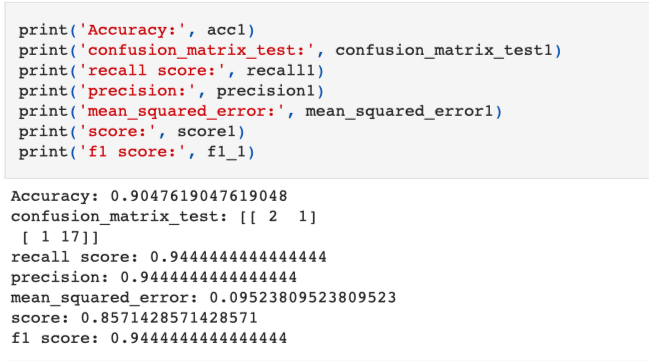
We used Python to analyze this dataset, then we used Chart.js to create various graphs to visualize the data. We also used scikit-learn to create a model that would predict whether a person would seek treatment for a mental health condition, based on various factors such as gender, family history, and how much the condition interferes with their work.
Challenges we ran into
We had trouble integrating the model with a web app, so unfortunately the website currently does not have a tool that can make predictions based on user inputs.
Accomplishments that we're proud of
We're proud of creating something educational about mental health.
What we learned
We learned how to use Chart.js, as well as strategies for building a machine learning model.
What's next for Mental Health in the Tech Industry
The next step is to integrate our model with a web app, so users can interactively see how different factors can affect people's decisions to seek treatment for a mental health condition. We also plan on adding more graphs.


Log in or sign up for Devpost to join the conversation.