Inspiration
Inspired by the Connecting Communities theme and the Healthcare Hack challenge, I wanted to create a project that sheds light on an area that resonates with college students in tech majors across the world: mental health in the tech industry.
What it does
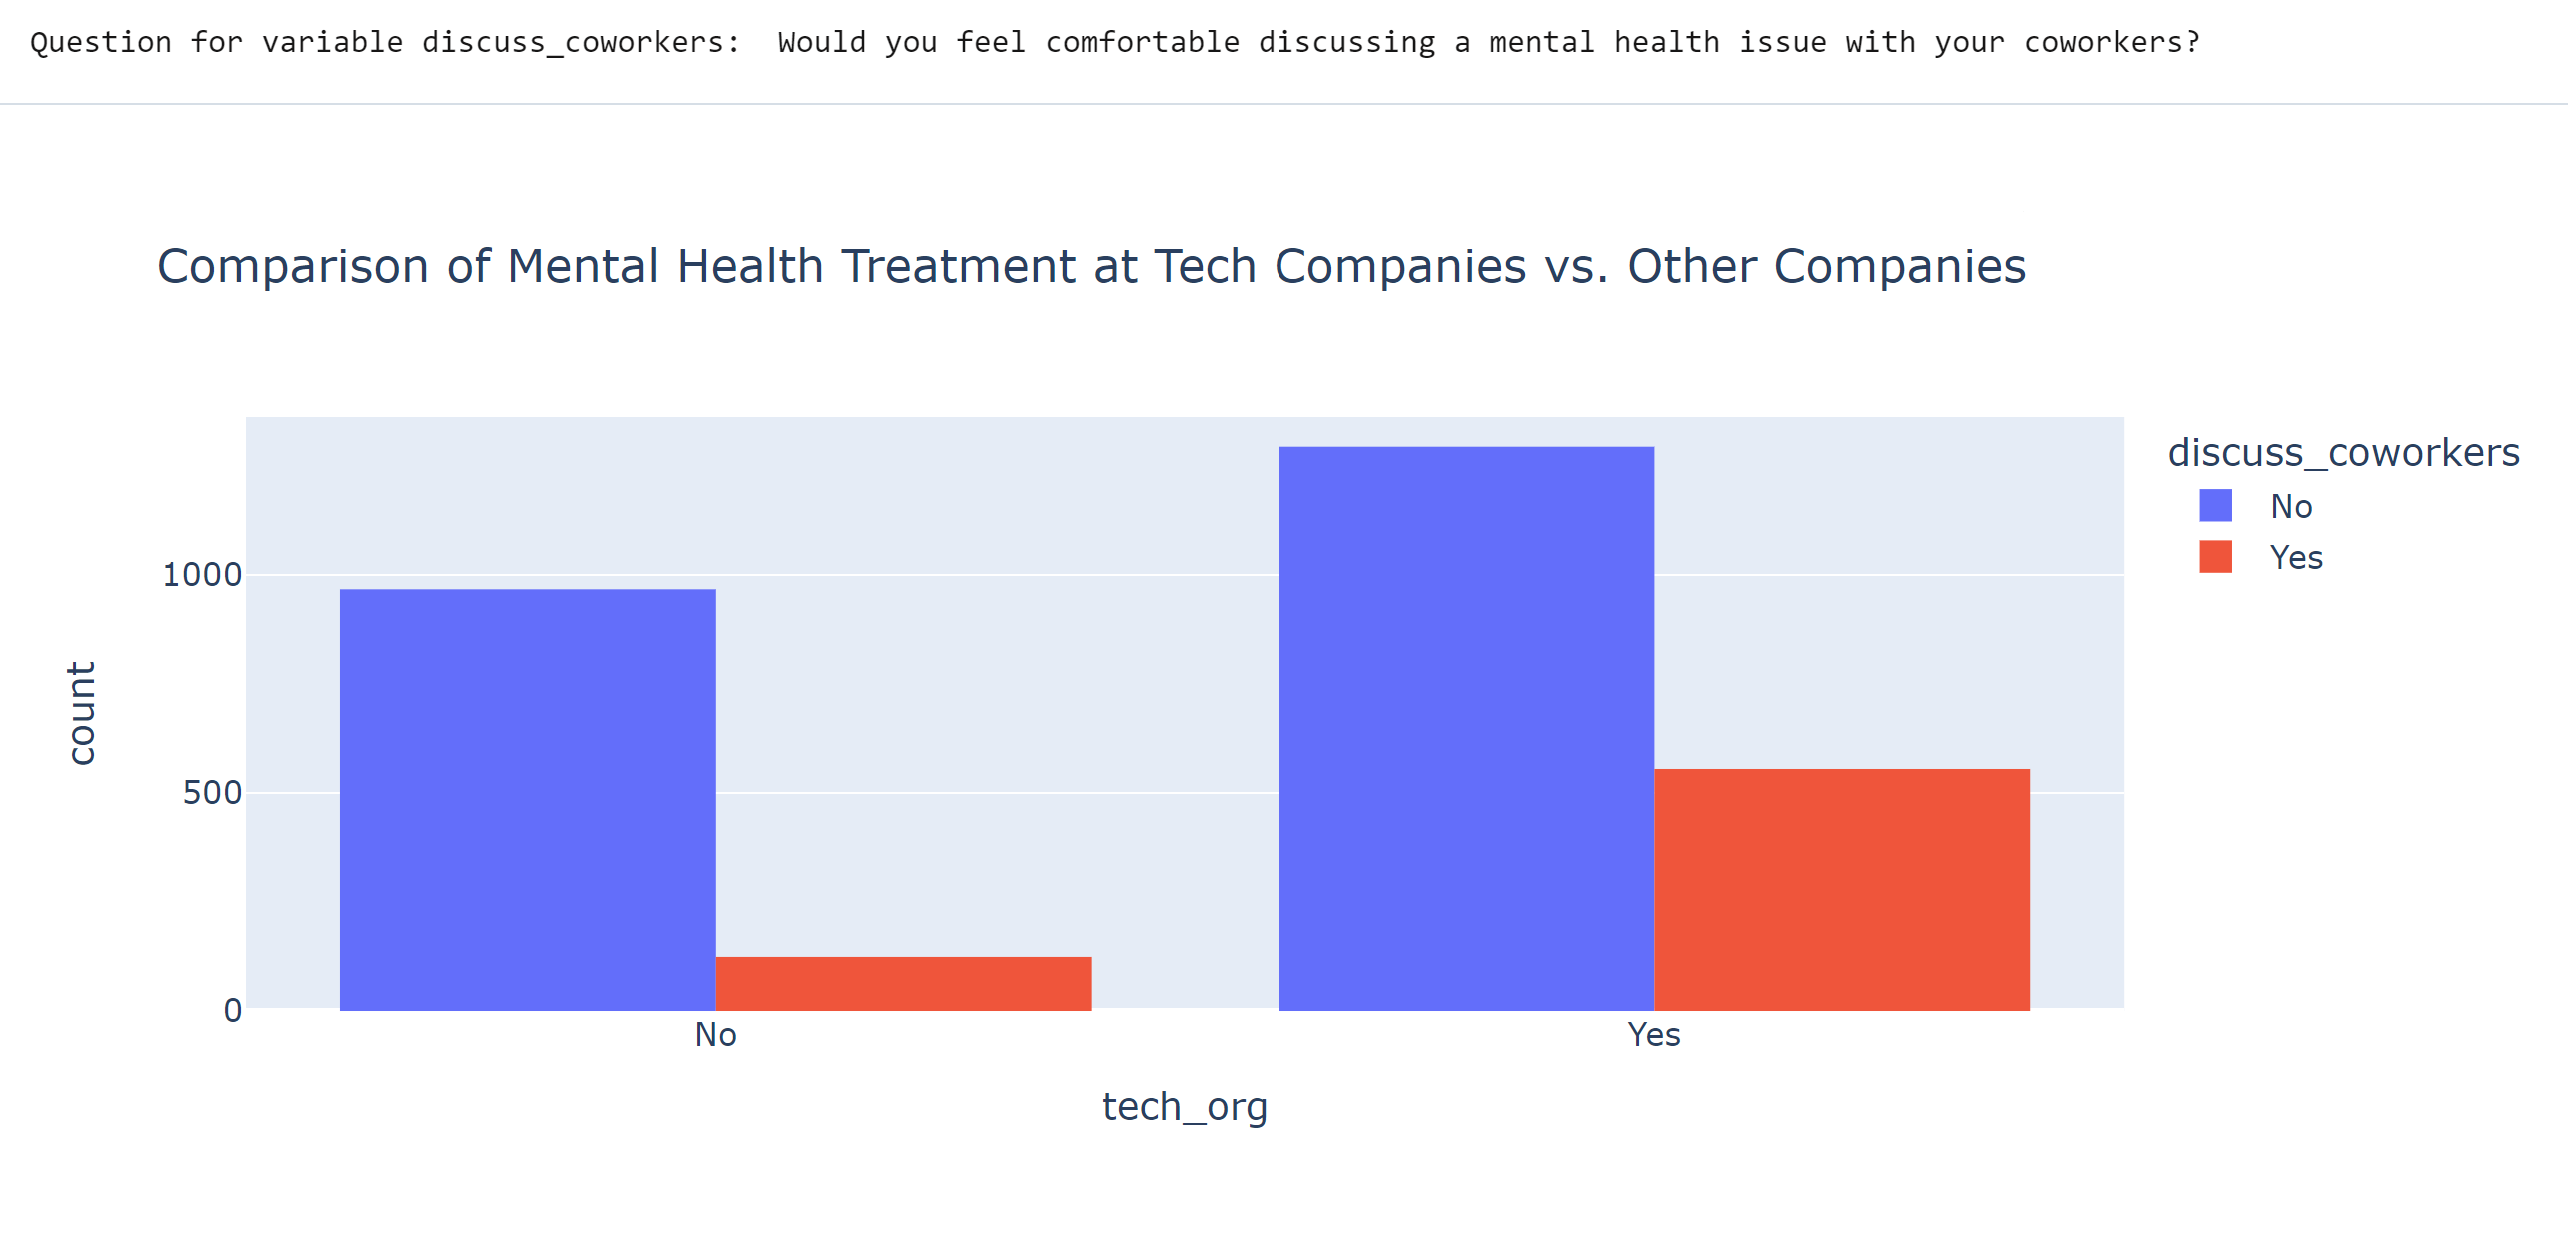
The notebook and dashboard walk through the data retrieval and cleaning process of collecting data from 4 years' worth of OSMI (Open Sourcing Mental Illness) survey data on mental health in the tech industry. Following the preprocessing, there are visualizations that showcase insights on how companies fare when it comes to their attitudes towards their employees' mental health.
How I built it
This project was built using Deepnote, taking advantage of their amazing notebook and data visualization software. The data source I used was a SQLite database, so I first used Pandas to retrieve the data, join the three provided SQL databases, and then convert the data into a DataFrame. Then, I used Plotly to create data visualizations and used Deepnote's Publishing editor to create a dashboard with them. Finally, I wanted to try and build a classifier that could identify the likely predictors of whether someone does or doesn't seek out mental health treatment. I first used scikit-learn to train and evaluate a baseline Logistic Regression model. I then took the modeling process a step further by using Catboost to train more extensively and get more accurate predictions.
Challenges I ran into
I definitely had a hard time processing the data, because there were a lot of columns and wordy data to deal with, along with a lot of missing data. I also ran into issues using Plotly, but luckily I was able to resolve them reasonably quickly thanks to the extensive documentation.
Accomplishments that I'm proud of
I'm proud that I got to learn about Plotly and Deepnote and make a cool project with them in this short time! I also feel accomplished in the machine learning predictions I made as this dataset didn't seem to be originally formulated for a machine learning task, but I still had good performance on my validation and test set.
What I learned
Type-checking is as important in data science/analytics + machine learning as it is in software engineering, and looking at what your ML model is actually doing is important to understand the impact that the predictions have.
What's next for Mental Health in the Tech Industry
With more time, I would love to use the full dataset and include survey information from more recent years like 2020, and even 2021 if/when the data gets released. The effects of the COVID-19 pandemic on these results would be very interesting to analyze, with mental health in the workplace becoming a much more prevalent topic across industries. I would also like to make some more complex graphs with the extra columns and see if any of them will have an effect on the ML model.

Log in or sign up for Devpost to join the conversation.