-
-
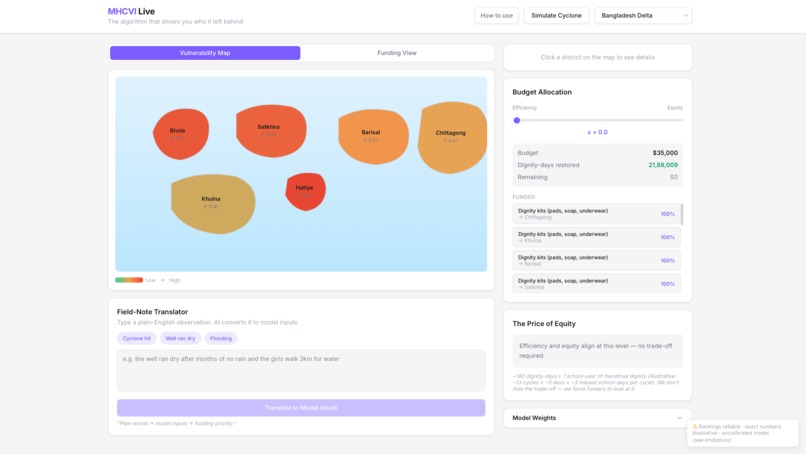
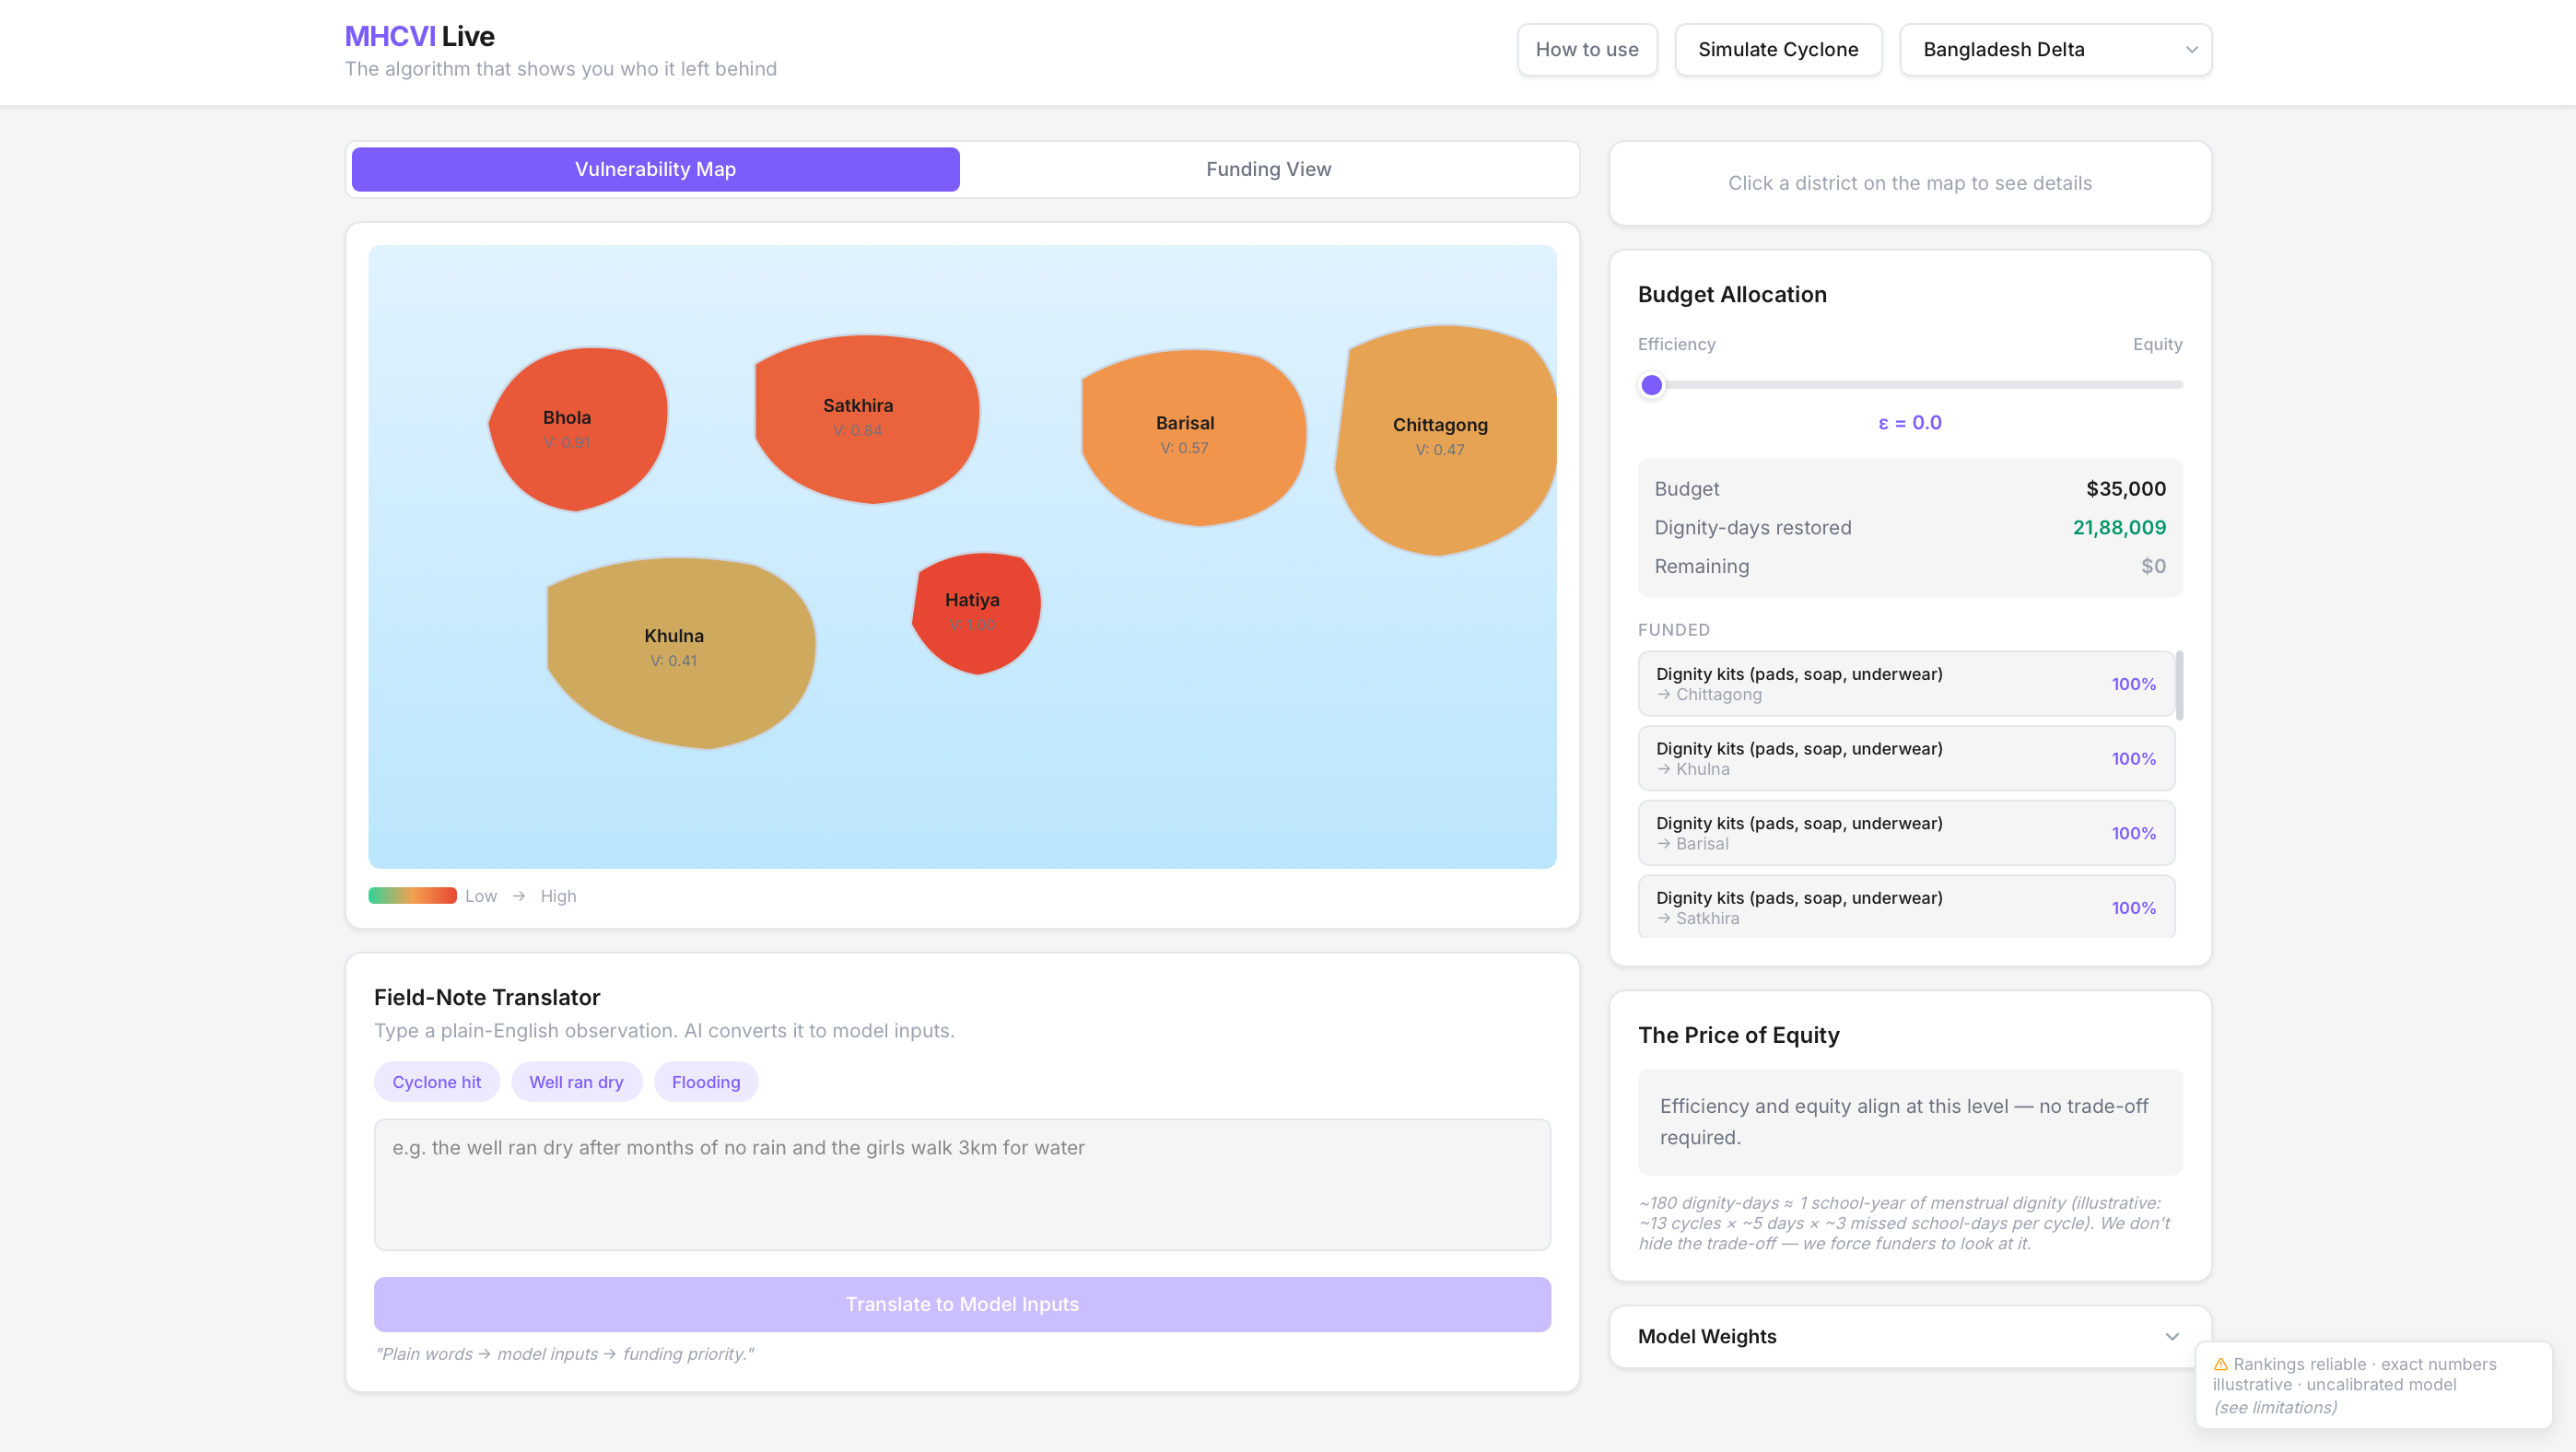
Community Vulnerability View
-
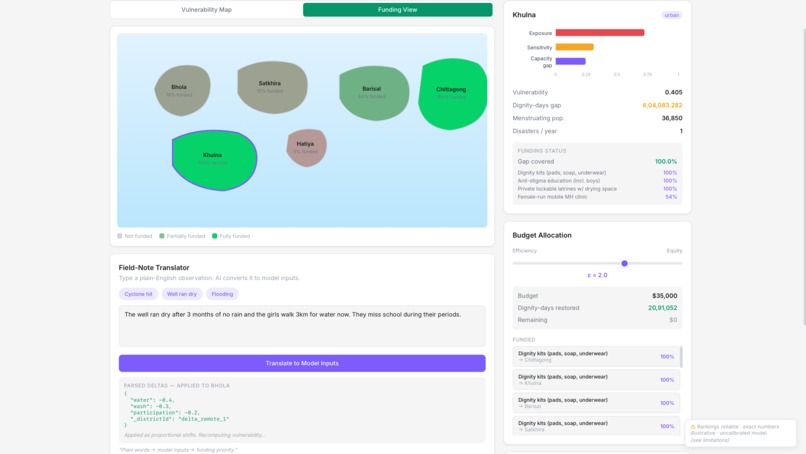
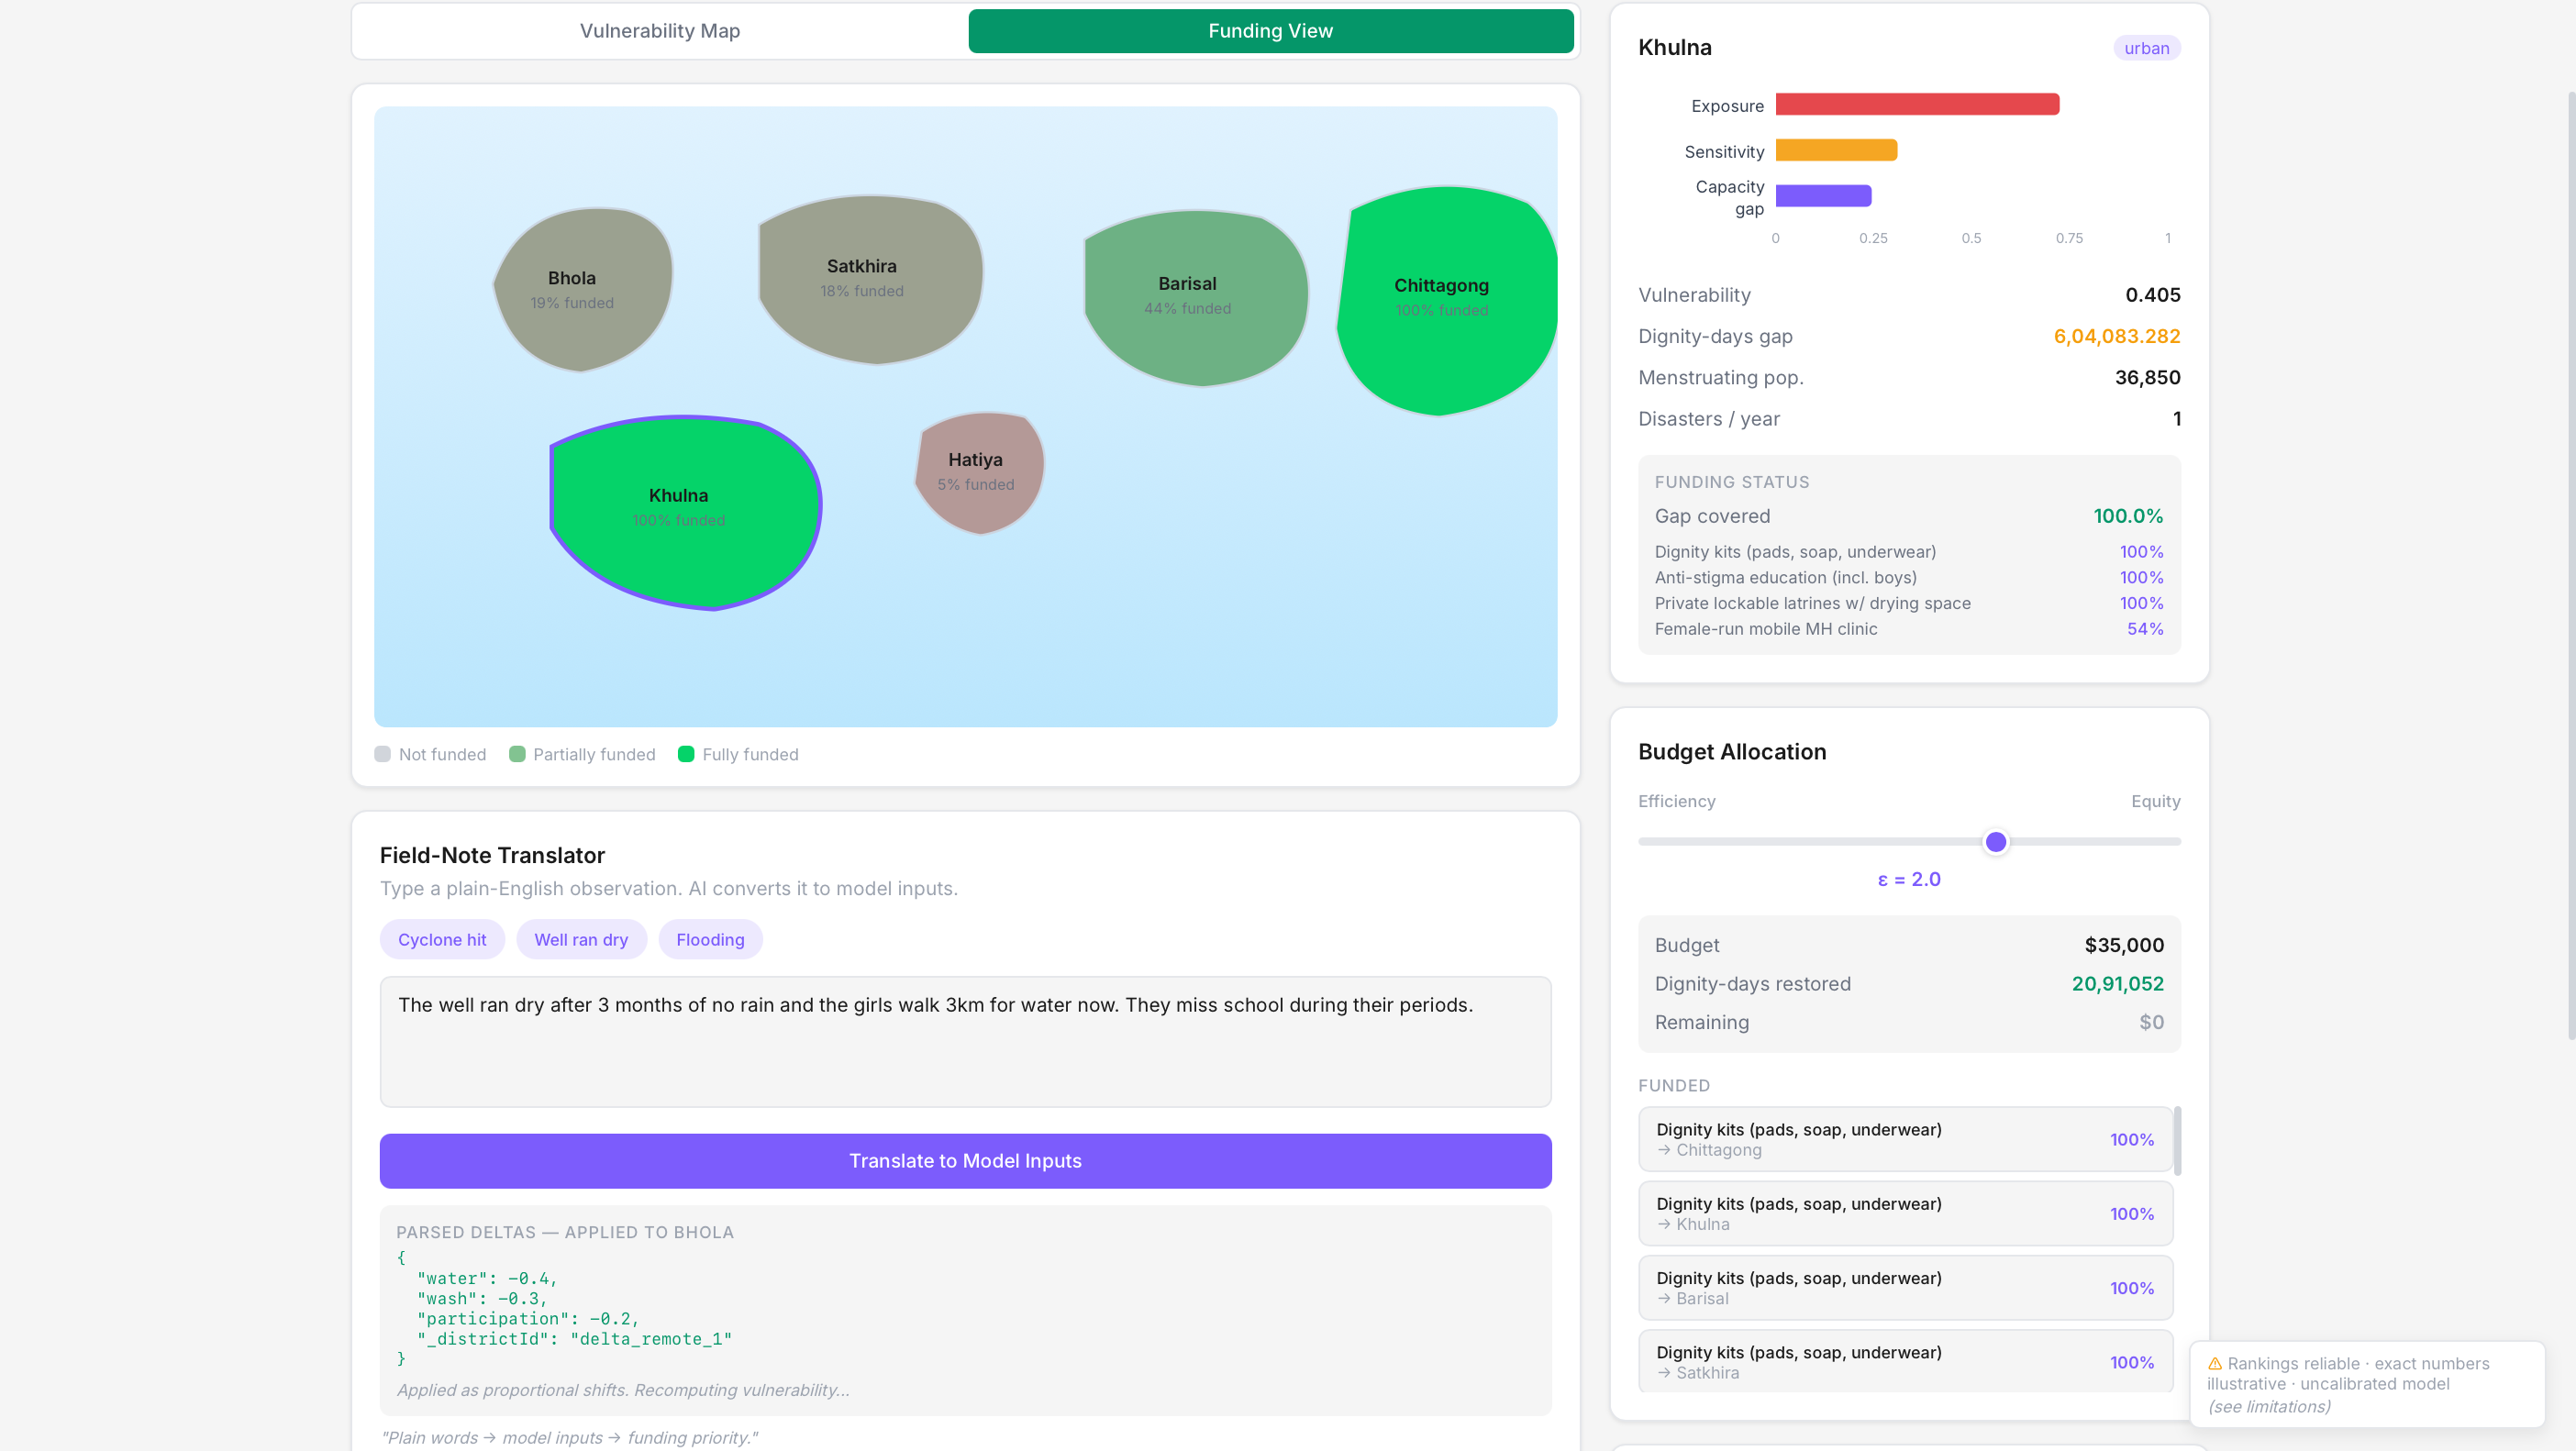
Community Funding View
-
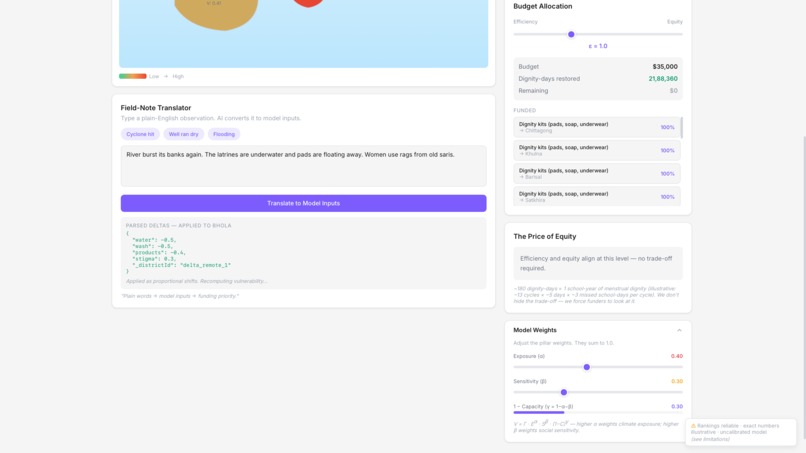
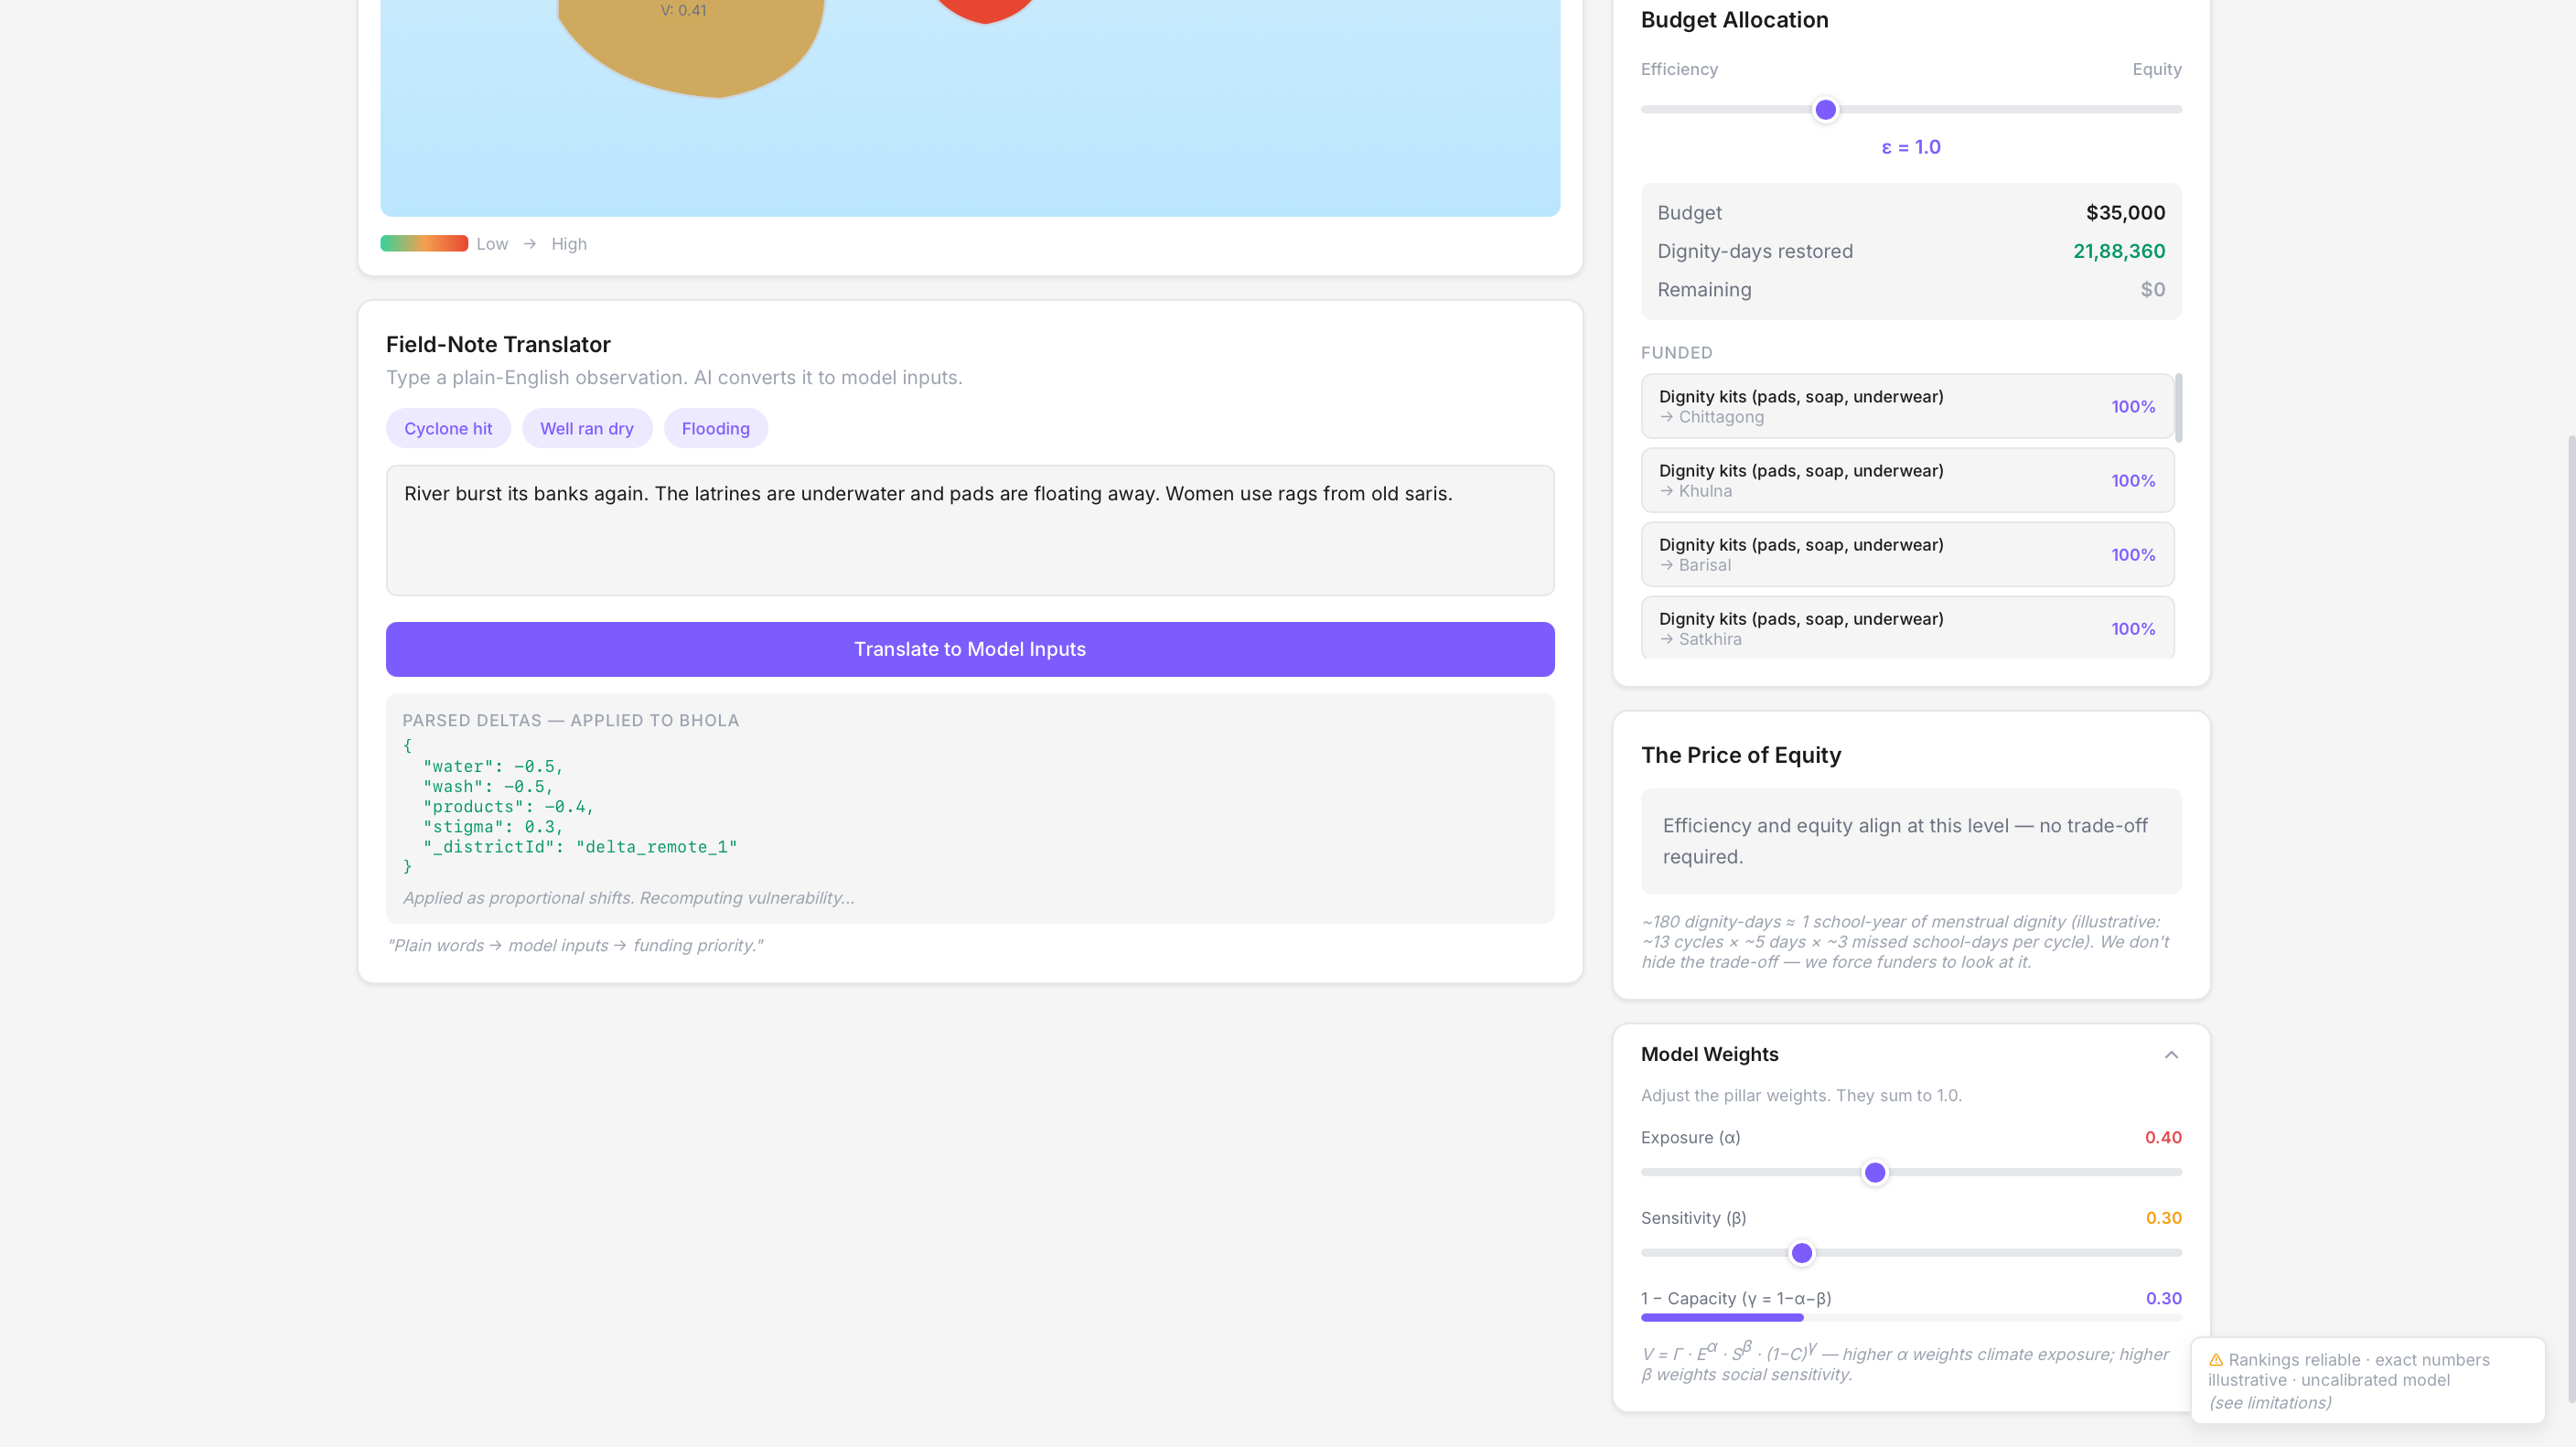
Field Notes Manager
-
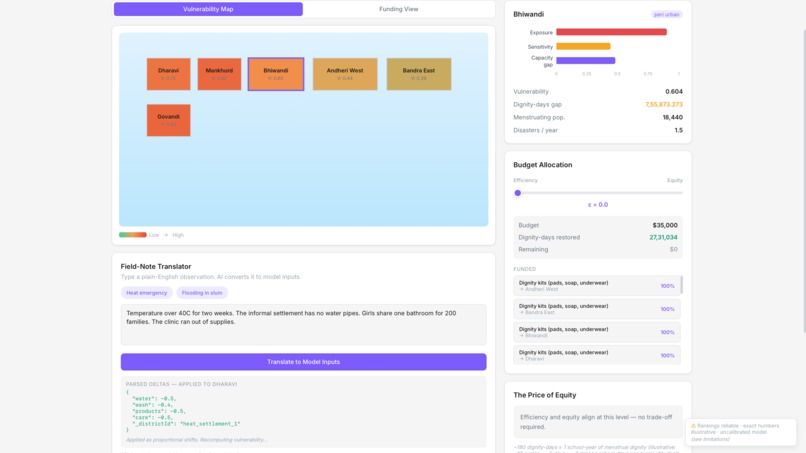
More community info
-
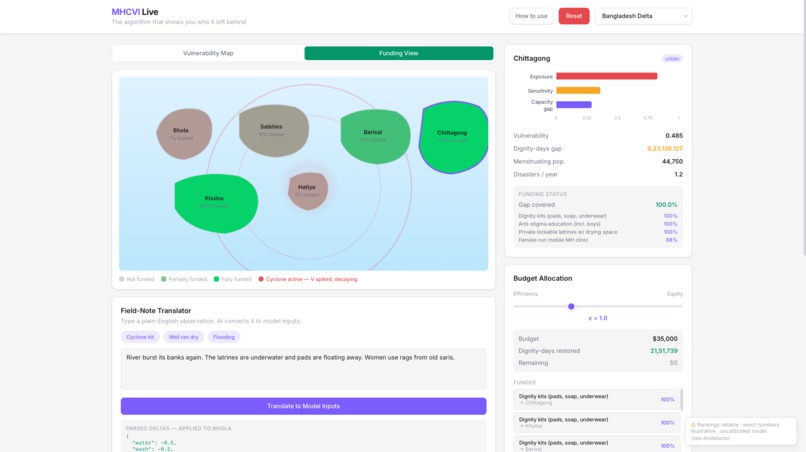
Specific funding info
-

Site Tutorial

The Story Behind MHCVI Live
The problem no one talks about
When disaster funding gets allocated, the algorithm picks winners by cost-per-person. Urban clinics get funded. Remote island communities get skipped. Not because they don't need help — because they're expensive to reach.
Meanwhile, 800 million women and girls menstruate every month, regardless of whether a cyclone just hit. They need pads, clean water, privacy. Climate change is making all of that harder to provide.
There's a mathematical framework that captures this: the Menstrual Health Climate Vulnerability Index (MHCVI). It scores communities on exposure, sensitivity, and adaptive capacity. But it lives in a research paper. PDFs don't move policy. Dashboards do.
What we built
We turned the paper into a live, interactive tool that forces decision-makers to confront what efficiency actually costs.
The core tension: you have $35,000. Do you maximize dignity-days restored (efficiency), or do you make sure the most vulnerable communities aren't abandoned (equity)? The tool makes you choose — and shows you the price of each choice.
How it works
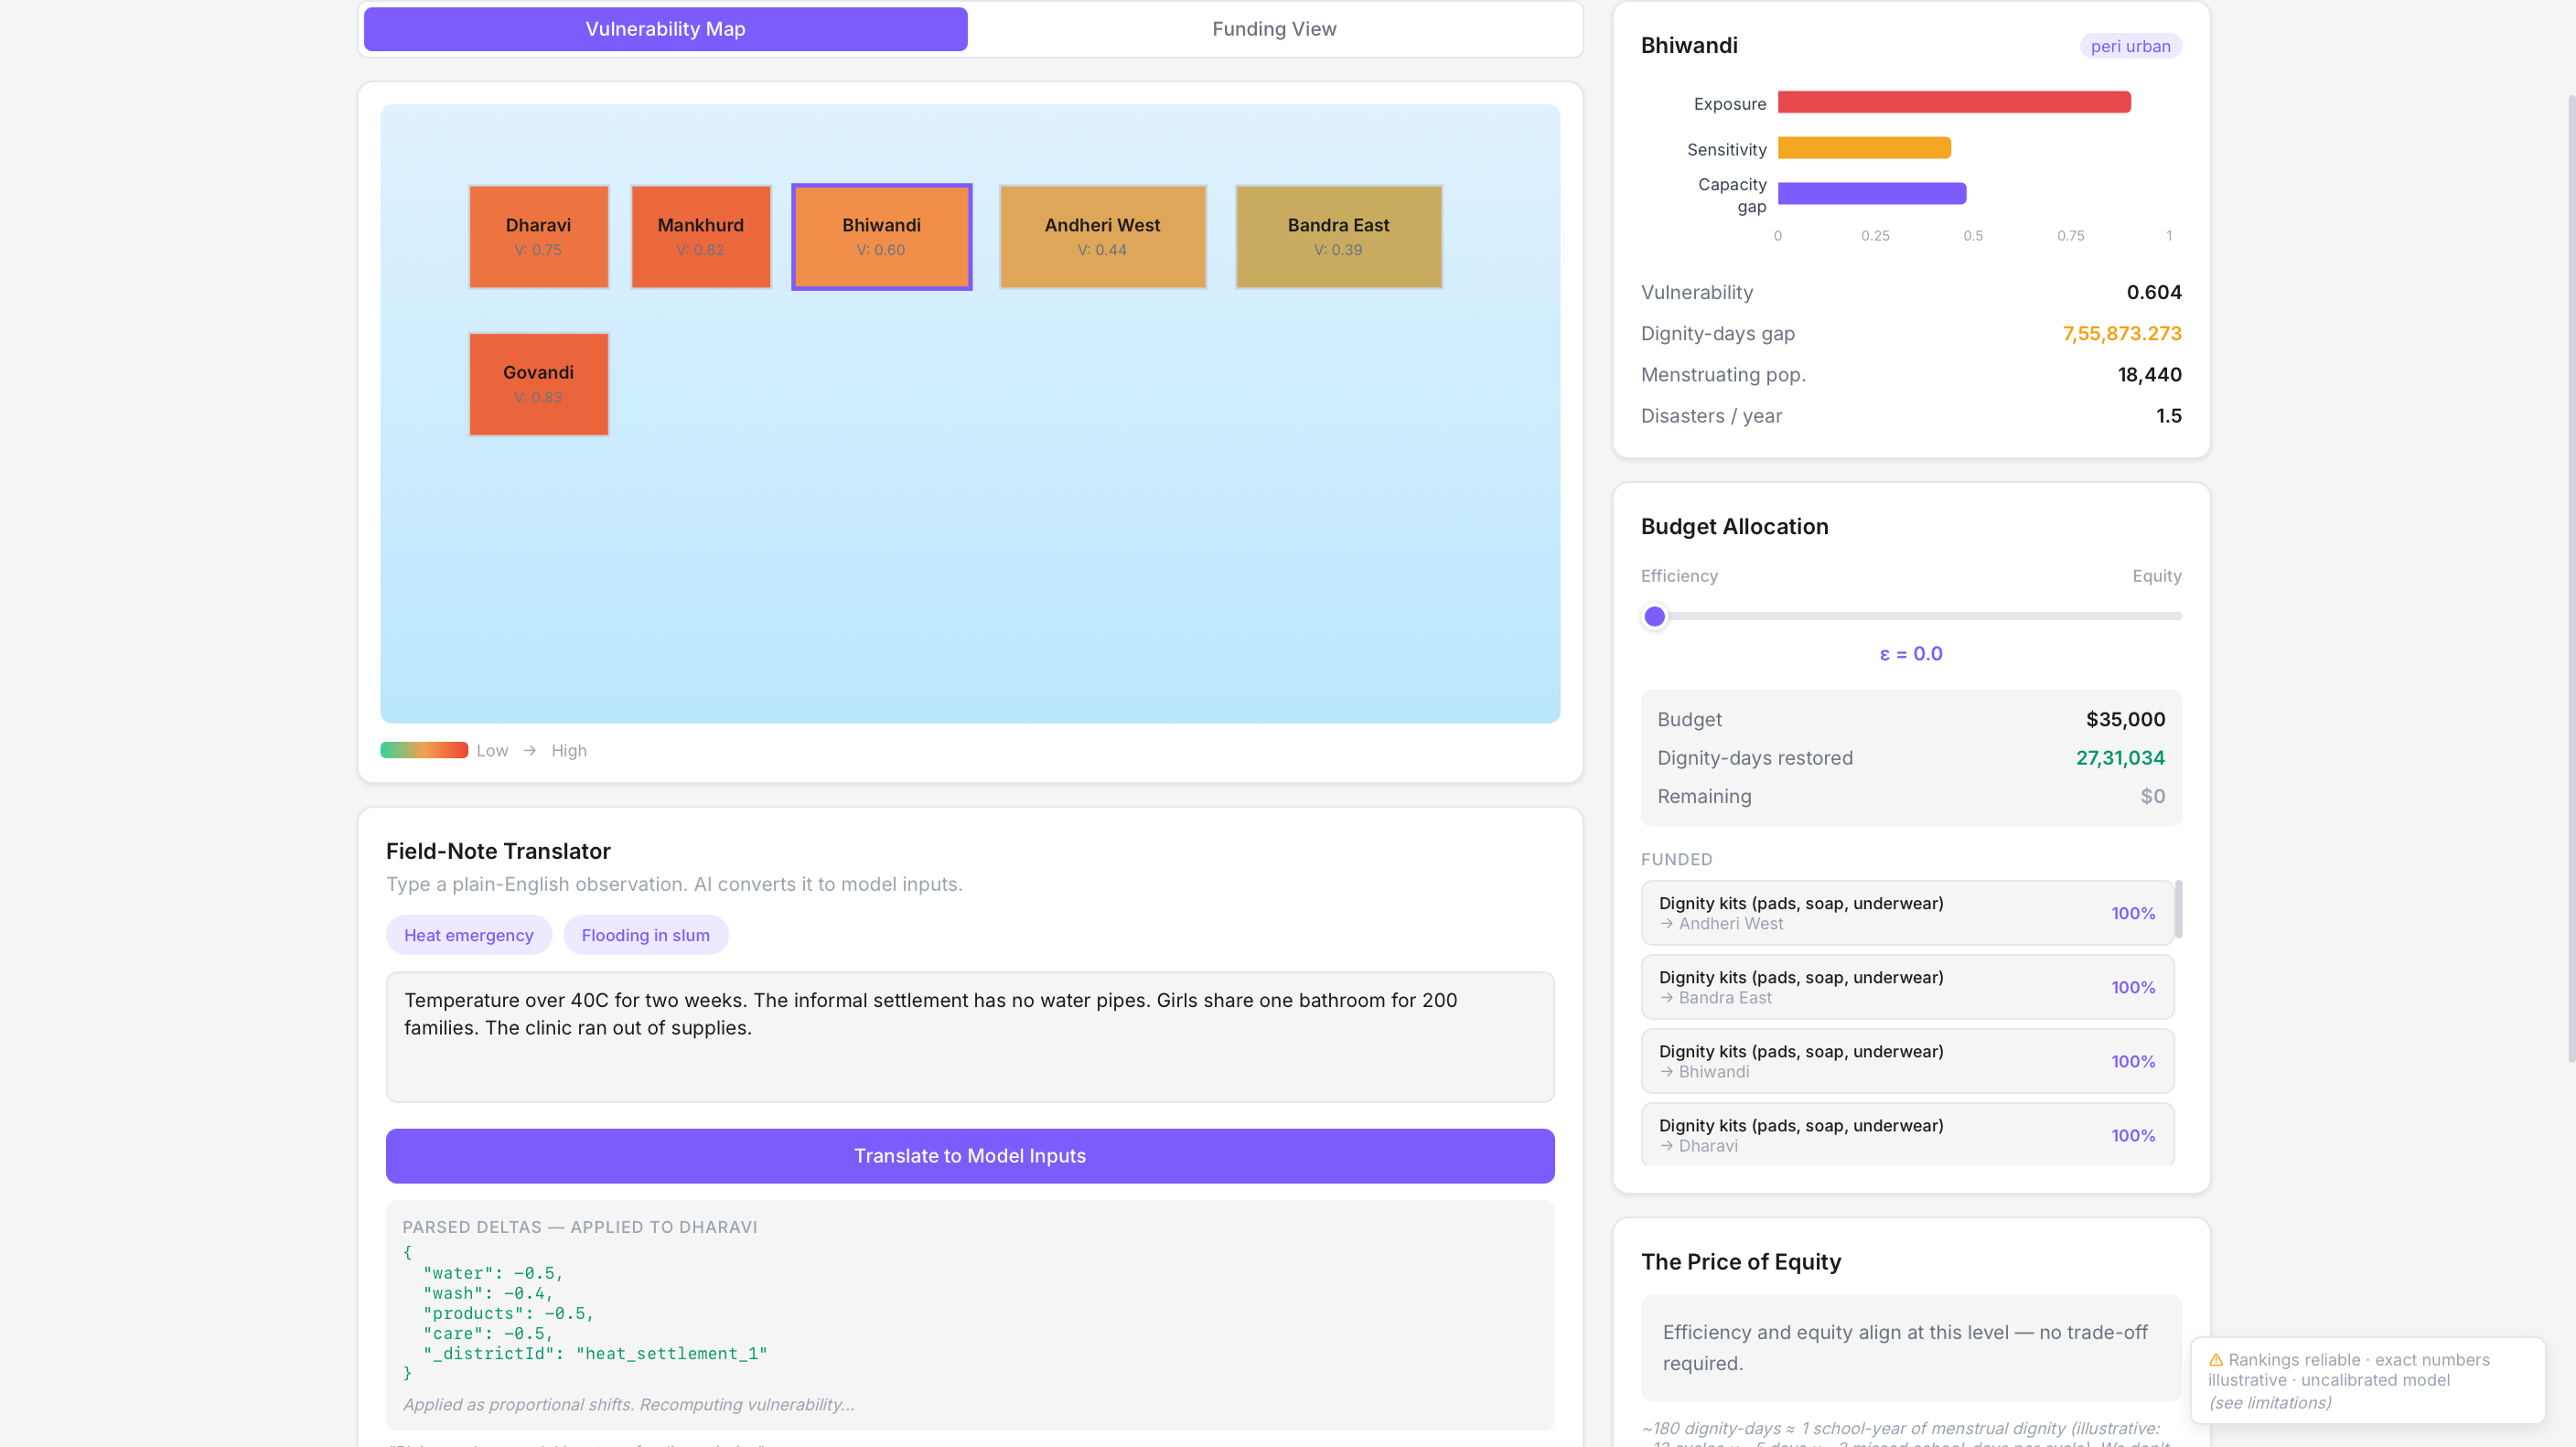
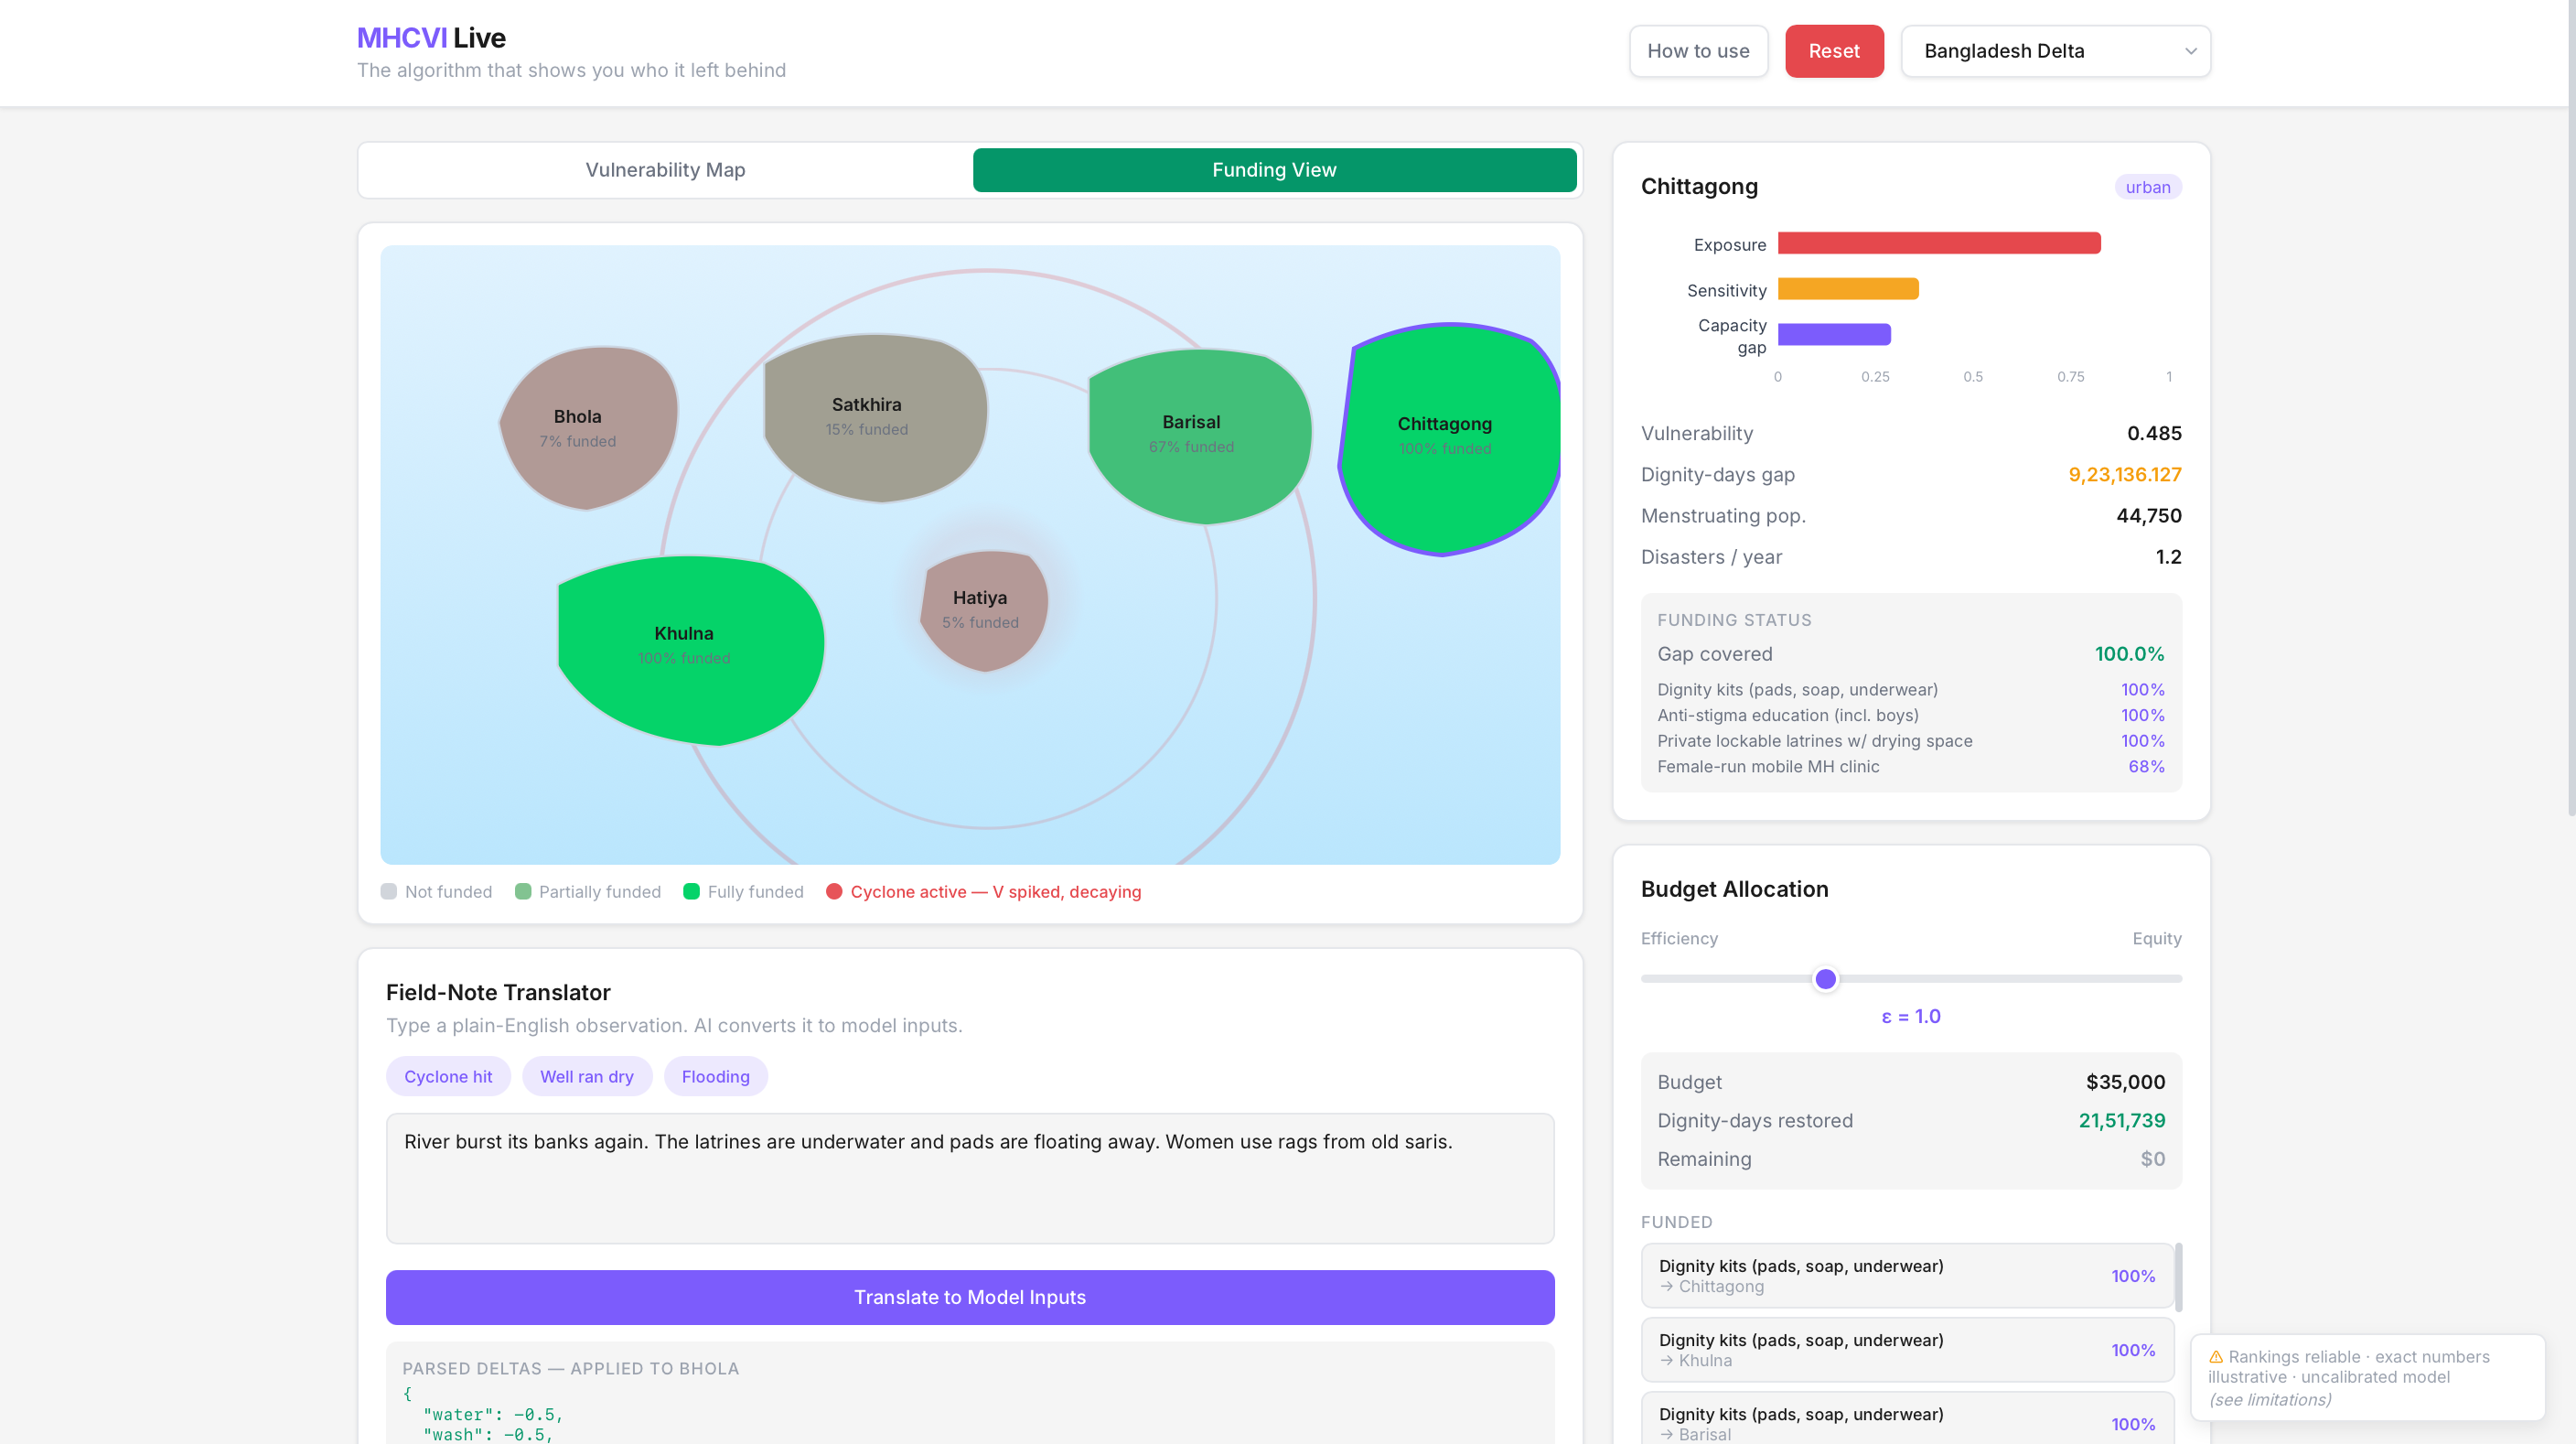
Vulnerability scoring — 18 formulas from the research paper compute a vulnerability index for each district. Exposure (cyclones, floods, drought), sensitivity (poverty, anaemia), and adaptive capacity (WASH, healthcare, social support) combine into a single V_i score. Districts light up green-to-red on an SVG map.
AI field-note translator — A field worker types "the well ran dry and girls walk 3km for water". The AI converts plain English into structured model inputs. The map recolors in real time. No data science degree required.
The equity slider — One slider controls the trade-off. At epsilon=0, the algorithm greedily funds the cheapest, most cost-effective interventions. At epsilon=3, it prioritizes the most vulnerable districts regardless of cost. Watch the map shift. Watch the funding flow.
The price of equity — This is the emotional core. The tool computes exactly how many dignity-days you sacrifice by choosing efficiency over equity. It converts that into school-years. Then it lists the communities that would have been abandoned — by name, with their vulnerability score.
Cyclone simulation — Click a button. A shockwave ripples across the map. Vulnerability spikes. The allocator reshuffles. You see, in real time, which communities get pushed past the breaking point.
The numbers that matter
- 18 mathematical formulas, faithfully implemented from the research paper
- 4 regions, each with 6 districts and unique climate hazard profiles
- 5 intervention types: dignity kits, solar water units, latrines, mobile clinics, anti-stigma programs
- ~$35,000 budget that gets allocated in real time as you drag the slider
- 0 to 25% Price of Equity range — that's how much efficiency costs you in dignity
What we learned
The hardest part wasn't the math. It was making the math honest.
The precondition system nearly didn't work — it was a binary gate instead of a continuous discount. The abandoned-districts panel was comparing against the wrong denominator. The affordability score was sign-inverted, so the poorest districts appeared to have the best product access.
Every one of these bugs told the same story: it's easy to build a model that looks correct but actually hides the people it should protect.
That's exactly the problem this tool exists to expose.
Tech stack
React 19 · Vite 8 · Tailwind CSS 4 · Framer Motion · Recharts · Cloudflare Workers · OpenRouter API
All data is synthetic but realistic — the model is specified, not calibrated. The architecture is designed to swap in real census and climate data when available.
Built on
"Prioritizing Under Constraint: A Mathematical Framework for Targeting Menstrual Health Resources in Climate-Vulnerable Communities"
Built With
- cloudflare
- openrouter
- react
- tailwind
- vite


Log in or sign up for Devpost to join the conversation.