Inspiration
Did you know that approximately 70% to 75% of physical therapy patients fail to complete their at-home exercise programs? When talking to friends and family who have gone through physical therapy, we noticed two massive roadblocks: a complete drop-off in motivation once they left the clinic, and a genuine fear of injuring themselves by doing the exercises incorrectly at home without a professional watching. We wanted to bridge the gap between the clinic and the living room, making rehab something patients actively want to do, rather than a chore they dread.
What it does
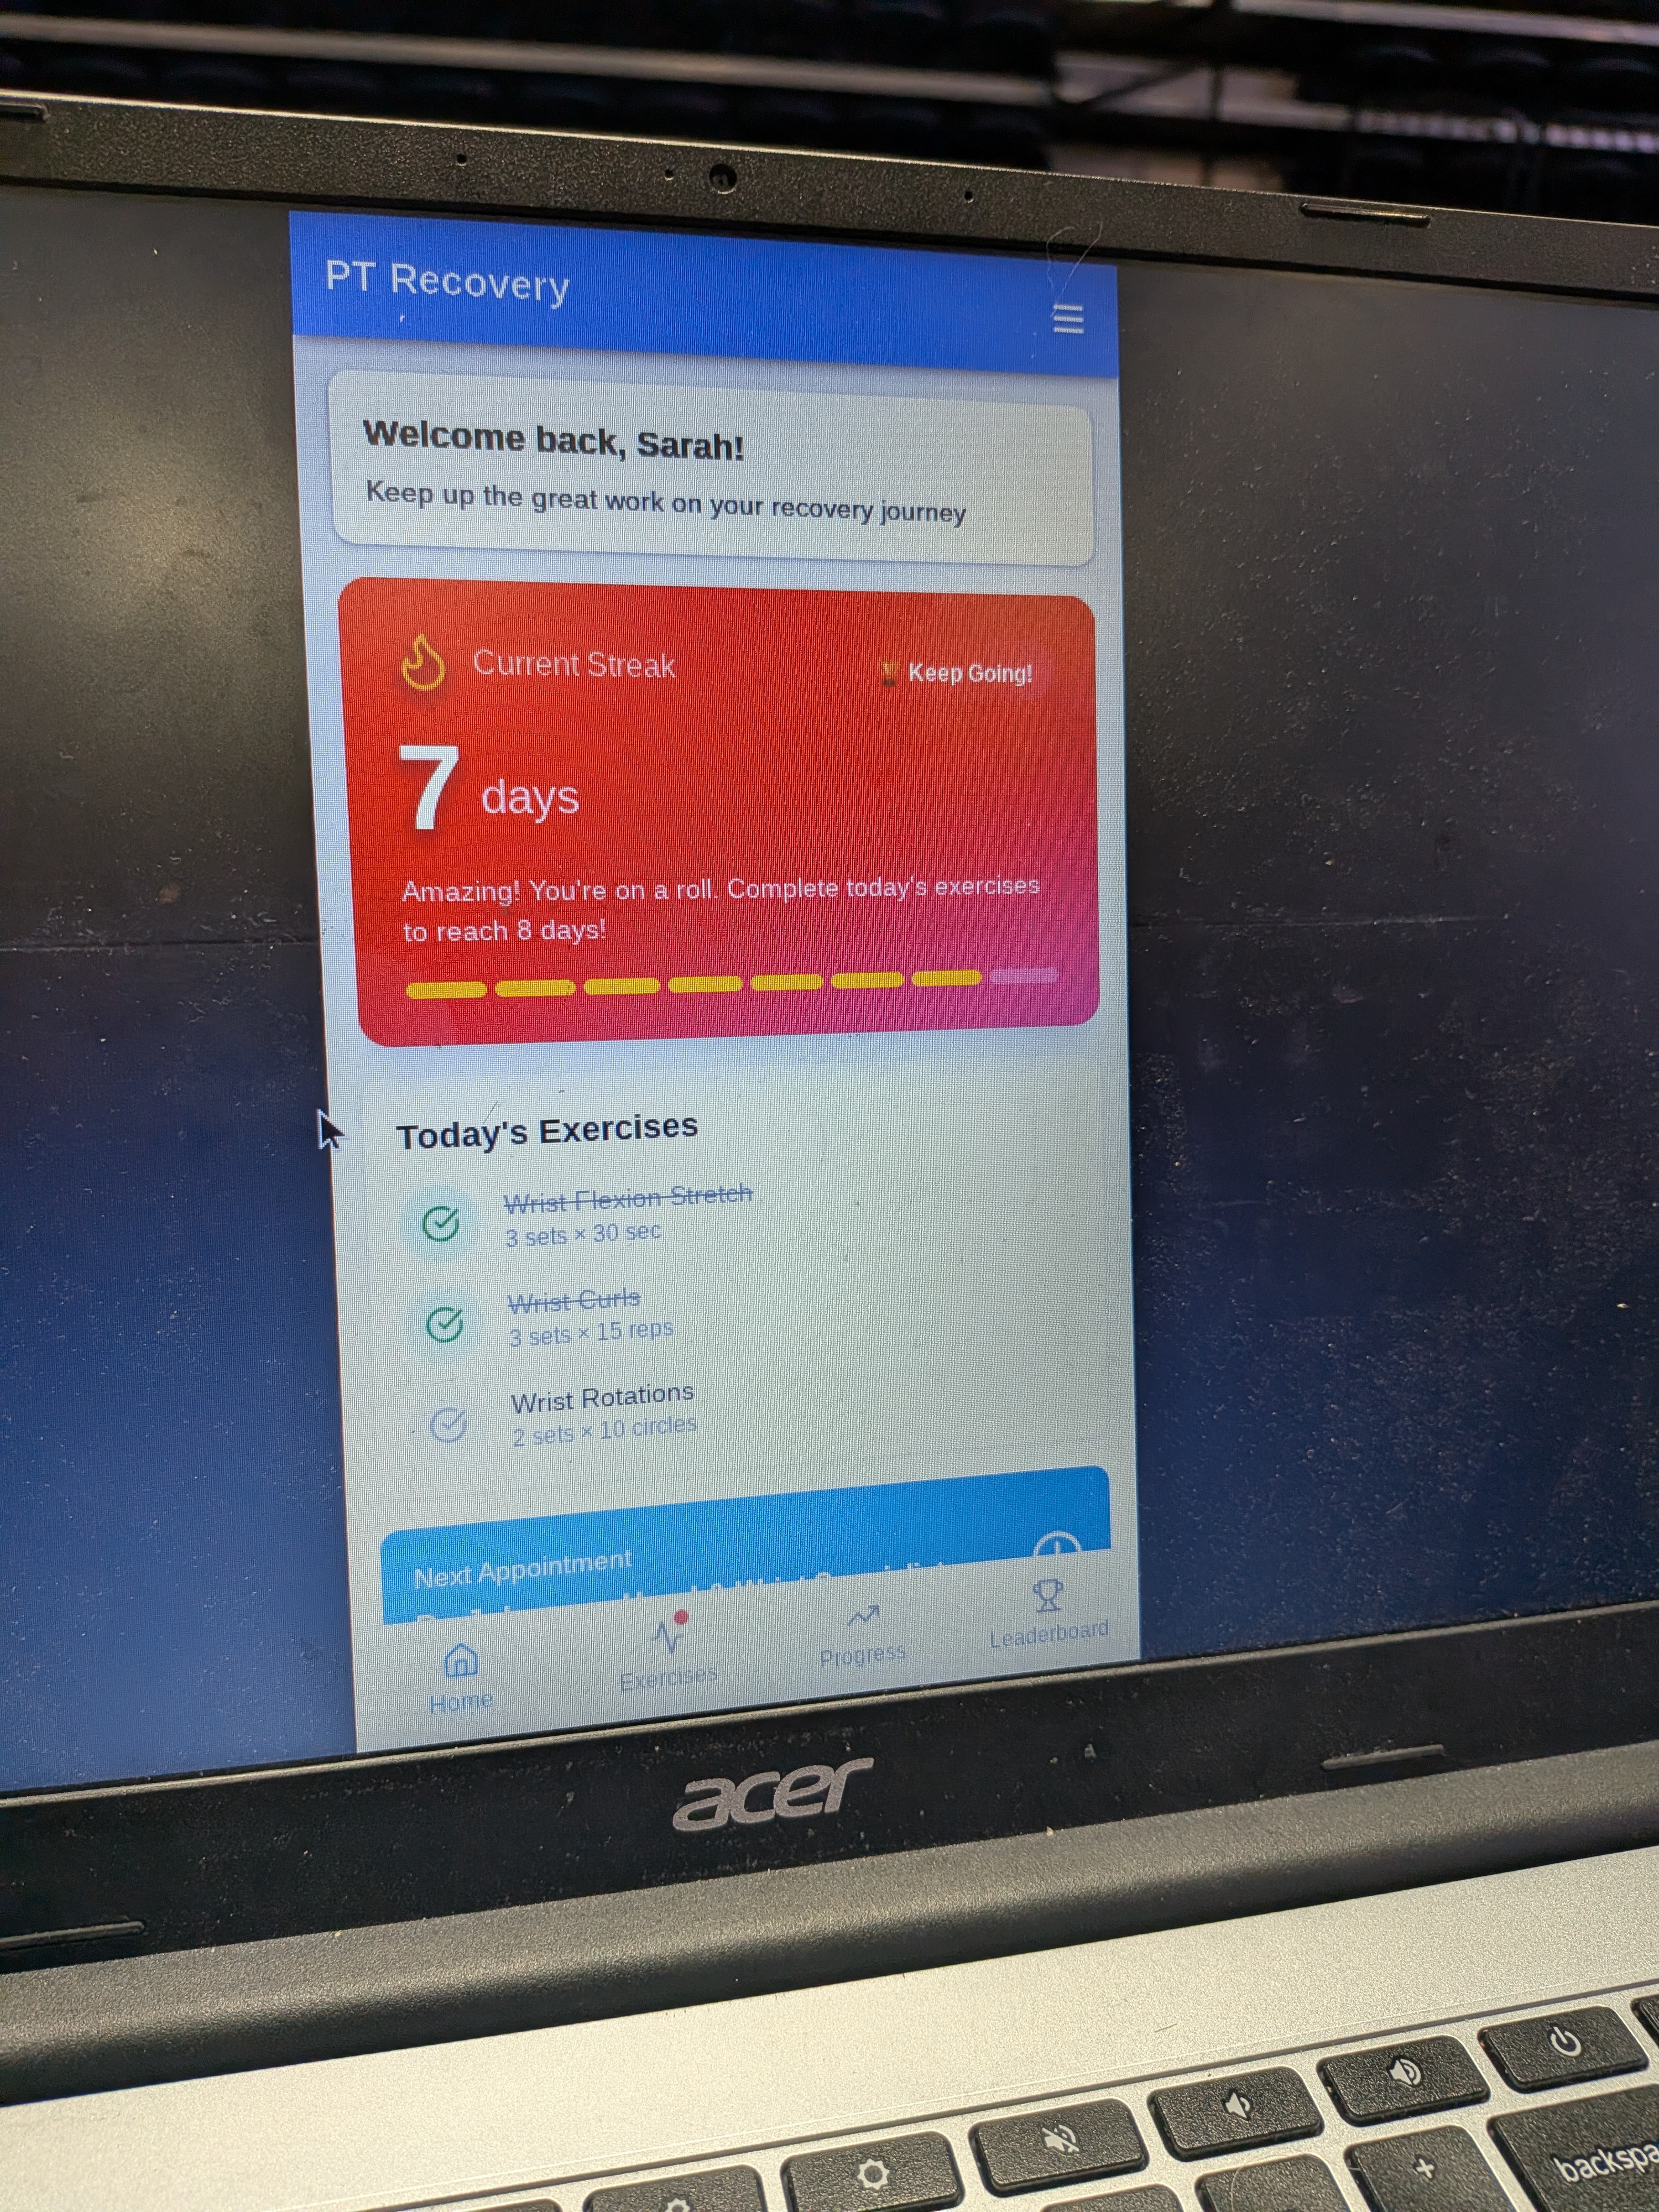
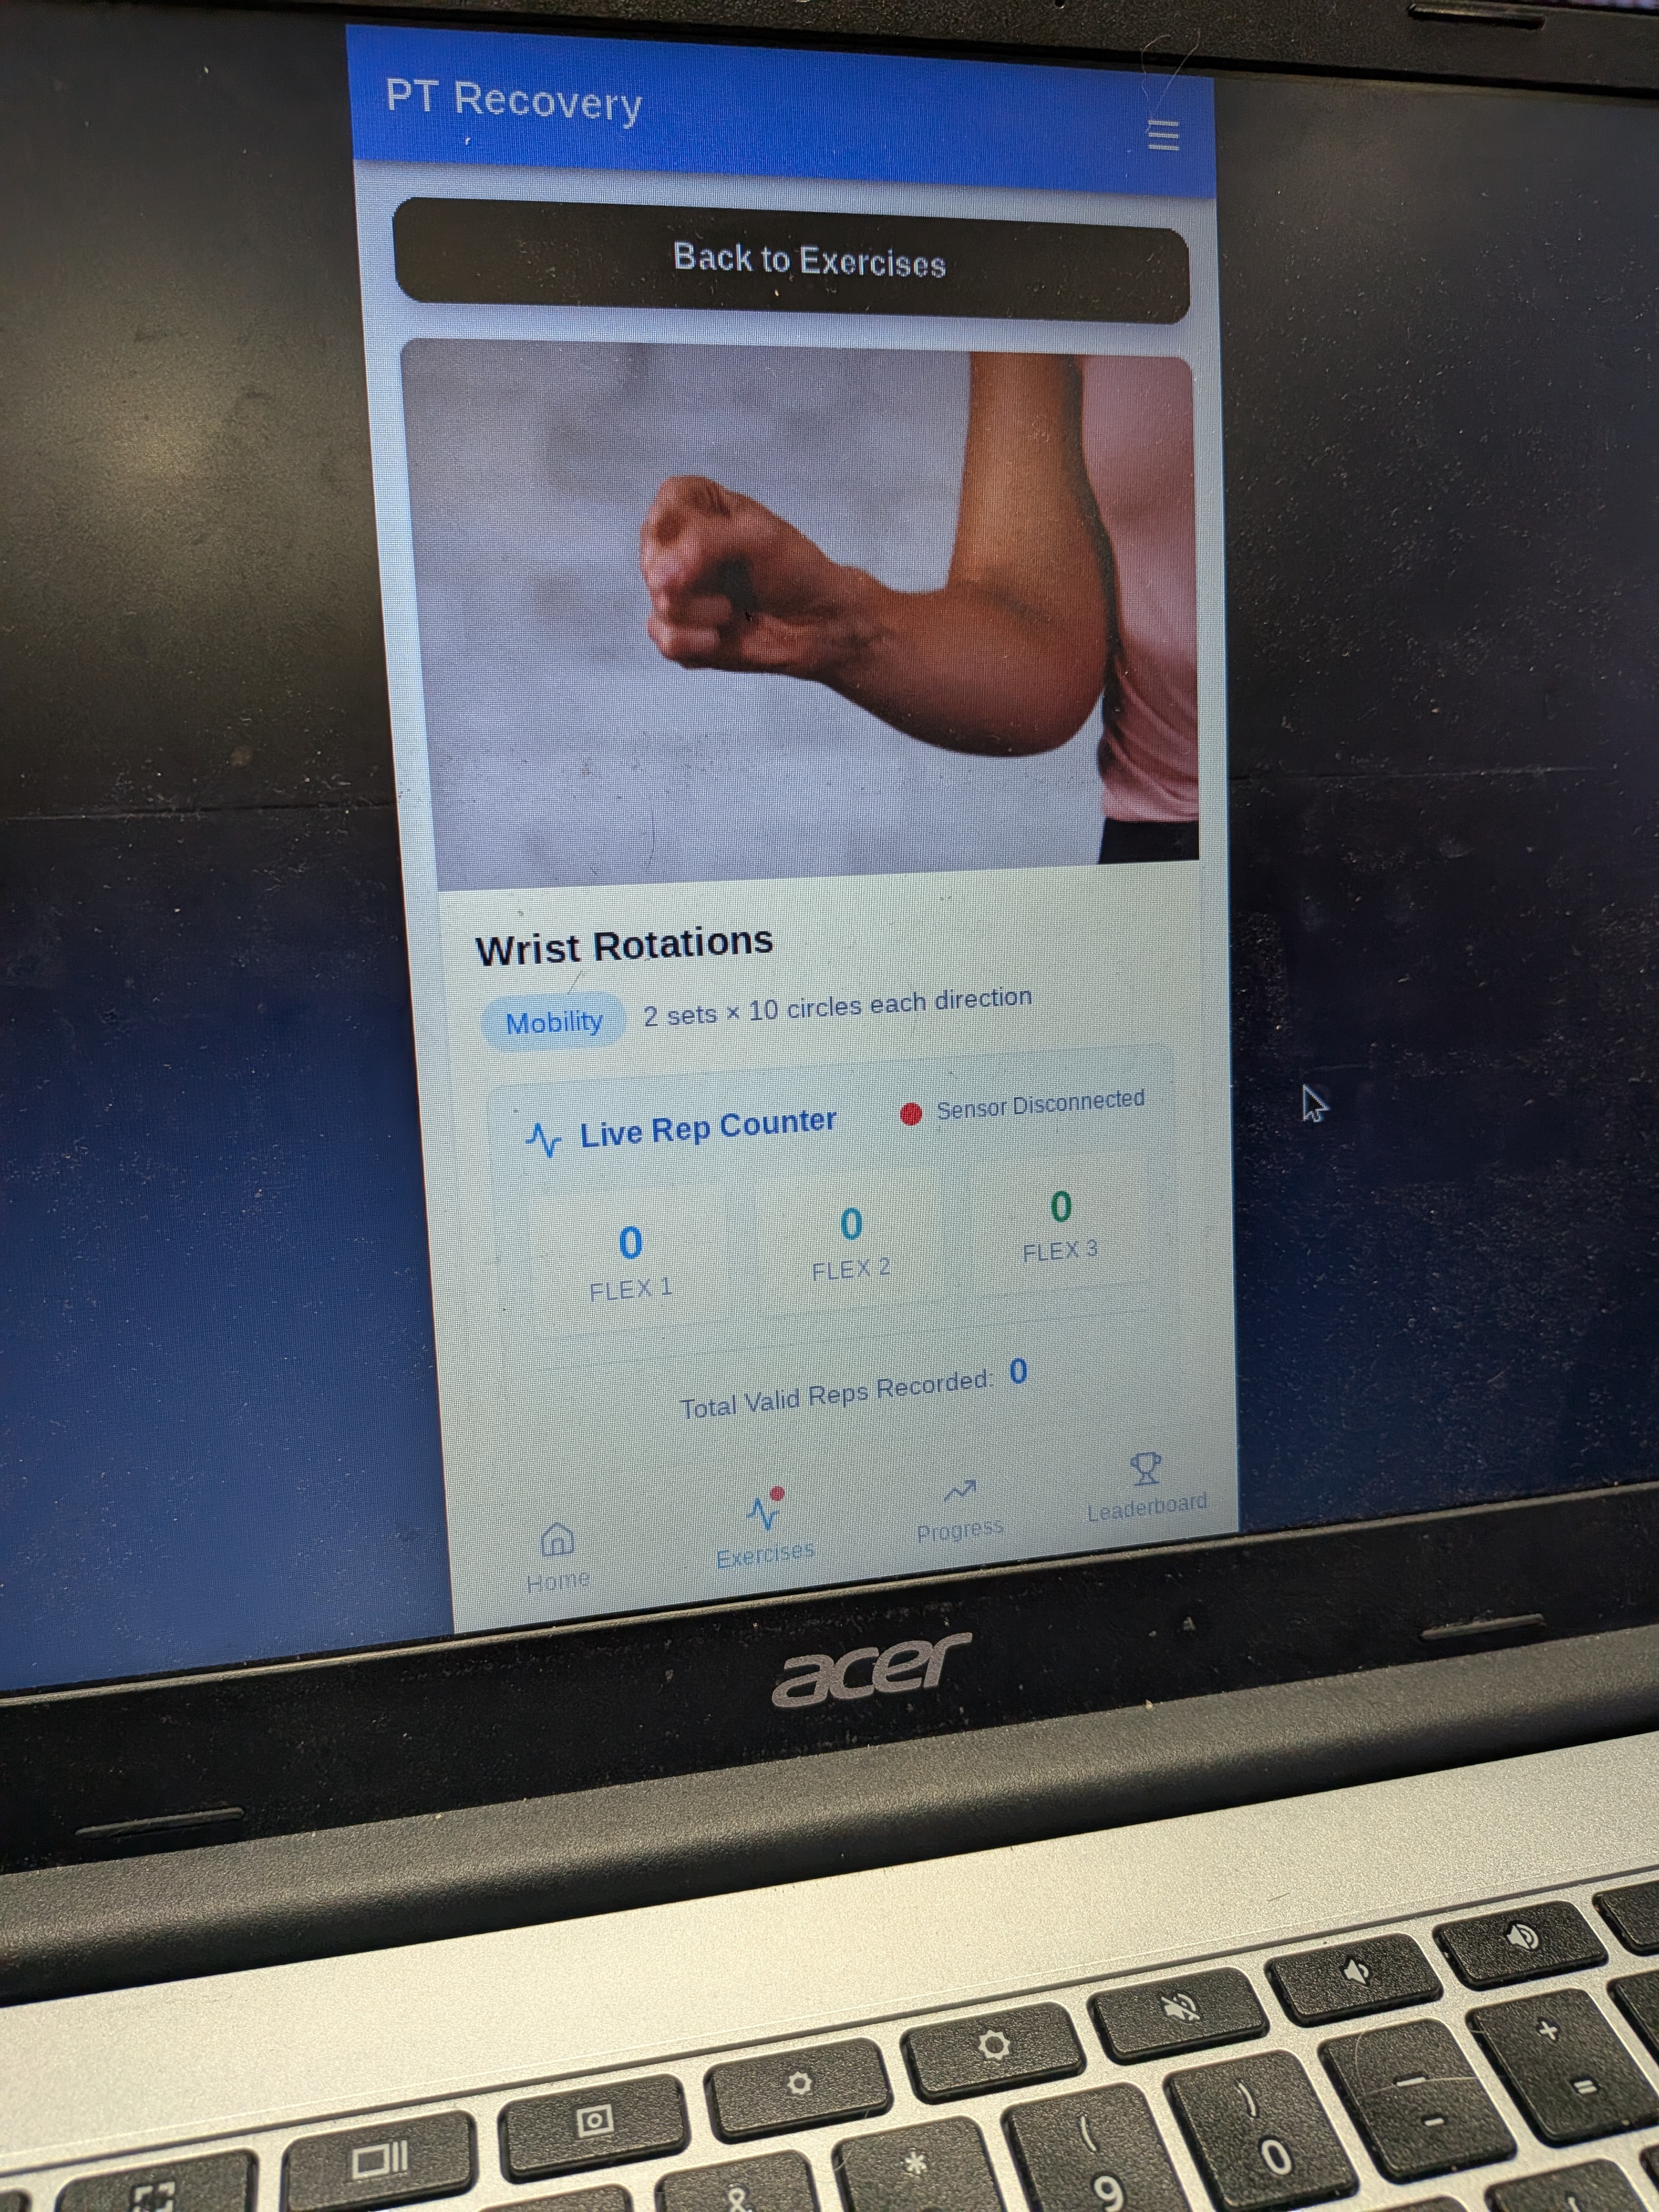
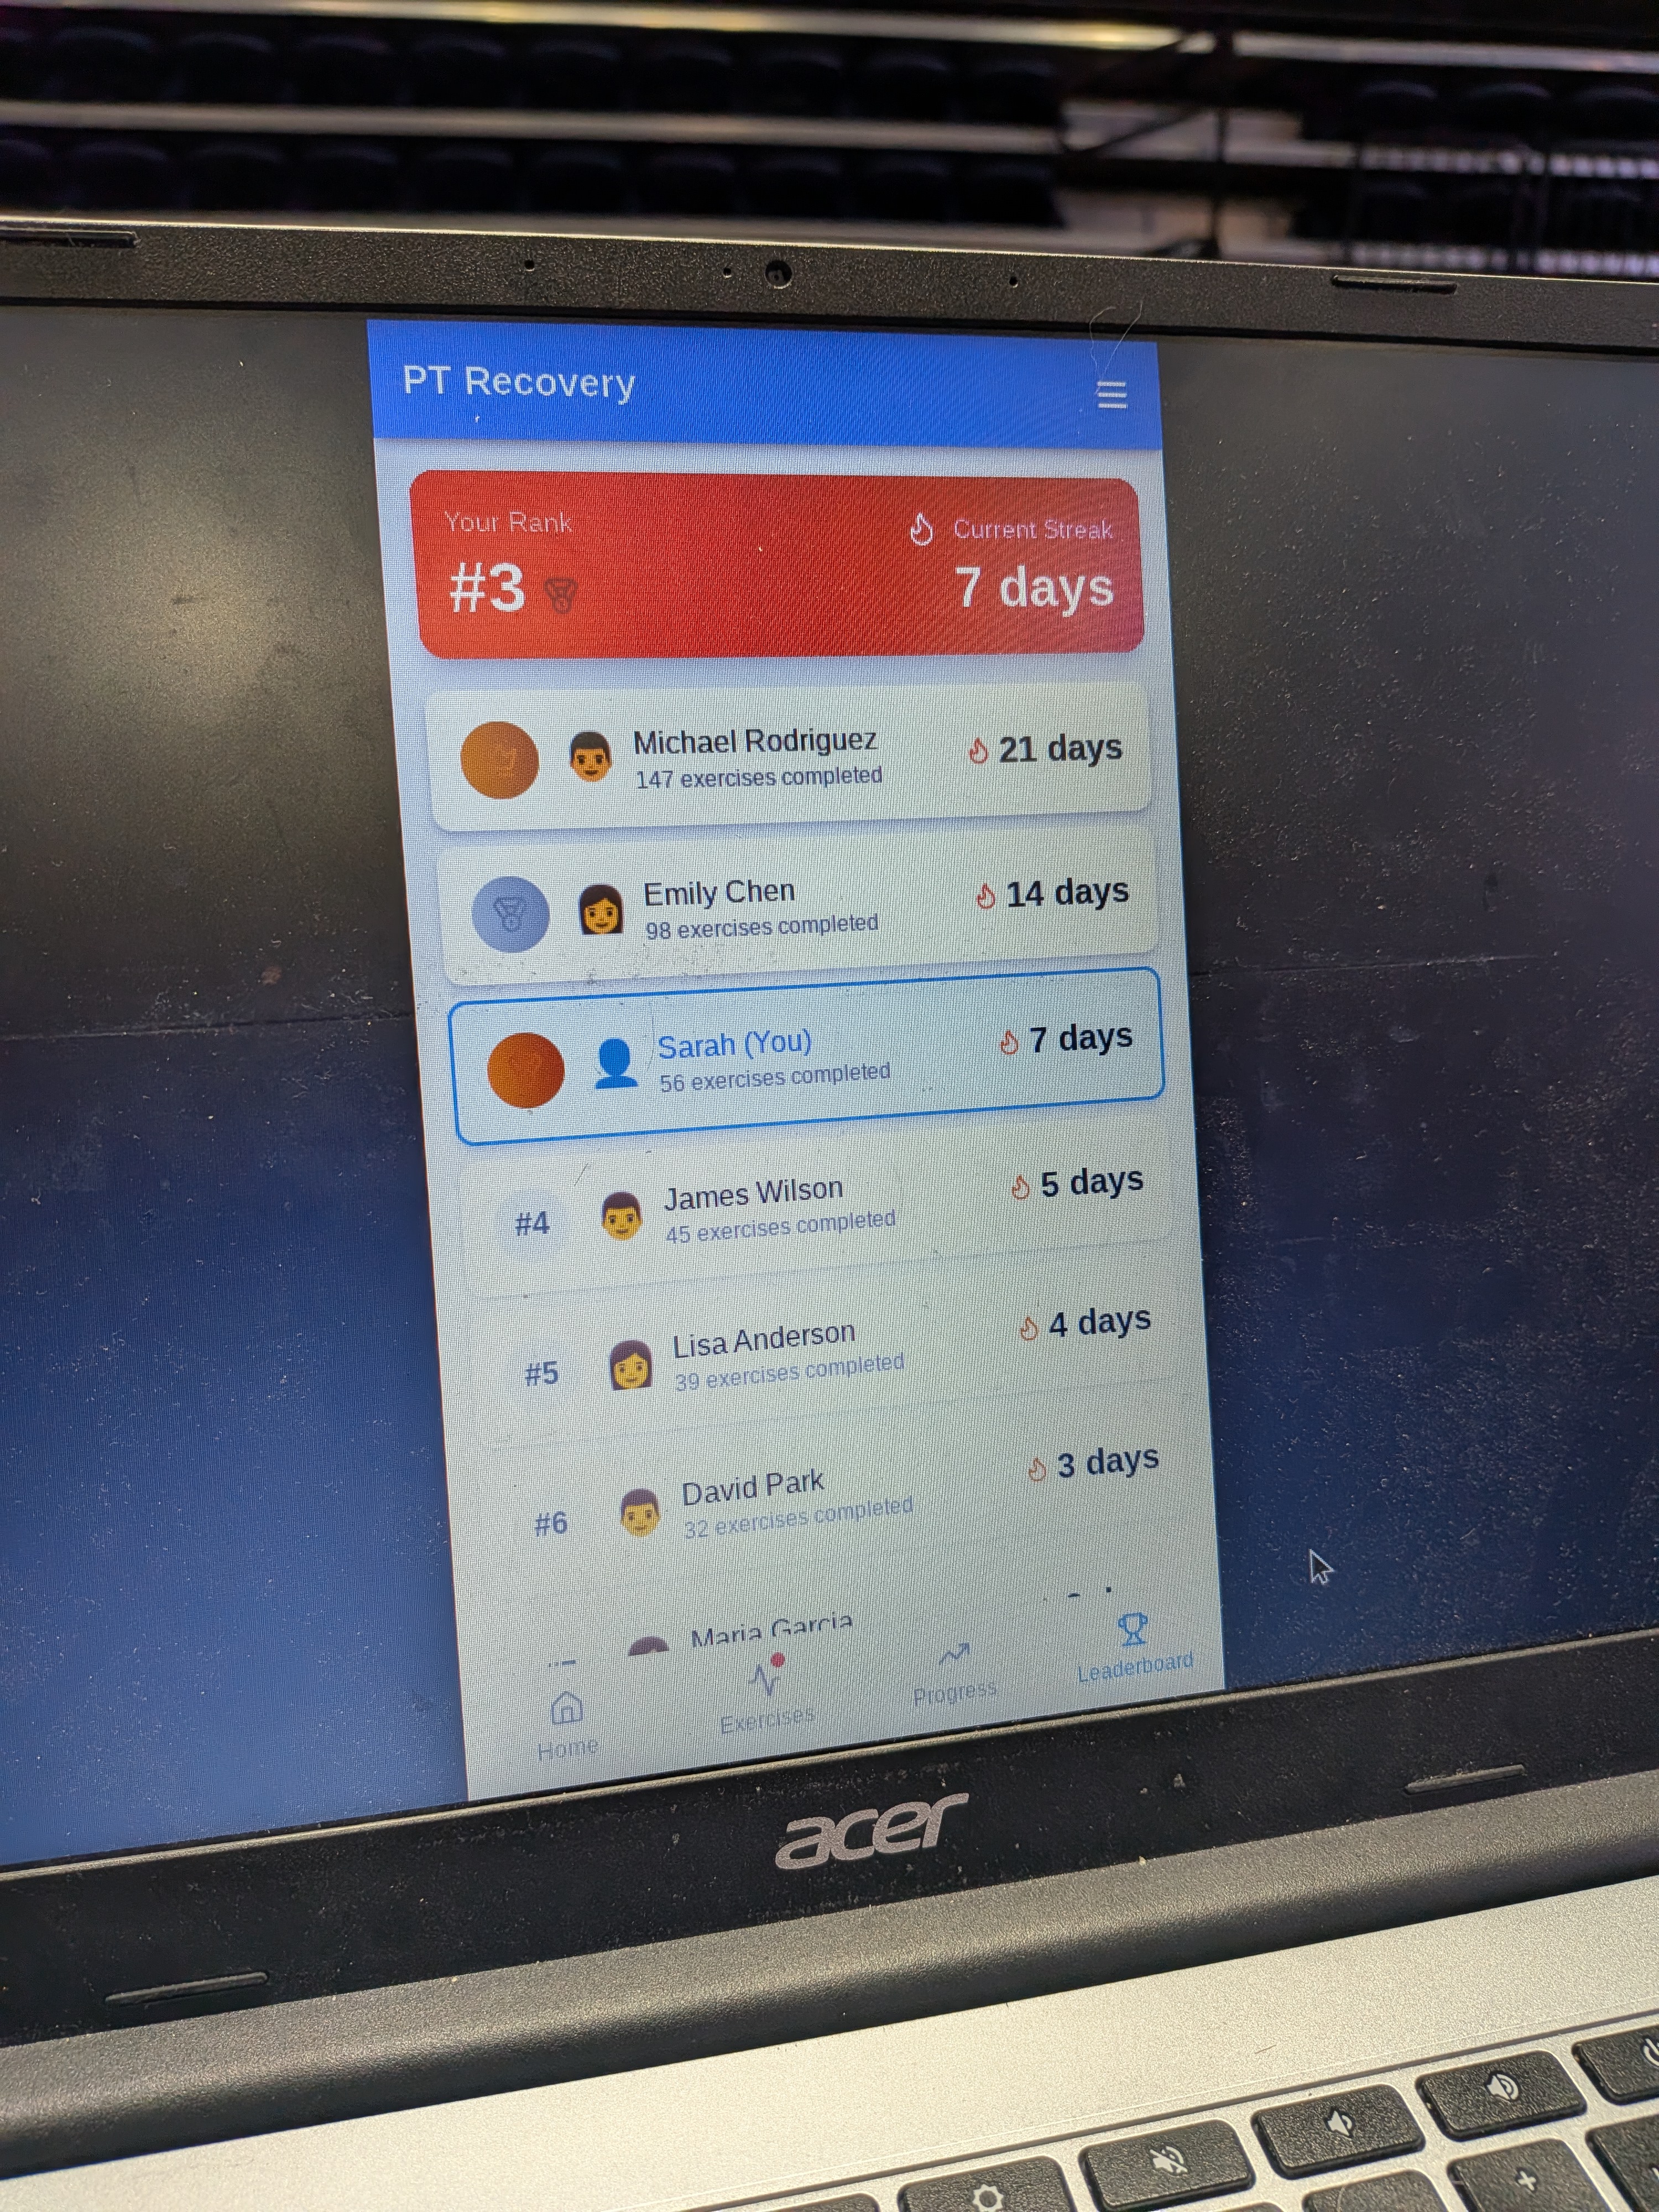
Mendly is an end-to-end physical therapy platform that integrates a highly engaging mobile app with a custom wearable smart glove. To overcome the common hurdle of patient drop-off, the app gamifies the rehab journey using daily streaks and community leaderboards to drive consistent accountability. However, since proper form is just as crucial as consistency, the Mendly smart glove acts as an at-home virtual therapist. Connected via wifi, it tracks range of motion, automatically logs repetitions, and provides instant, real-time feedback to ensure patients are recovering safely and efficiently.
How we built it
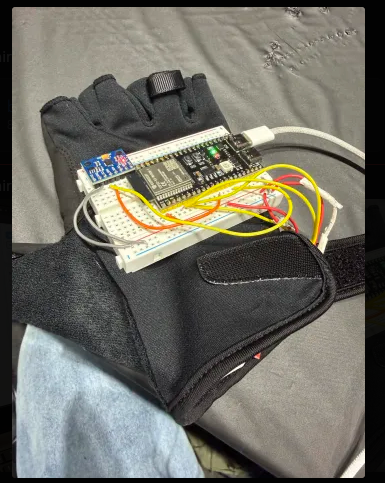
We split the project into two main architectures: hardware and software. Hardware: We built the smart glove using a microcontroller paired with IMU sensors and flex sensors on the joints. This reads the orientation and bend of the user's hand and wrist. We used wifi using http and udp protocol to transmit this data wirelessly. Software: The mobile app was built using a cross-platform framework React Native so it could work on any device. We used MongoDB for our backend to store sensor data. The app parses the incoming BLE telemetry from the glove and compares it against pre-set "ideal" thresholds for specific exercises.
Technical Implementation
Key Technical Features
- ESP32-S3 microcontroller for analog sensor reading and signal processing
- Flex sensor input system using voltage divider circuits
- 46 kOhm fixed resistor paired with each flex sensor
- 100 nF capacitor on each ADC node for hardware noise filtering
- 12-bit ADC resolution, giving raw values from
0to4095 - ADC attenuation set to 11 dB to support readings across the expected 0-3.3 V range
- 20 Hz sampling rate for real-time movement tracking
- Exponential moving average digital filter for smoother sensor data
- Raw ADC values scaled into normalized bend percentages
- Arduino Serial Plotter debugging for calibration and visualization
Sensor Circuit Design
For the sensing system, we used an ESP32-S3 development board to read analog signals from flex sensors. Each flex sensor was wired as part of an individual voltage divider circuit using a 46 kOhm fixed resistor.
The flex sensors vary from approximately 25 kOhm to 100 kOhm depending on bend. As the resistance changes, the voltage at the ADC pin changes, allowing the ESP32-S3 to estimate the amount of bend.
Each sensor circuit followed this structure:
3.3 V -> Flex Sensor -> ADC Node -> 46 kOhm Resistor -> GND
                              |
                              +-> 100 nF Capacitor -> GND
The ADC node was connected to an analog-capable GPIO pin on the ESP32-S3.
Each flex sensor had its own:
- Flex sensor
- 46 kOhm resistor
- 100 nF capacitor
- ADC input pin
The 3.3 V and GND rails were shared across the sensor circuits.
Voltage Divider Behavior
The ADC voltage is determined by the voltage divider equation:
V_ADC = 3.3 V * R_fixed / (R_flex + R_fixed)
Using a 46 kOhm resistor and a flex sensor range of 25 kOhm to 100 kOhm, the expected ADC voltage range was:
At R_flex = 25 kOhm:

V_ADC = 3.3 * 46 / (25 + 46)
V_ADC = 3.3 * 46 / 71
V_ADC ~= 2.14 V
At R_flex = 100 kOhm:

V_ADC = 3.3 * 46 / (100 + 46)
V_ADC = 3.3 * 46 / 146
V_ADC ~= 1.04 V
So the expected voltage range was approximately:
1.04 V to 2.14 V
With a 12-bit ADC, this corresponds to roughly:
1290 to 2650 raw ADC counts
To account for real-world variation, we used slightly wider bounds in software:
rawMin = 1100
rawMax = 2800
This helped account for resistor tolerance, sensor variation, ADC noise, and wiring differences.
Hardware Noise Filtering
To reduce high-frequency noise, we added a 100 nF capacitor from each ADC node to ground.
This creates a simple RC low-pass filter. The cutoff frequency is calculated using:
f_c = 1 / (2*pi*R*C)
The effective resistance at the ADC node is the parallel resistance of the flex sensor and the fixed resistor:
R_eq = R_flex || R_fixed
Cutoff Frequency at Minimum Flex Resistance
When the flex sensor is approximately 25 kOhm:
R_eq = 25 kOhm || 46 kOhm

R_eq = (25 * 46) / (25 + 46)
R_eq = 1150 / 71
R_eq ~= 16.2 kOhm
Using a 100 nF capacitor:
f_c = 1 / (2*pi*R*C)

f_c = 1 / (2*pi * 16.2 kOhm * 100 nF)

f_c = 1 / (2*pi * 16,200 * 0.0000001)

f_c ~= 98 Hz
Cutoff Frequency at Maximum Flex Resistance
When the flex sensor is approximately 100 kOhm:
R_eq = 100 kOhm || 46 kOhm

R_eq = (100 * 46) / (100 + 46)
R_eq = 4600 / 146
R_eq ~= 31.5 kOhm
Using a 100 nF capacitor:
f_c = 1 / (2*pi*R*C)

f_c = 1 / (2*pi * 31.5 kOhm * 100 nF)

f_c = 1 / (2*pi * 31,500 * 0.0000001)

f_c ~= 51 Hz
Therefore, the hardware filter cutoff range was approximately:
51 Hz to 98 Hz
This was a good range for the flex sensors because the motion we were measuring was much slower than the noise we wanted to remove.
Software Signal Processing
On the software side, the ESP32-S3 sampled the sensor data at 20 Hz, meaning each sensor was read every 50 ms.
20 samples per second = 1 sample every 50 ms
The ADC was configured using:
analogReadResolution(12);
analogSetAttenuation(ADC_11db);
The 12-bit resolution gave raw ADC readings from:
0 to 4095
The 11 dB attenuation allowed the ESP32-S3 to read voltages across the expected range near 0-3.3 V.
After reading the raw ADC value, we applied an exponential moving average filter:
filteredValue = alpha * newReading + (1 - alpha) * previousFilteredValue
We used:
alpha = 0.20
This gave smoother readings while still responding quickly enough for real-time movement tracking.
Bend Percentage Scaling
After filtering the raw sensor value, we converted it into a normalized bend percentage.
Because the circuit was wired with the flex sensor connected to 3.3 V and the 46 kOhm resistor connected to ground, a larger flex resistance produced a lower ADC value.
That means:
Lower raw ADC value = more bend
Higher raw ADC value = less bend
The scaled bend percentage was calculated using:
bendPercent = (rawMax - filteredRaw) * 100 / (rawMax - rawMin)
Using the selected bounds:
rawMin = 1100
rawMax = 2800
This produced a bend value from approximately:
0% to 100%
where:
0%   = less bent
100% = more bent
Testing and Debugging
For testing, we used the Arduino Serial Monitor and Arduino Serial Plotter.
The Serial Monitor was useful for checking exact numerical values, while the Serial Plotter helped visualize how the raw, filtered, and scaled values changed over time.
This made it easier to tune:
- The capacitor value
- The digital filter strength
- The raw minimum and maximum bounds
- The sensor response during bending
For Serial Plotter compatibility, we printed values as tab-separated numbers rather than labeled text.
Example plotter output format:
rawValue filteredValue bendPercent
This allowed us to see how much noise was present in the raw signal and how much smoothing was added by the hardware and software filters.
Challenges We Solved
One challenge was getting stable sensor readings from the ESP32-S3 ADC. The raw flex sensor values had some noise, so we used both hardware and software filtering.
The 100 nF capacitor provided hardware filtering by reducing high-frequency noise at the ADC node. The exponential moving average filter provided software smoothing after each ADC reading.
Another challenge was converting raw ADC readings into meaningful movement data. The theoretical voltage divider values gave us a starting range, but real-world readings varied because of resistor tolerance, flex sensor variation, ADC behavior, and wiring differences.
To make the system more reliable, we used slightly wider calibration bounds than the theoretical values. This helped prevent clipping and made the bend percentage more stable during normal use.
Summary
Overall, we built a flex sensor input system using the ESP32-S3, voltage divider circuits, hardware filtering, digital filtering, and calibrated scaling. The result was a smoother and more usable bend signal that could be sampled at 20 Hz and converted into a normalized movement value for real-time interaction.
Challenges we ran into
By far our biggest hurdle was establishing a reliable communication pipeline between the physical glove and our software ecosystem. Hardware and software inherently speak different languages, and getting our mobile app to consistently communicate with the glove’s Wi-Fi module over the local network was a massive time sink. Once we finally established a stable connection without dropping packets, we faced another major issue: filtering the electrical noise from all the wires and custom circuits to get accurate data. Because of this physical interference, the raw telemetry coming from the flex sensors and accelerometers was incredibly erratic. We had to spend hours implementing smoothing algorithms and custom parsing logic to translate that messy stream of hardware signals into clean, usable data that our app could actually use to count a repetition.
Accomplishments that we're proud of
Honestly, our biggest accomplishment was getting the entire ecosystem working in the first place! Given the massive headaches we had with local Wi-Fi communication and erratic sensor noise, we are incredibly proud that we bridged the physical and digital divide. Applying hands-on engineering to build out the full-stack and backend infrastructure meant we had to tackle the data flow at every single level. Seeing the app accurately register a correct repetition—proving our custom noise-filtering algorithms and Wi-Fi data pipeline actually worked—was a massive "eureka" moment that made every frustrating debugging session completely worth it.
What we learned
We learned a ton about hardware-software integration, specifically the nuances of BLE communication. We also gained valuable experience in handling raw, noisy telemetry data and designing database schemas that can handle real-time leaderboard updates efficiently. On a broader scale, we learned a lot about the actual mechanics of physical therapy and how crucial precise movements are for recovery.
What's next for Mendly
First, we want to expand the hardware to include sleeves for elbows and knees, allowing us to track full-body physical therapy routines. On the software side, we plan to train a machine-learning model on the sensor data so the app can automatically detect which exercise the user is doing without them having to manually select it. Finally, we'd love to partner with actual physical therapy clinics to create a portal where therapists can remotely monitor their patients' at-home progress and form.


Log in or sign up for Devpost to join the conversation.