-
-
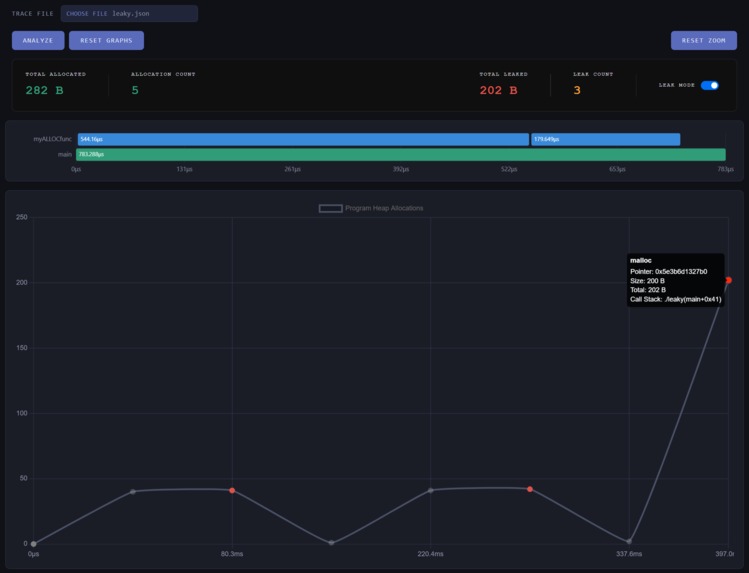
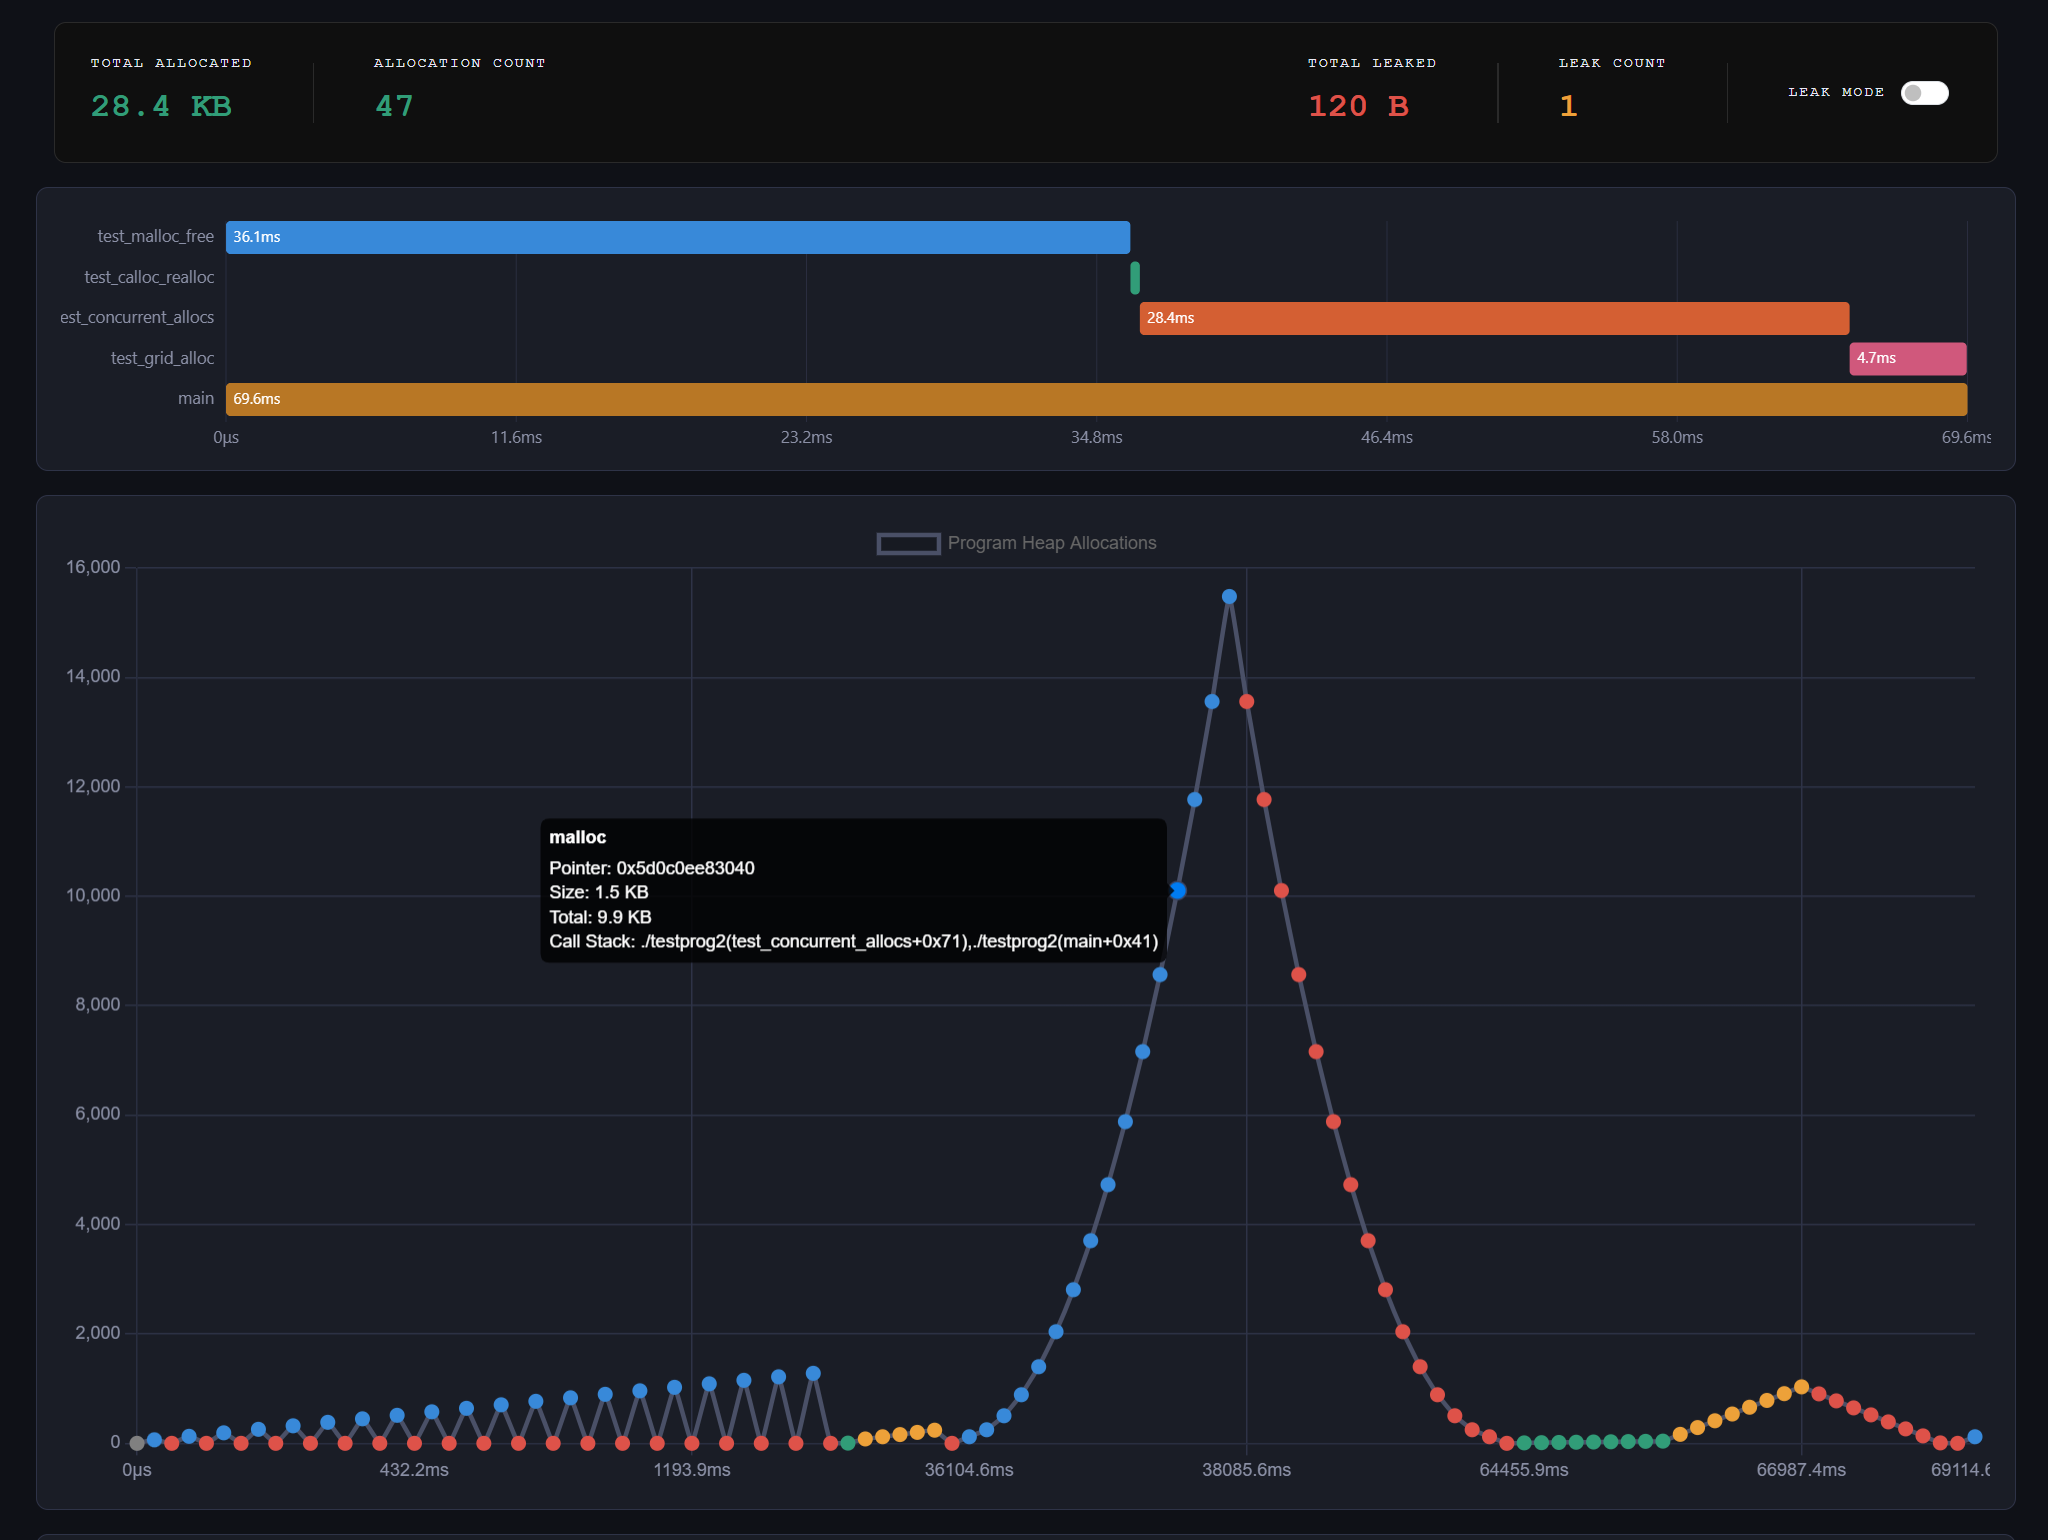
Heap graph with LEAK MODE enabled.
-

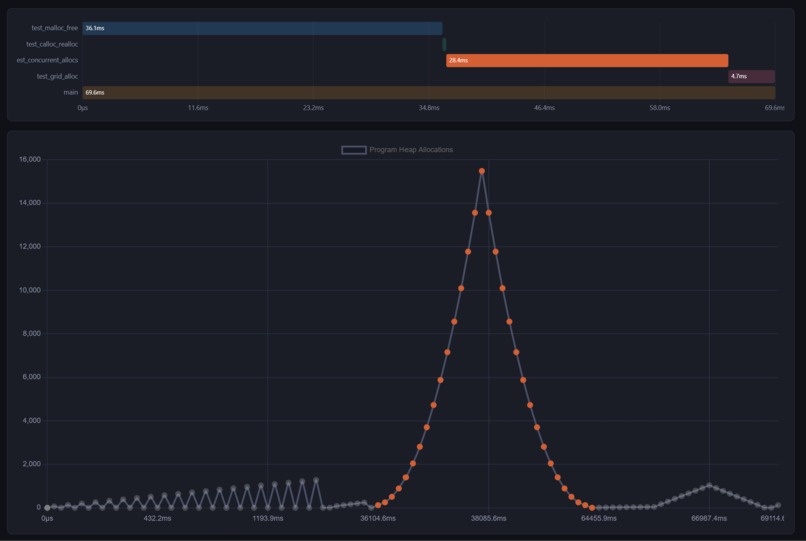
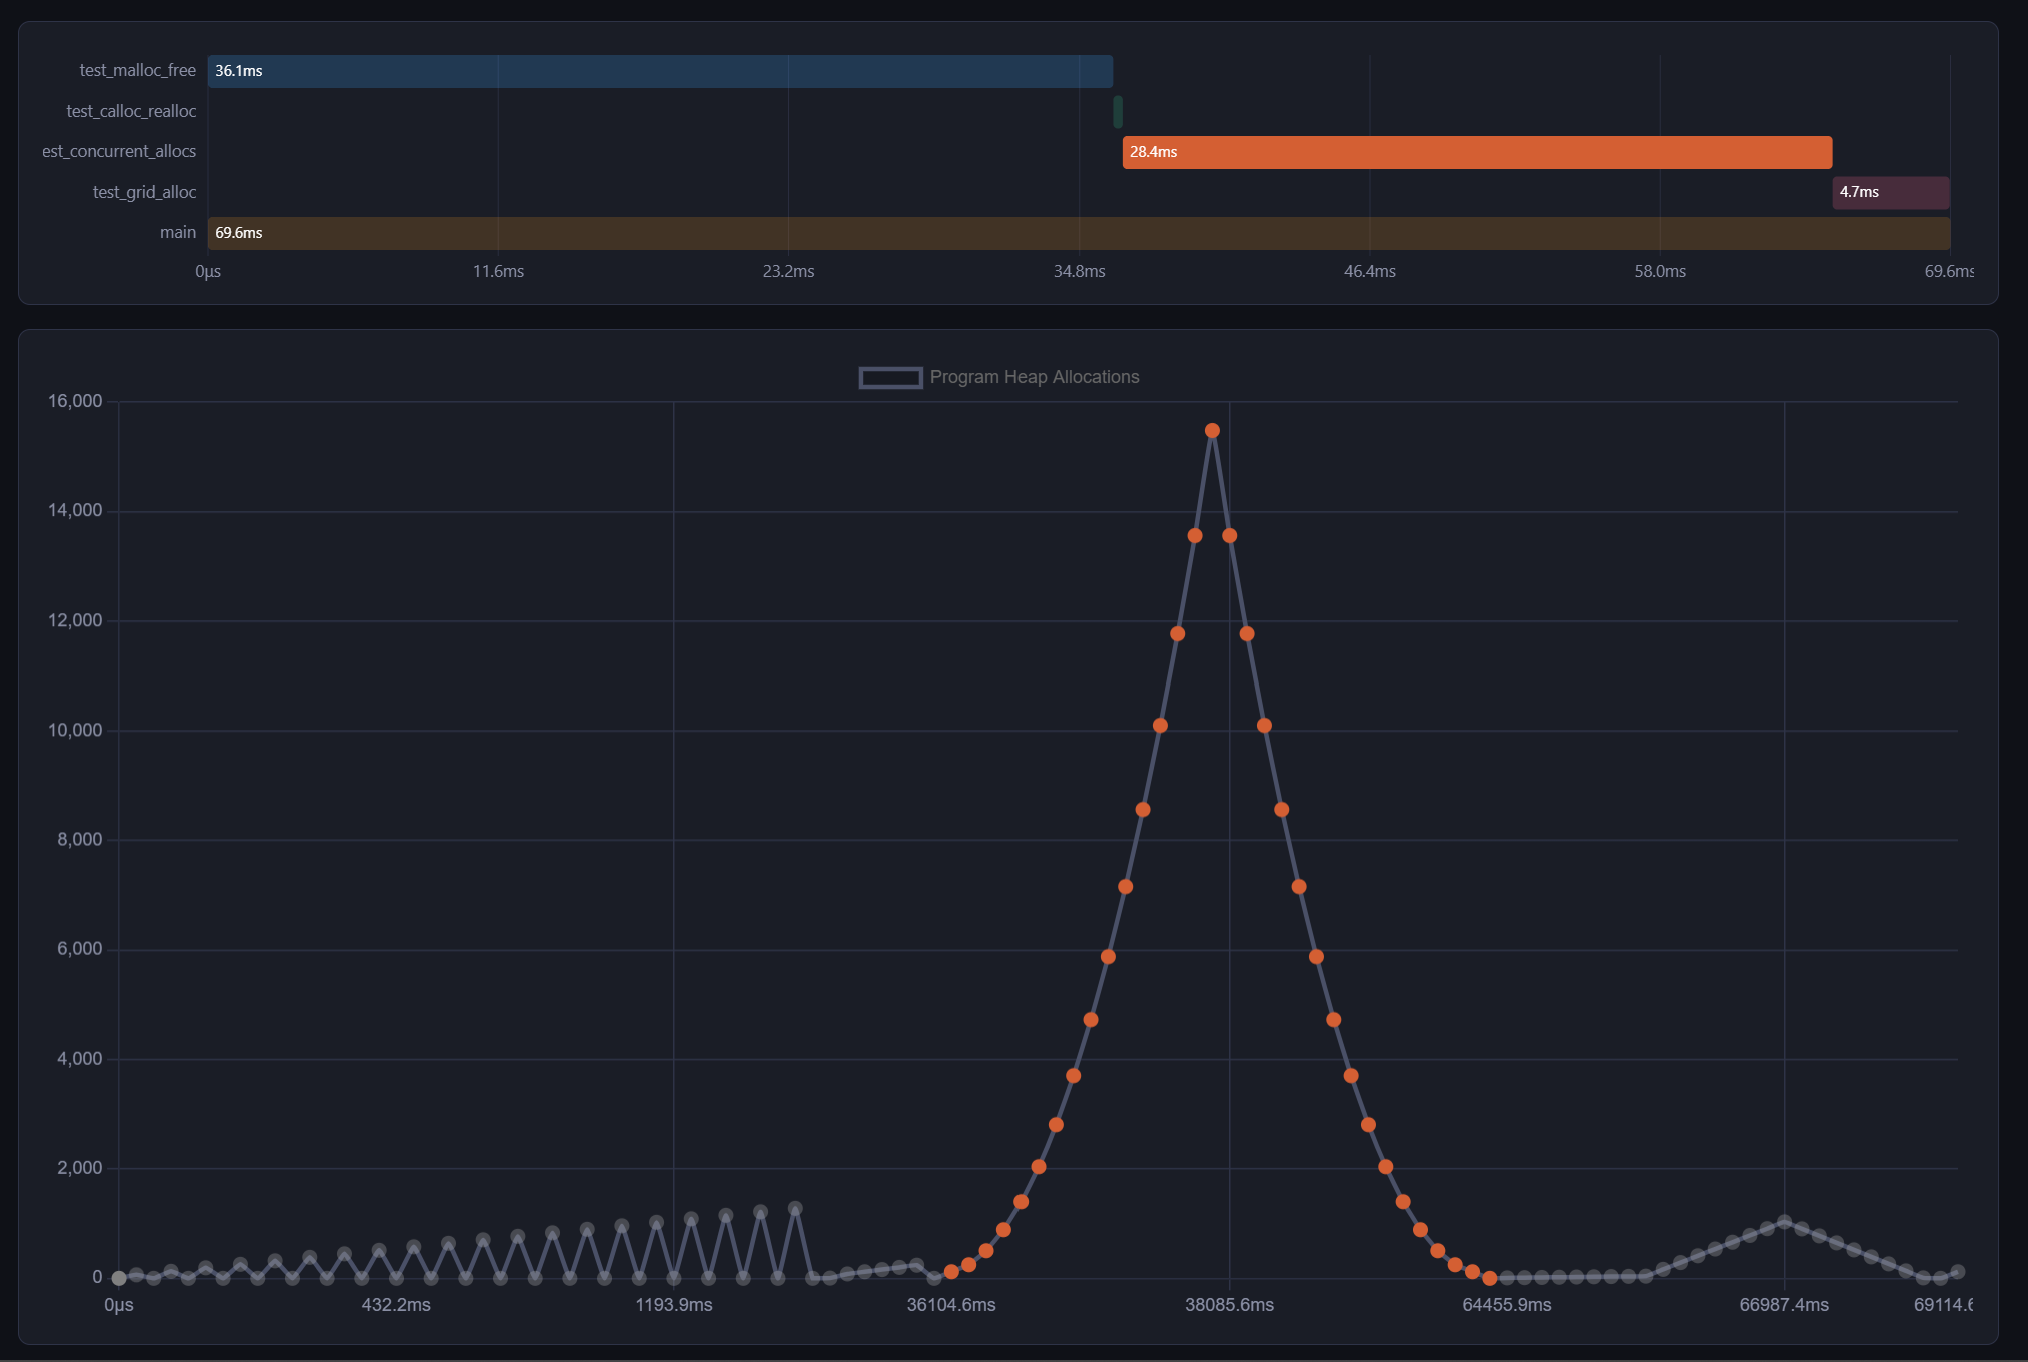
Heap graph of a large program, zoomed in.
-
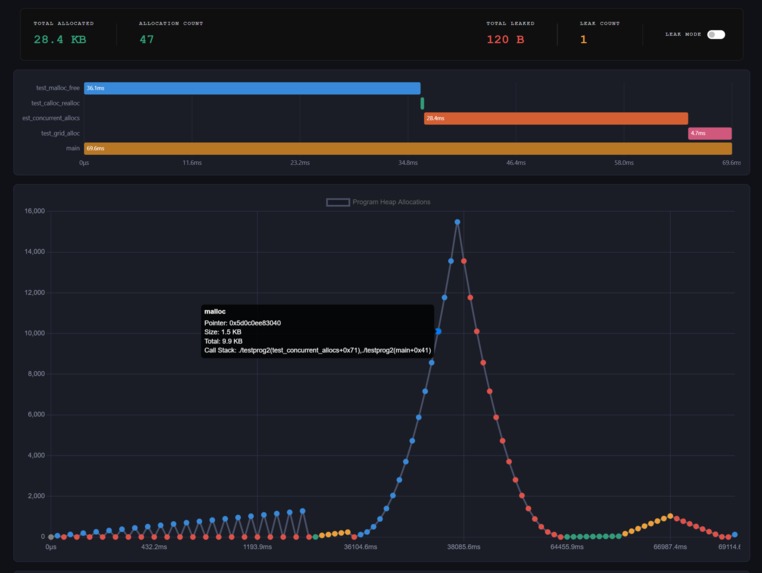
Heap graph with a specific function highlighted.
-
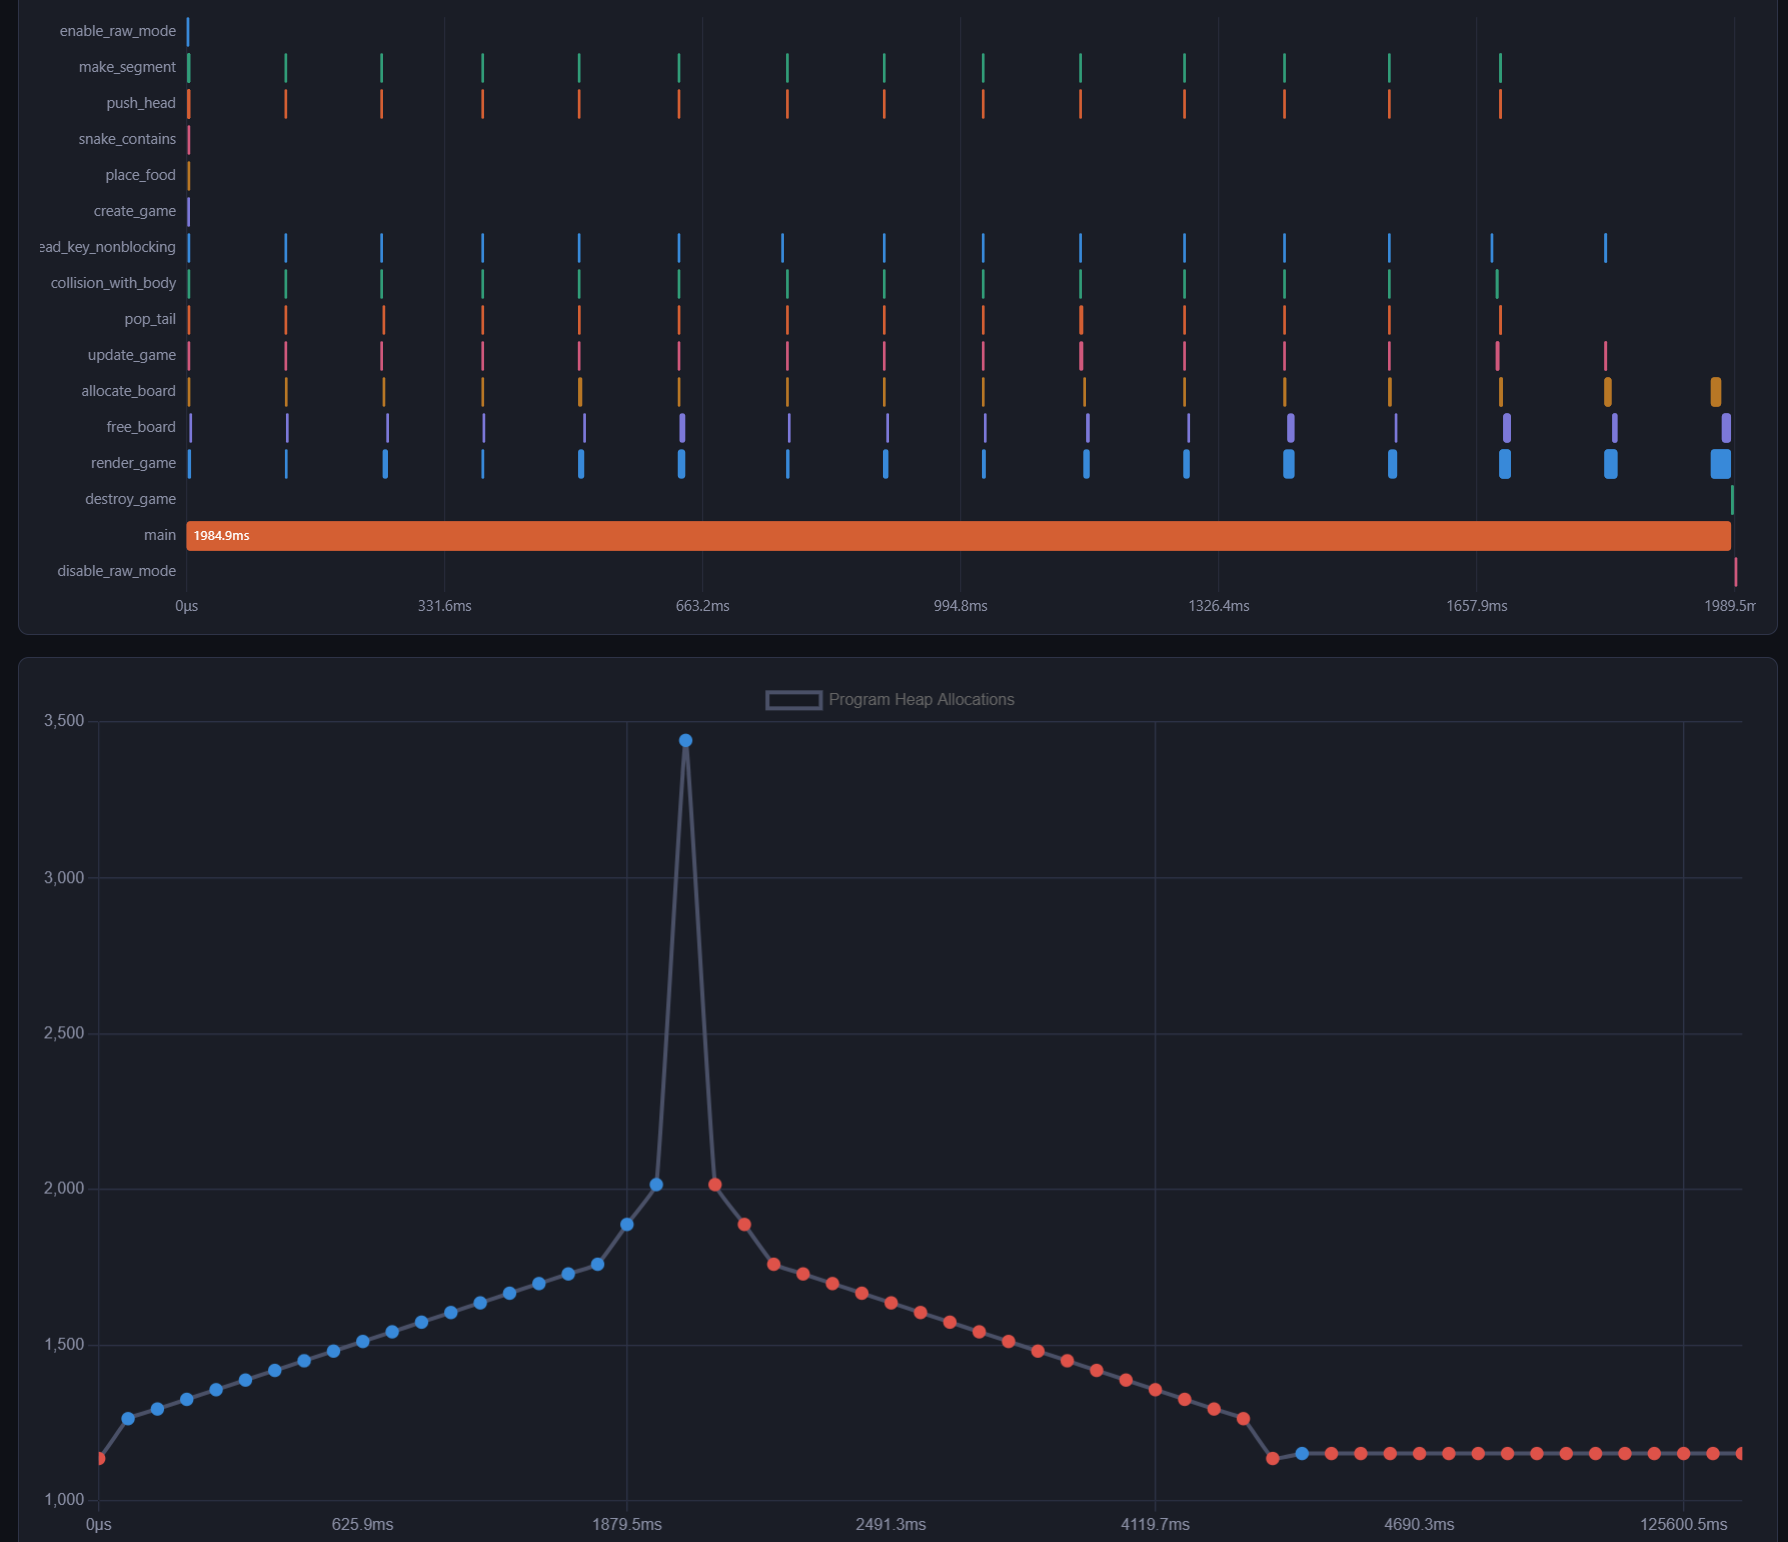
Heap graph with tooltip.

Inspiration
C is a notoriously tricky beast. Often, it's the first language students learn that involves dynamic memory management. Because of this, it can be difficult for beginners (and experts alike!) to keep track of complex pointers and abstract heap memory. That's why we built Memory Visualizer (memvis)!
What it does
Memvis is divided into two parts, a profiler and a visualizer. Running the profiling tool against a compiled C program will generate a JSON file containing statistics about it. Uploading this JSON file to our intuitive visualizer software will display heaps (get it?) of helpful information about your program!
Memvis helps you to identify and eliminate memory leaks, rogue functions, and otherwise mischief-making pieces of code.
How to compile
To compile Memvis, we have provided a cmake file that will get you 95 percent of the way there. The cmake file compiles our backend components, including the memvis runner binary and the allocation and funciton call wrapping library. In order to interface your binary, we have also included an interface of compiler and linker flags in our cmake file, instrumentation_flags, that are needed for the wrapper library to work. To compile your binary, use our cmake file and include the instrumentation_flags library.
How we built it
Memvis is built on a backend written in C, which handles the profiling and data generation. The frontend is written in JavaScript which takes care of parsing the input data and visualizing your program.
Challenges we ran into
We overcame several challenges throughout the development of Memvis. One of which had to do with ensuring the memory allocation functions in stdlib.h were not being called from within our profiler. This would result in a quick stack overflow or segmentation fault. A lot of our time was spent in GDB looking at which functions were calling malloc.
Accomplishments that we're proud of
We are proud to present an application that we agree we could actually use in our development journey. We are proud to hve come away from HooHacks with an MVP that can be deployed immediately on simple projects, and with small refinements, will be able to help visualize the memory contraints of large projects.
What's next for Memory Visualizer
The two biggest issues we want to tackle next are making our program thread safe, and expanding the scale at which it can be deployed. First, we have observed that some of our wrapping functions do not play nicely with posix calls. This prevents us from spawning additional threads. To further the issue, many of our data structures are not yet thread safe. To truly analyze real world application, we need to improve the thread safety of our application in improve the robustness of our wrapping calls. Next, we need to increase the scope of variables we test and the size of binaries we use. We noticed during testing that our visualizer fails to consider allocation methods such as alligned_alloc, posix_memalign, or any non-traditional allocation methods. For completeness, we should increase the number of tracked functions we track. We then need to test our program on larger binaries with more complicated topology to test the limits of our visualization tool.
Built With
- c
- chartjs
- cmake
- javascript

Log in or sign up for Devpost to join the conversation.