-
-
-
-
-
-
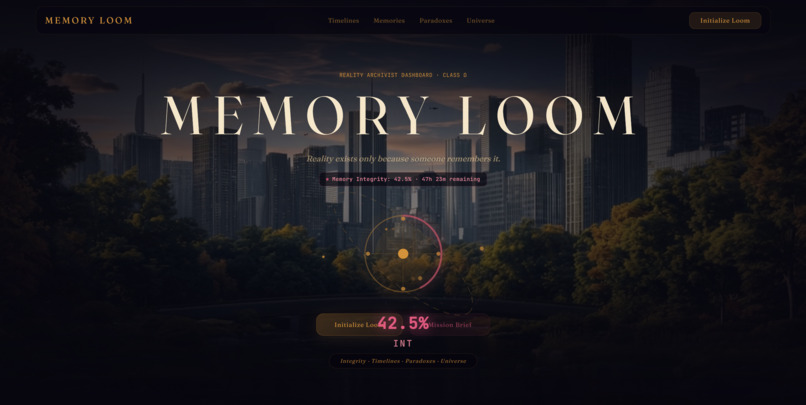
Main Page
💡 Inspiration The inspiration behind Memory Loom stems from a haunting philosophical question: If no one is left to remember an era, did it ever really happen?
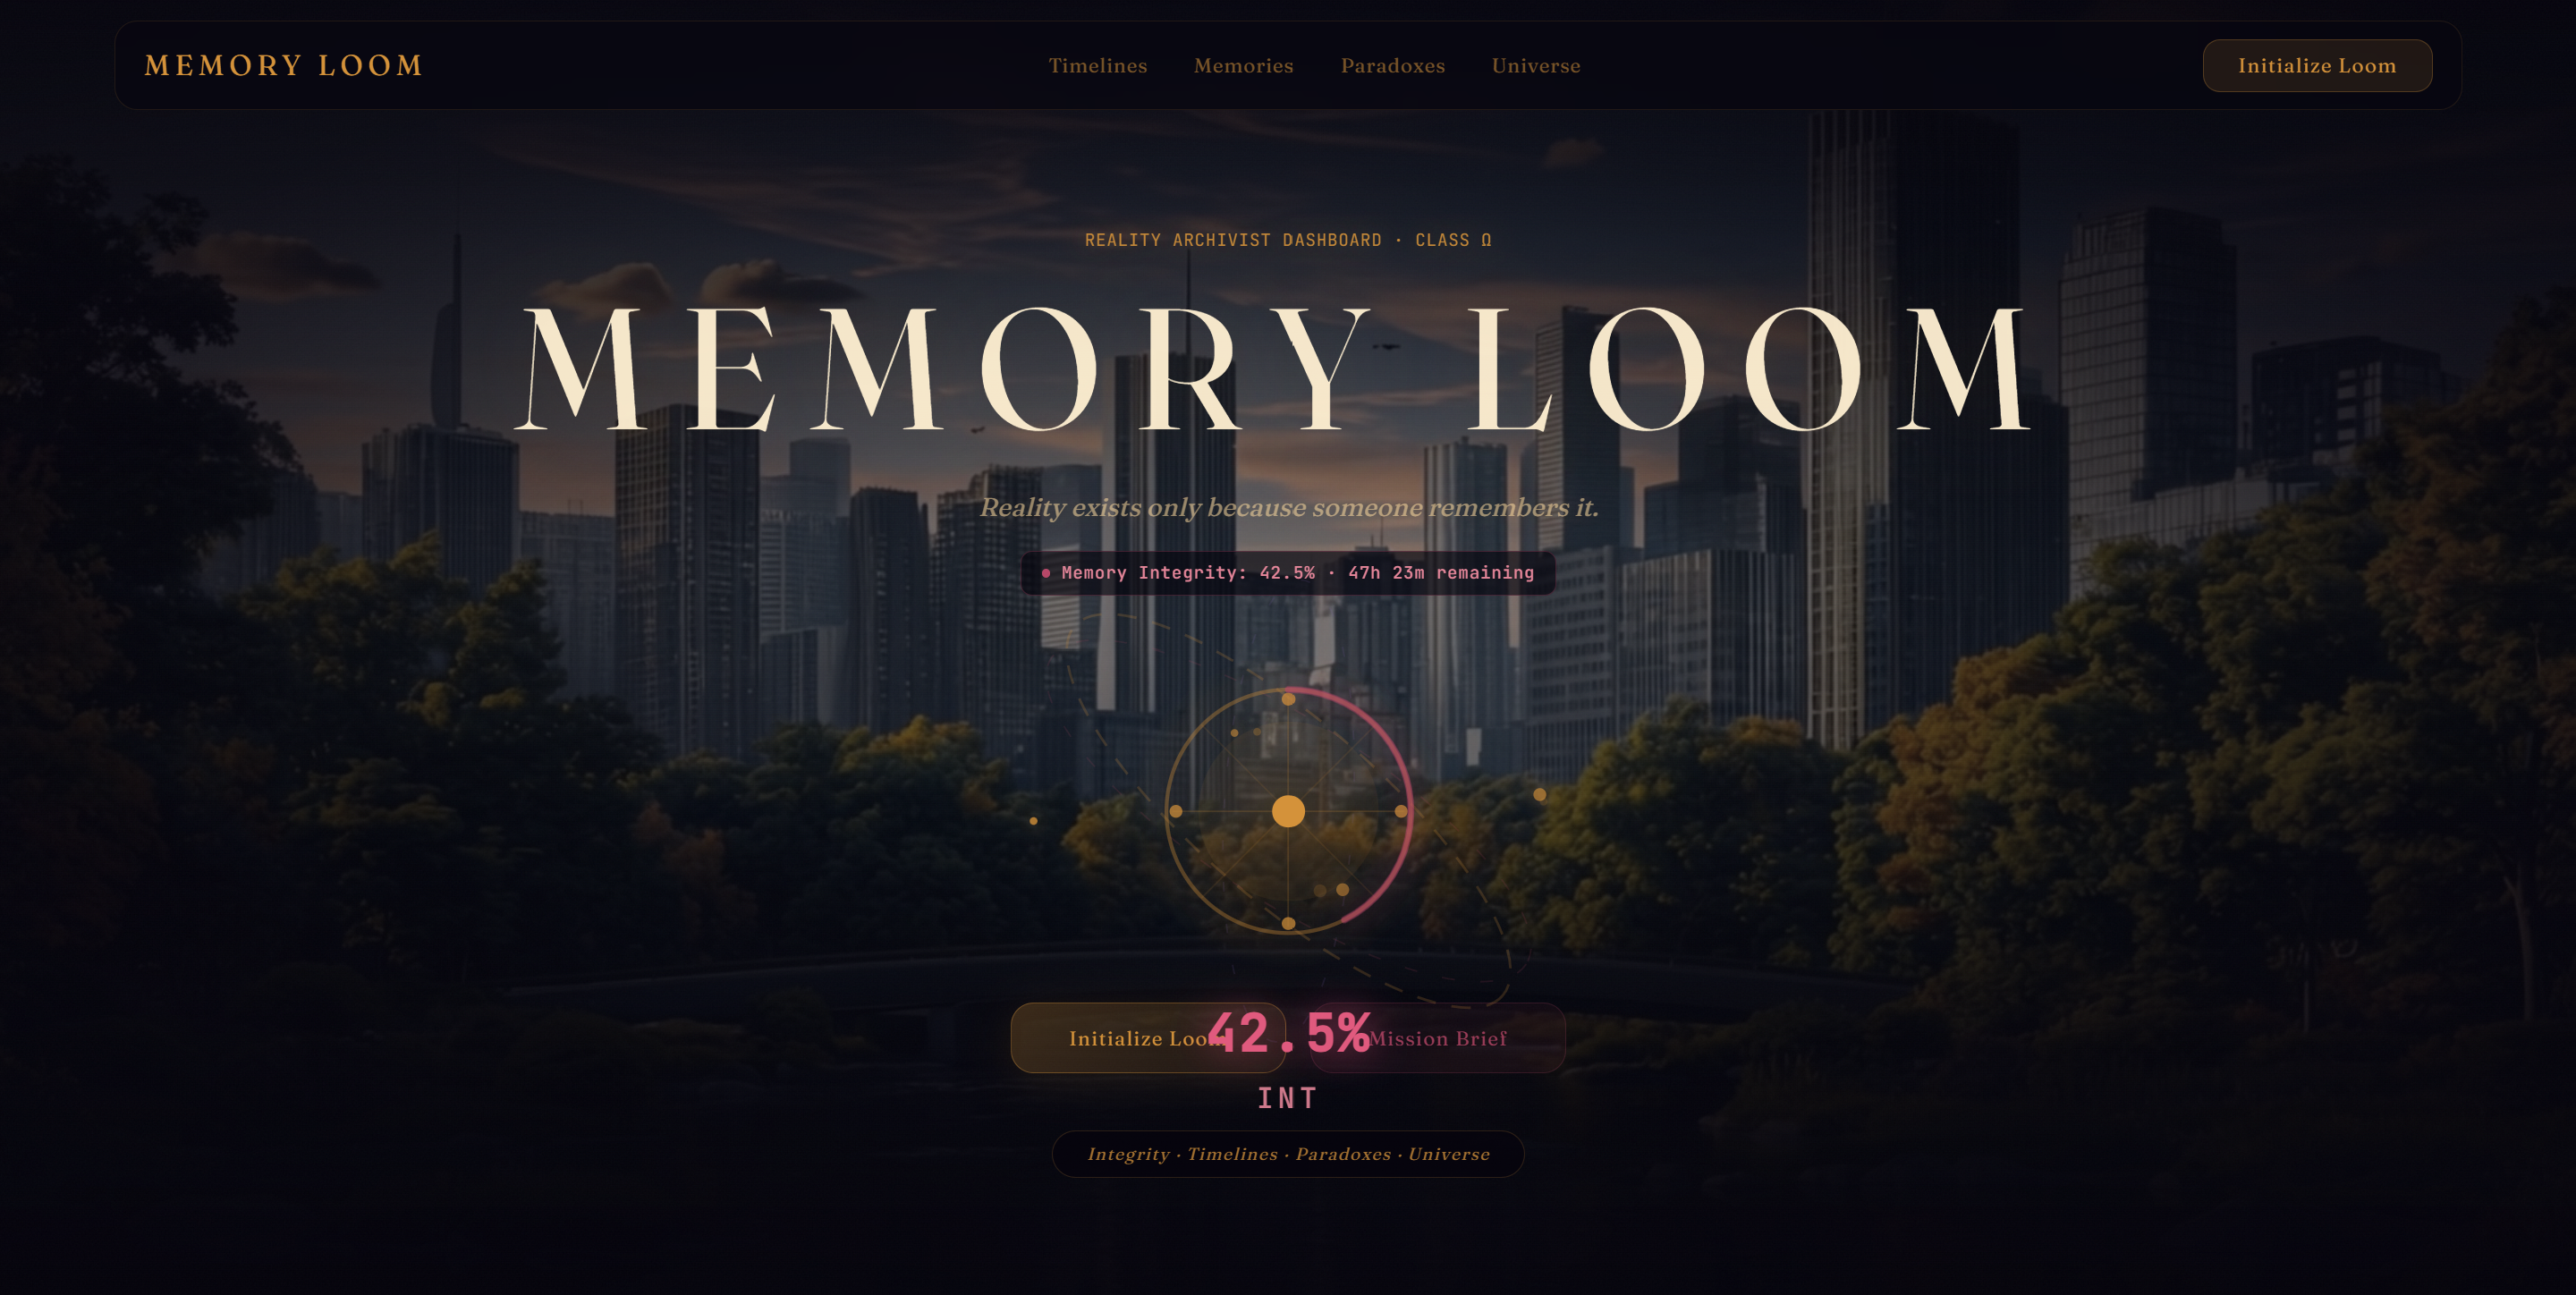
We wanted to subvert the standard "SaaS metrics dashboard" by placing the user at the helm of an existential command console—a Class-Ω Reality Archivist Terminal. Drawing inspiration from retro-futuristic mission control consoles (NASA flight director consoles, CRT telemetry, and cinematic speculative sci-fi), we set out to prove that deep narrative worldbuilding and production-grade, accessible UI/UX design can thrive together in a single web experience.
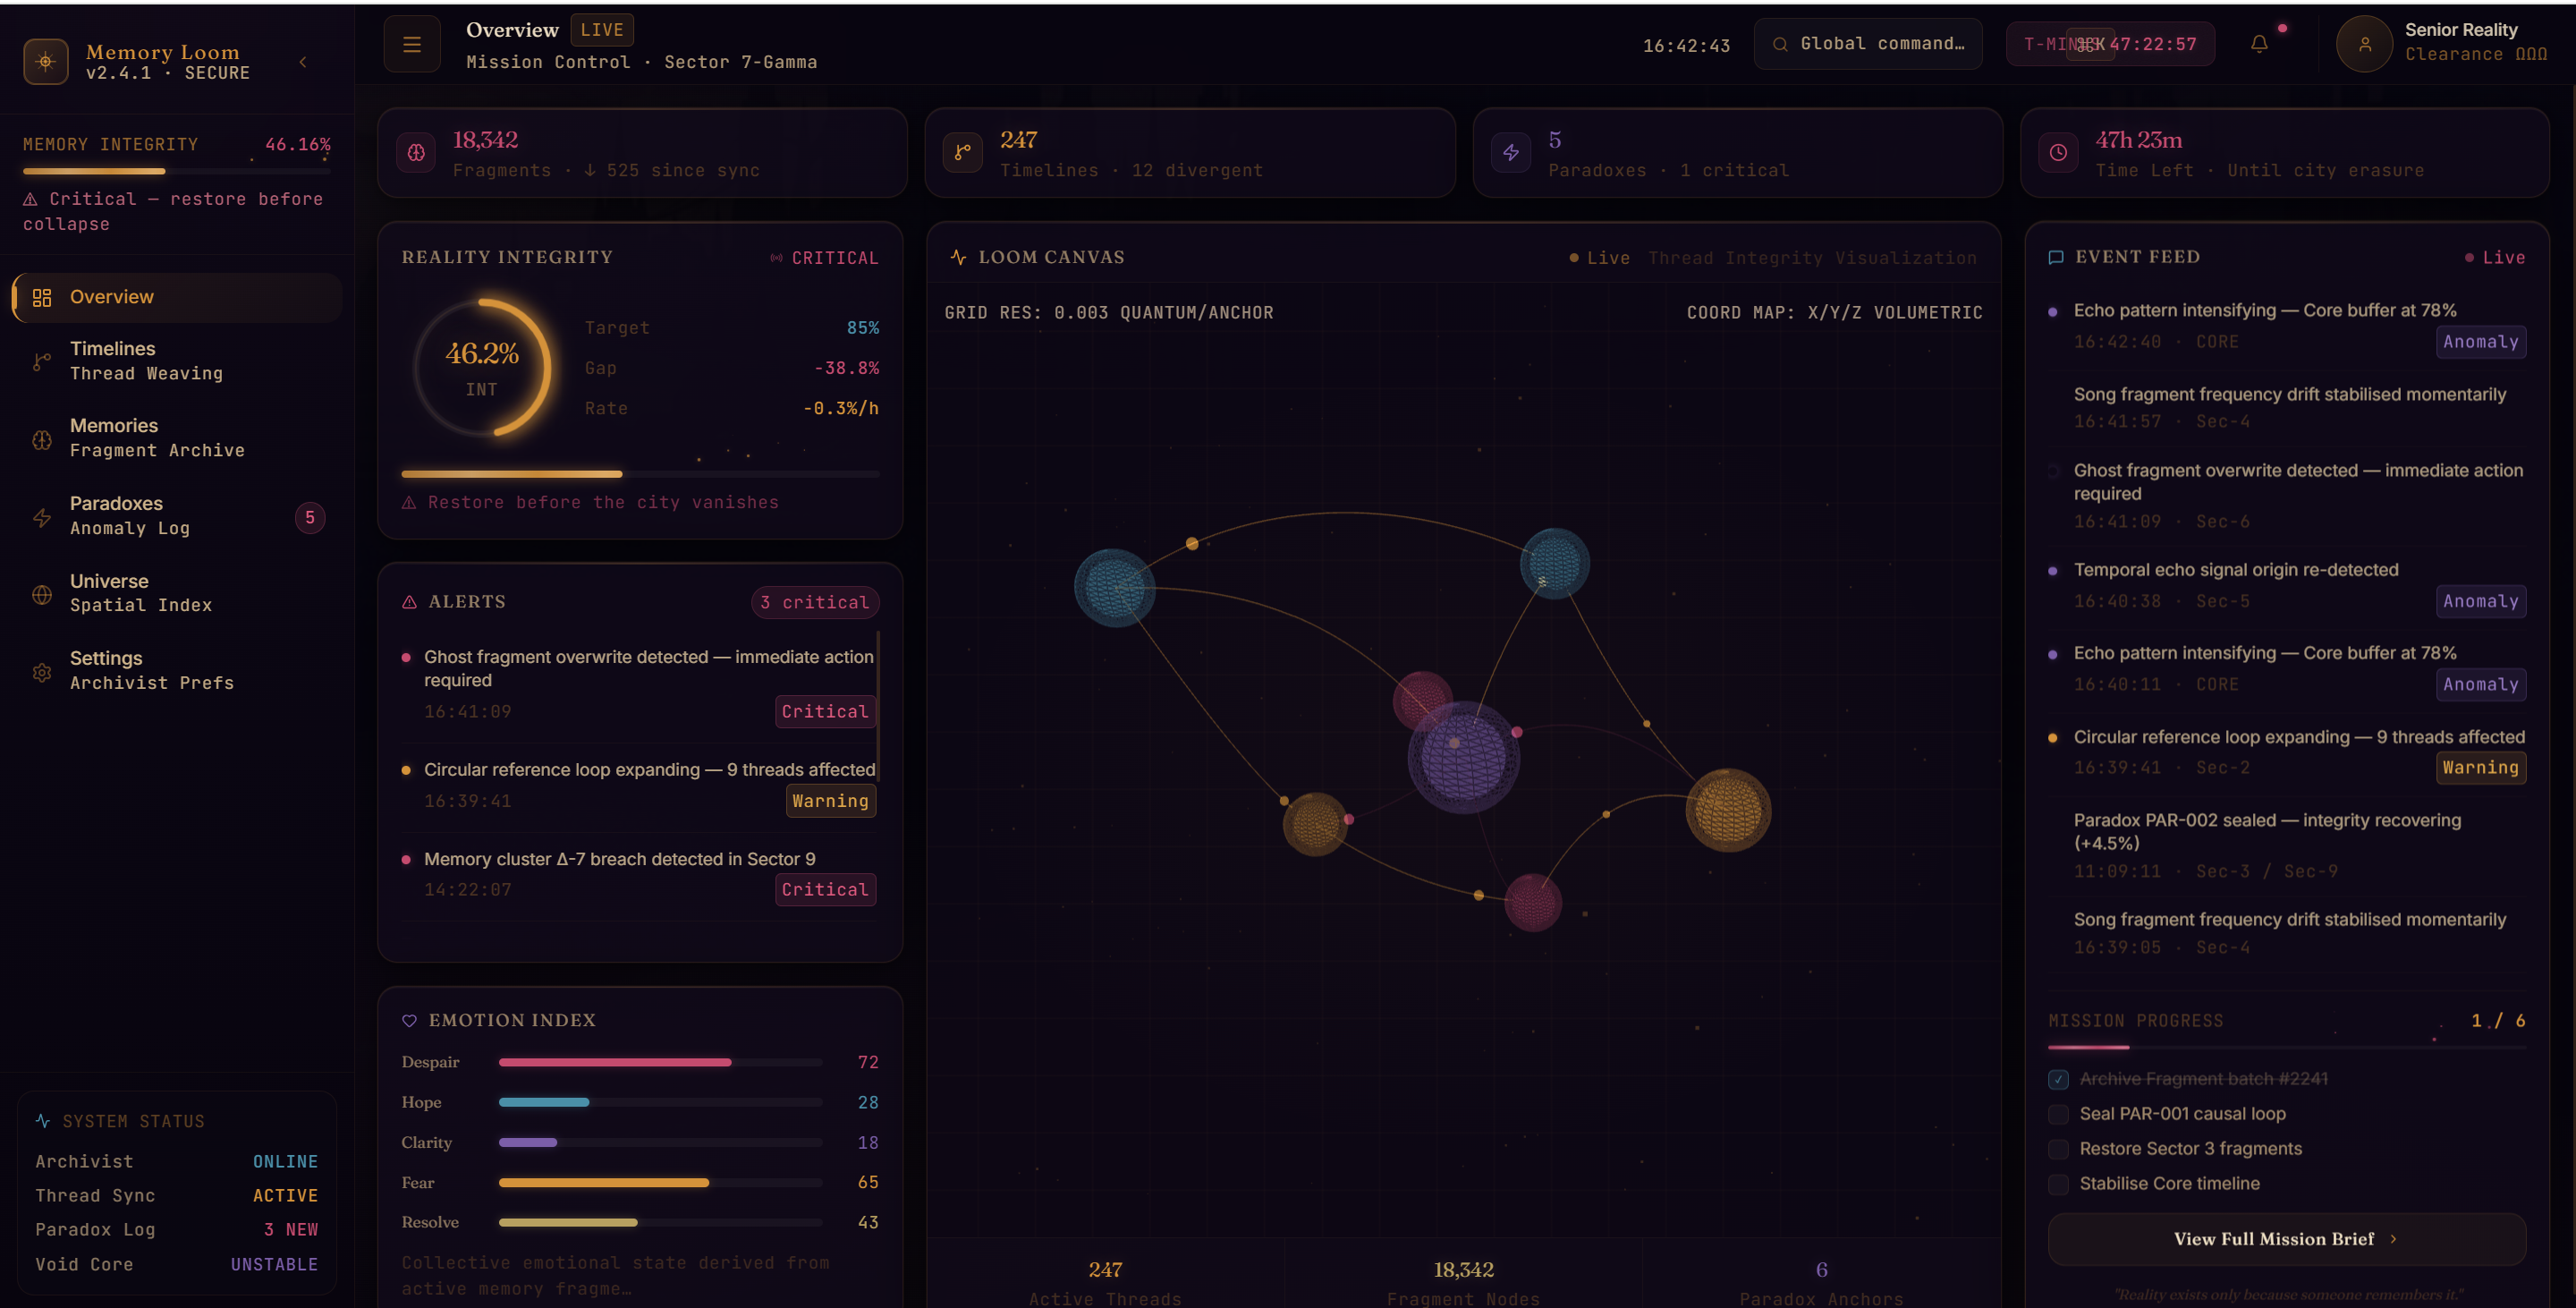
🚀 What It Does Memory Loom is an interactive, dark-themed mission control dashboard that monitors and stabilizes unraveling realities:
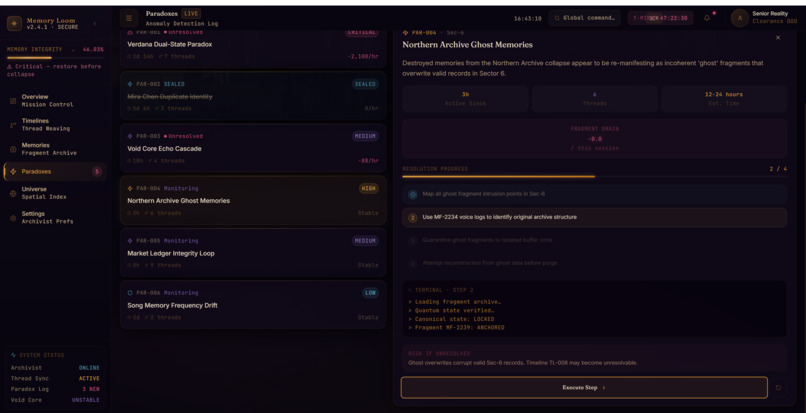
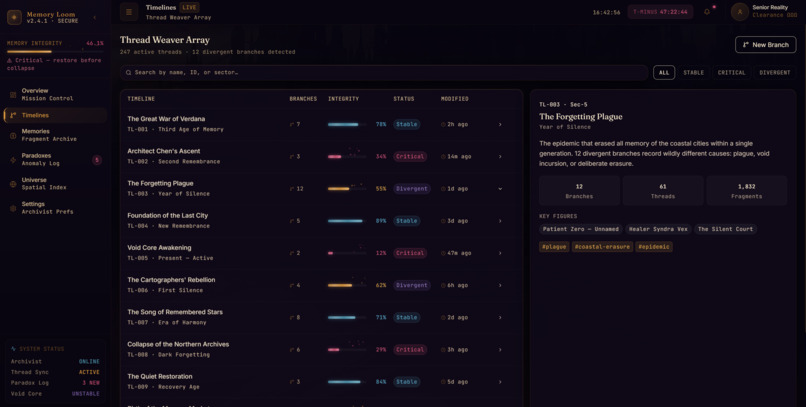
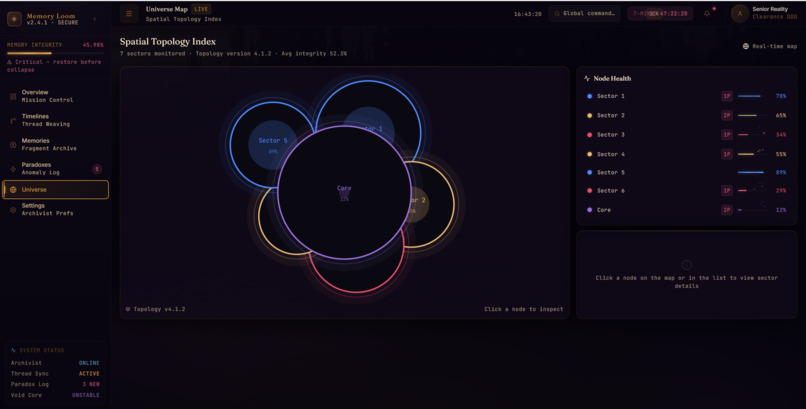
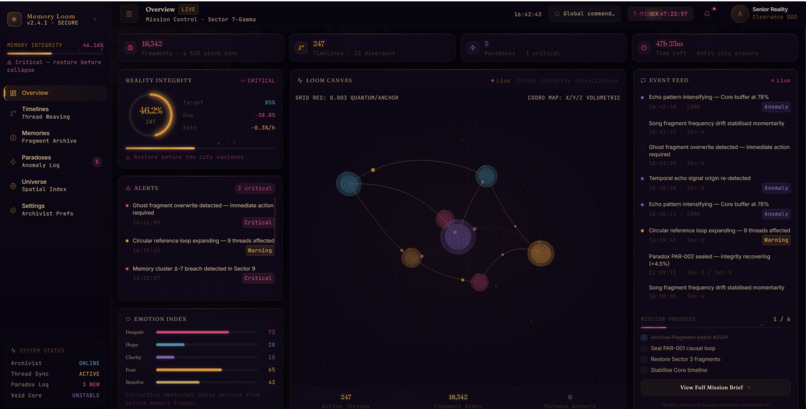
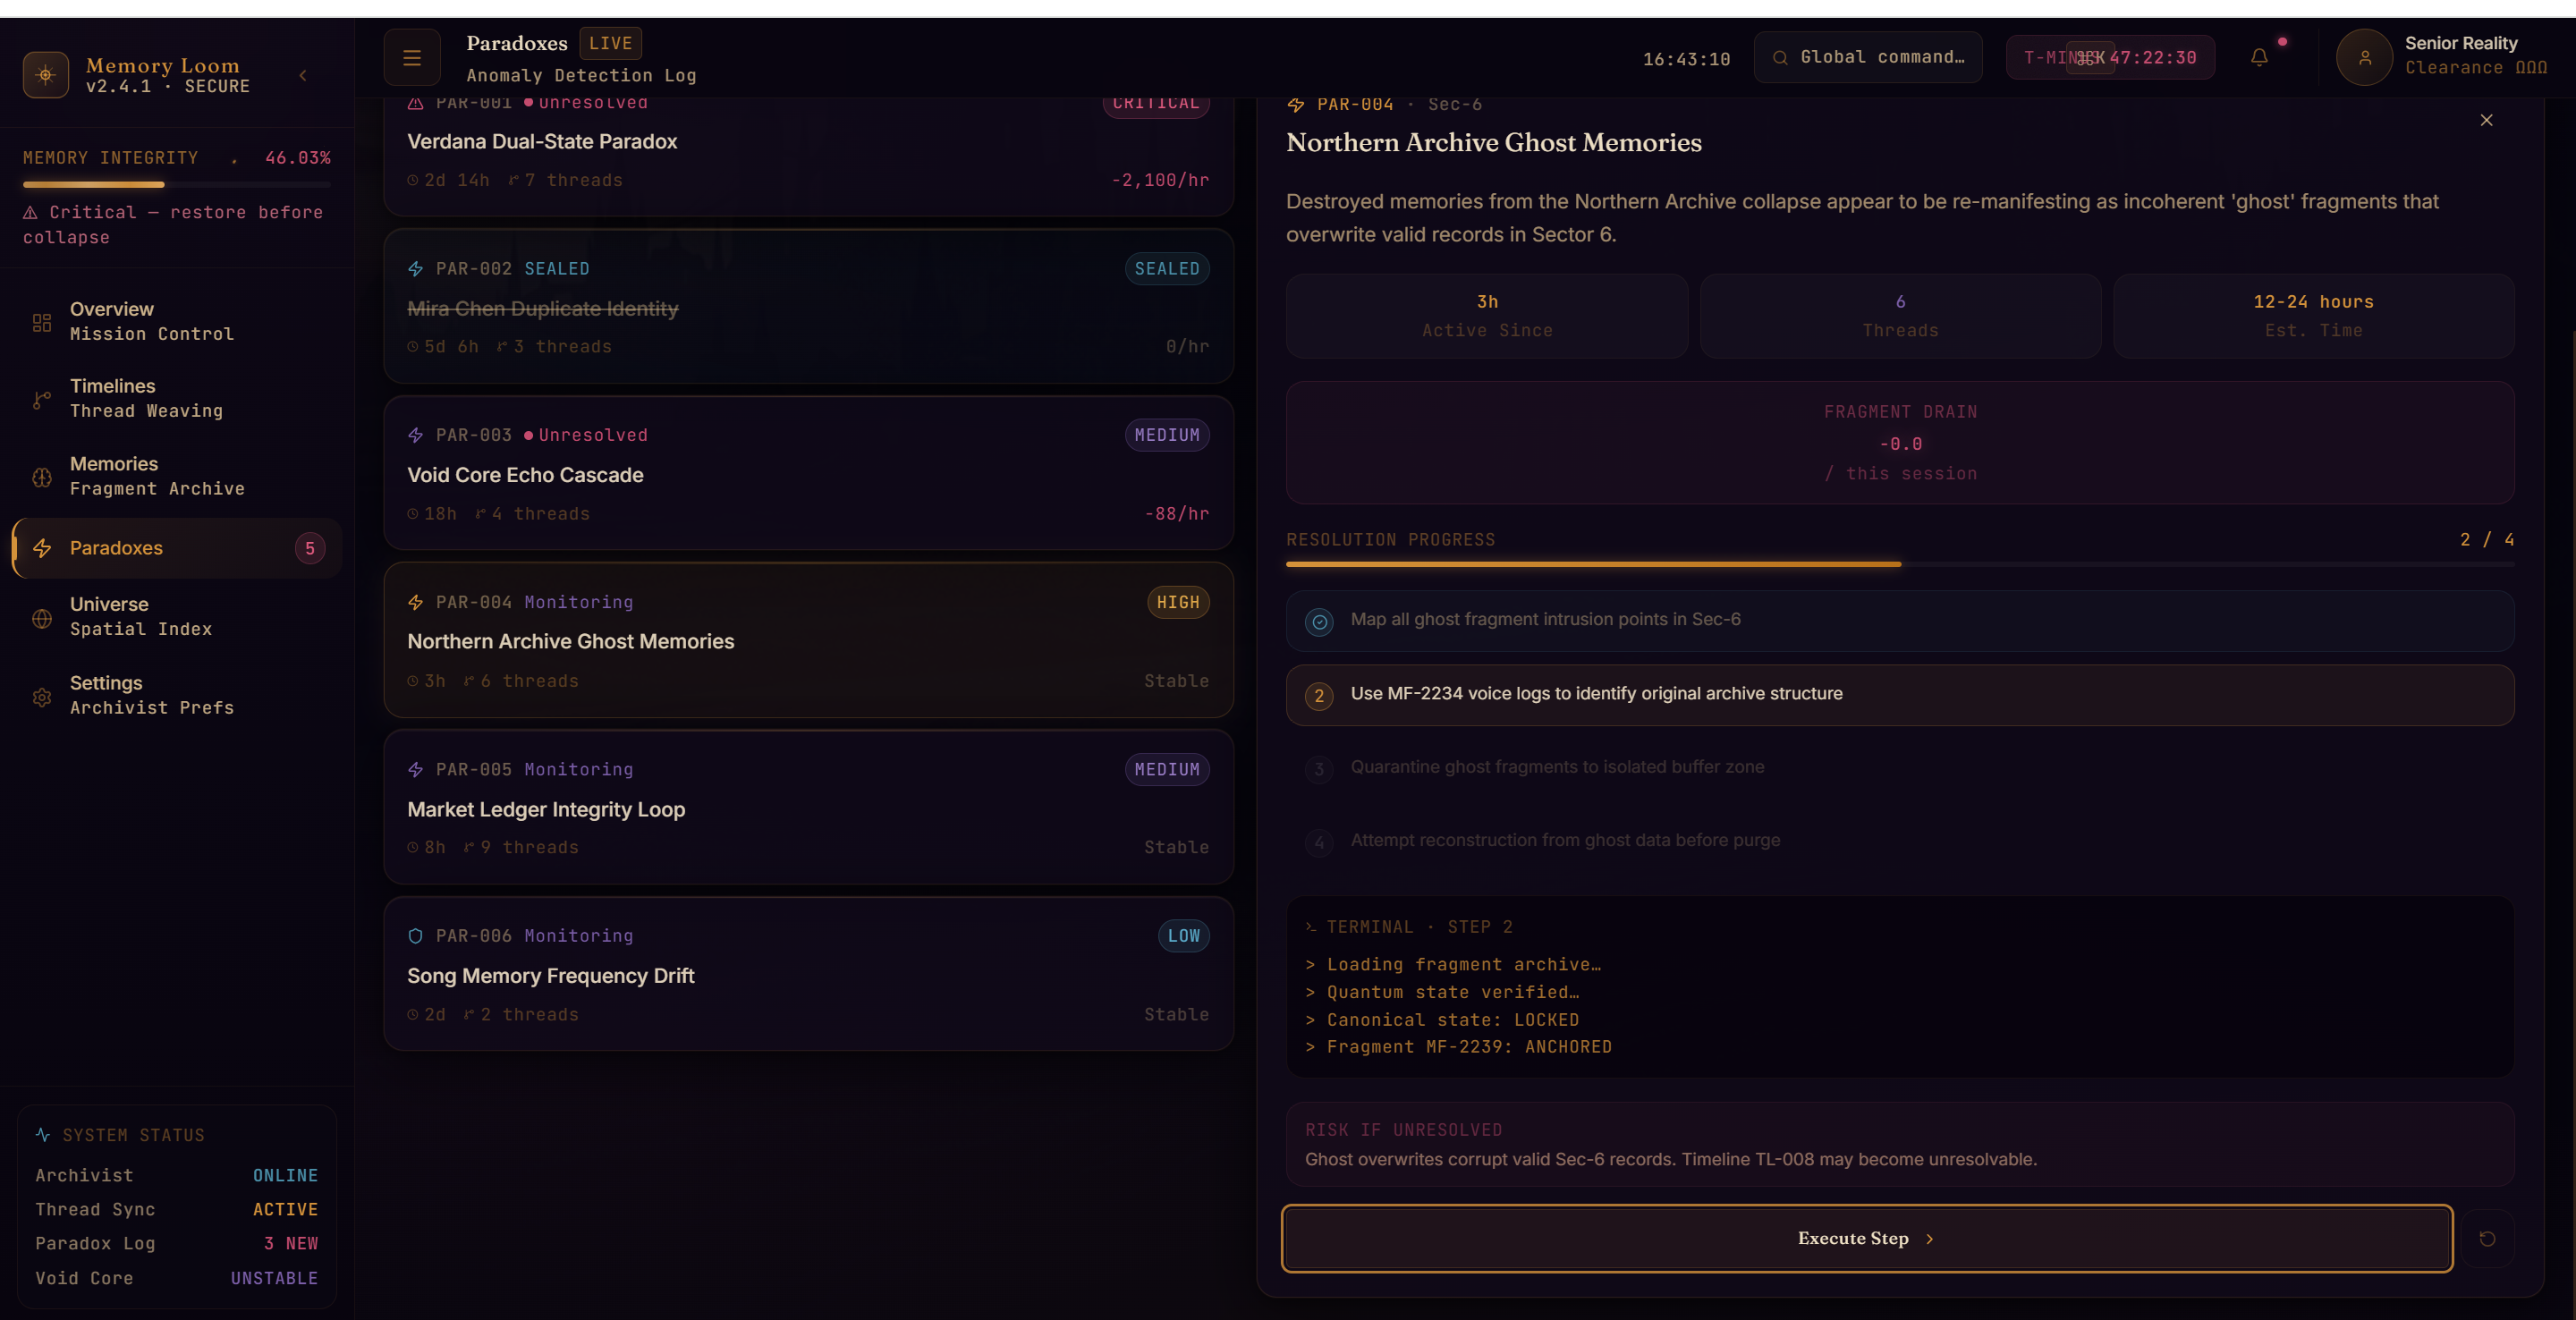
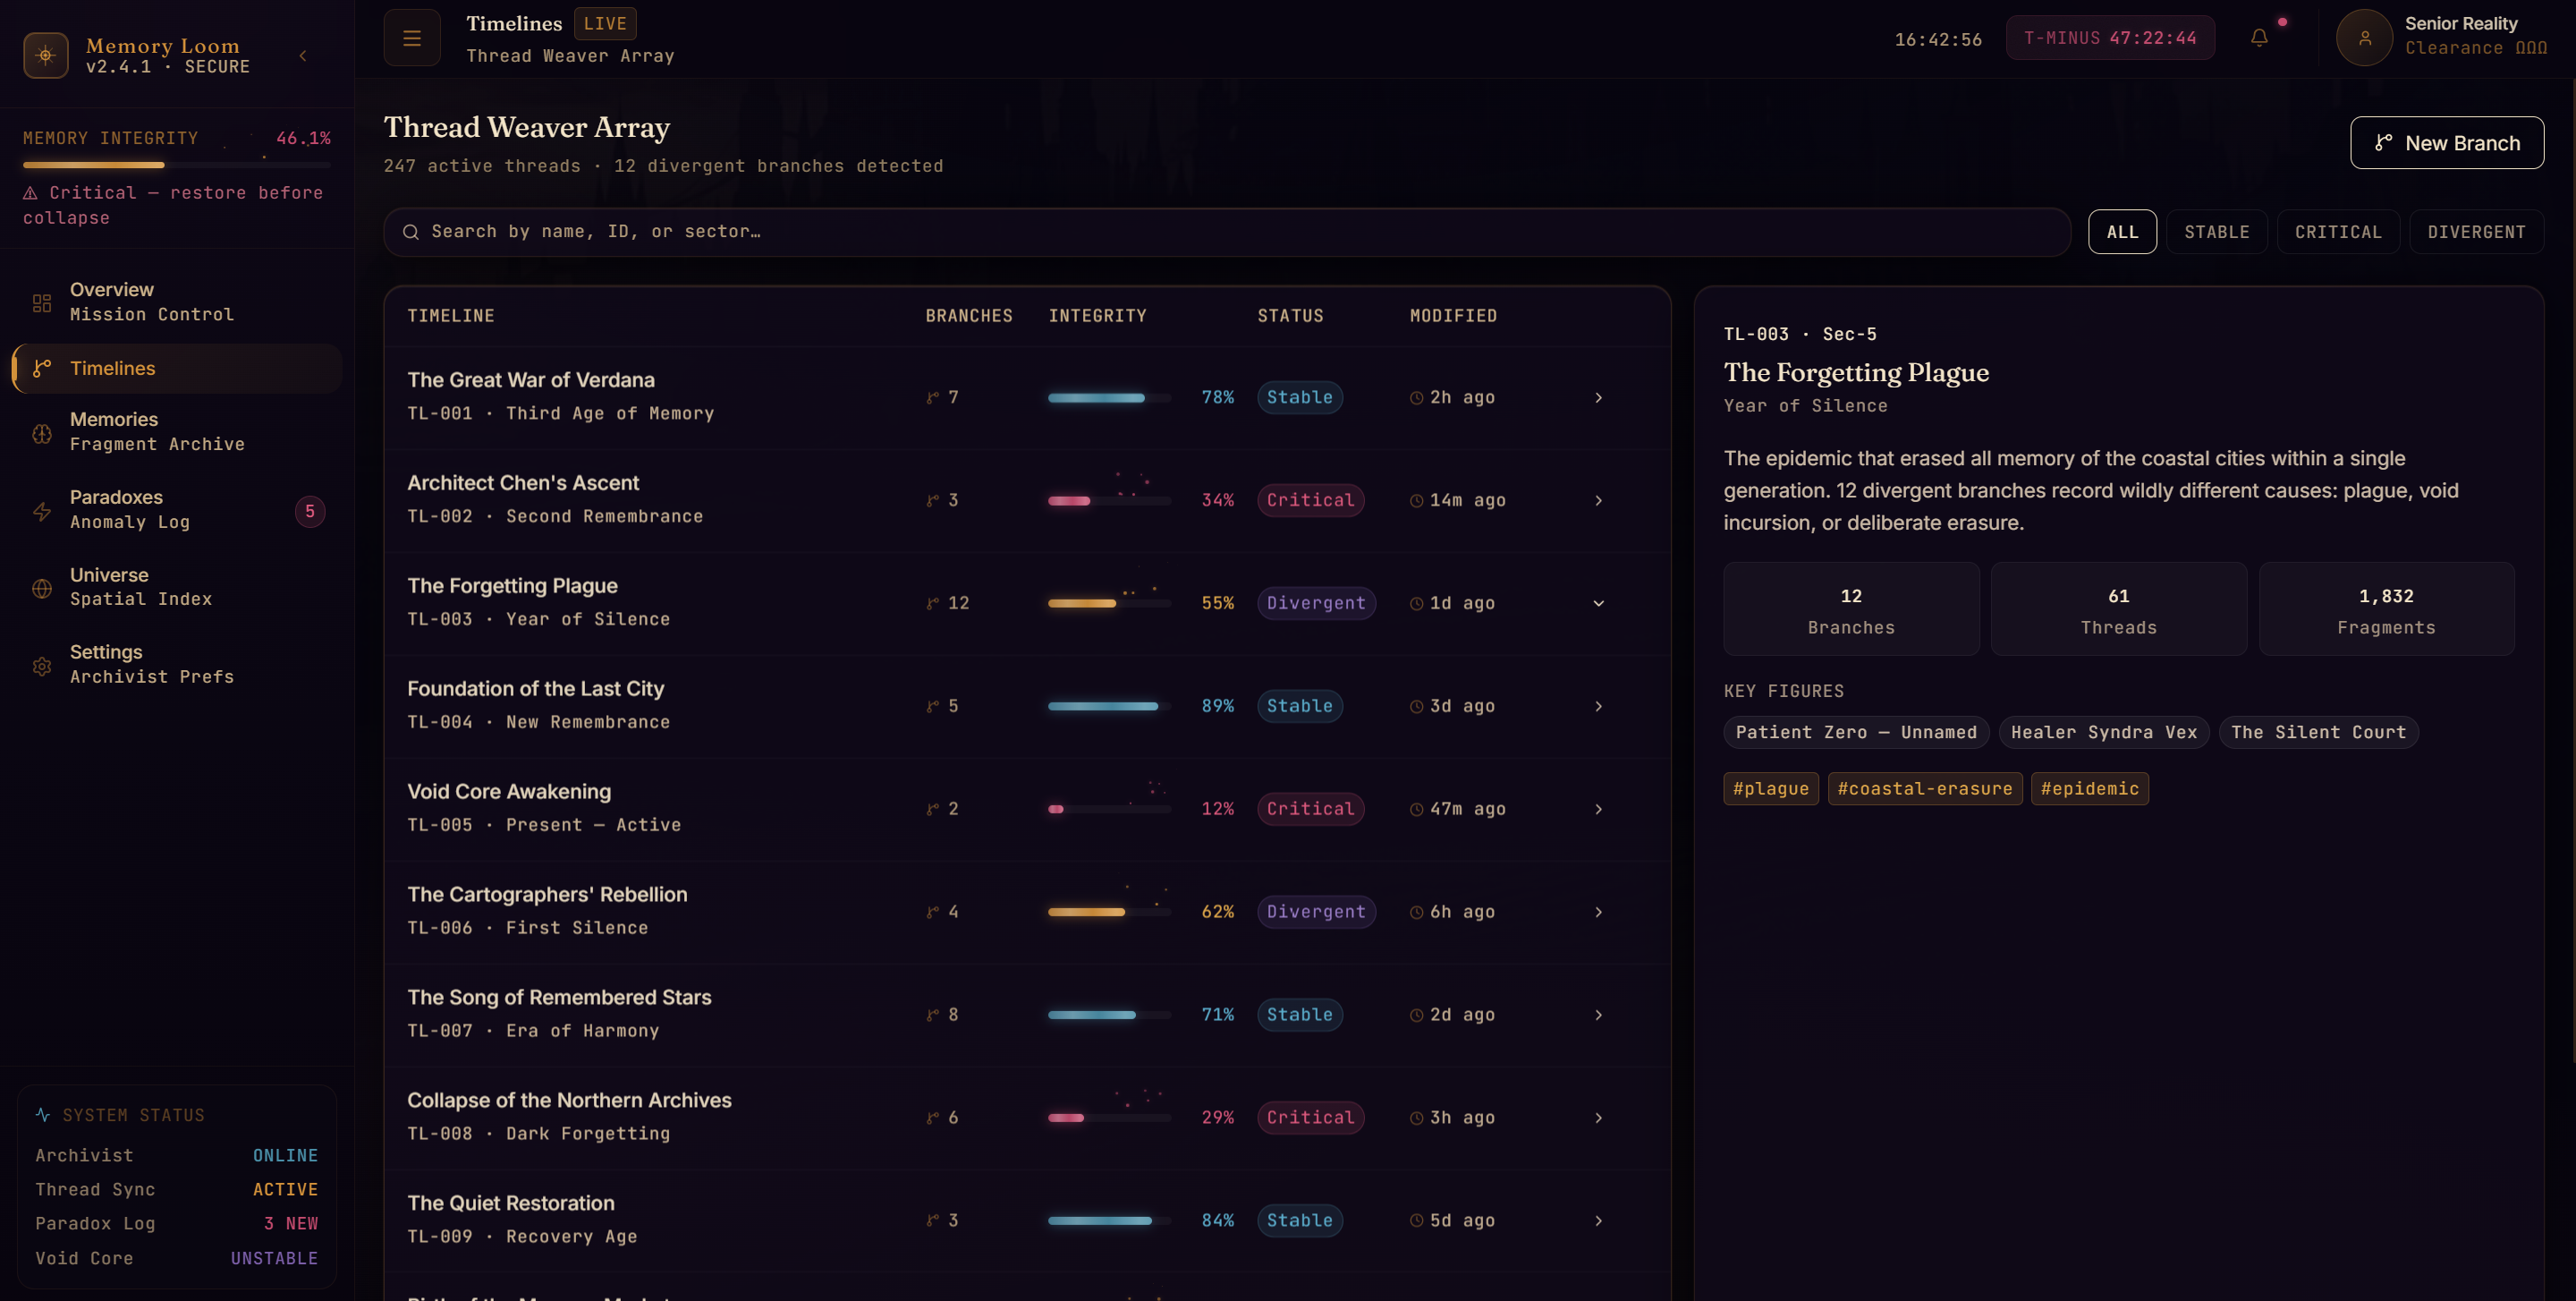
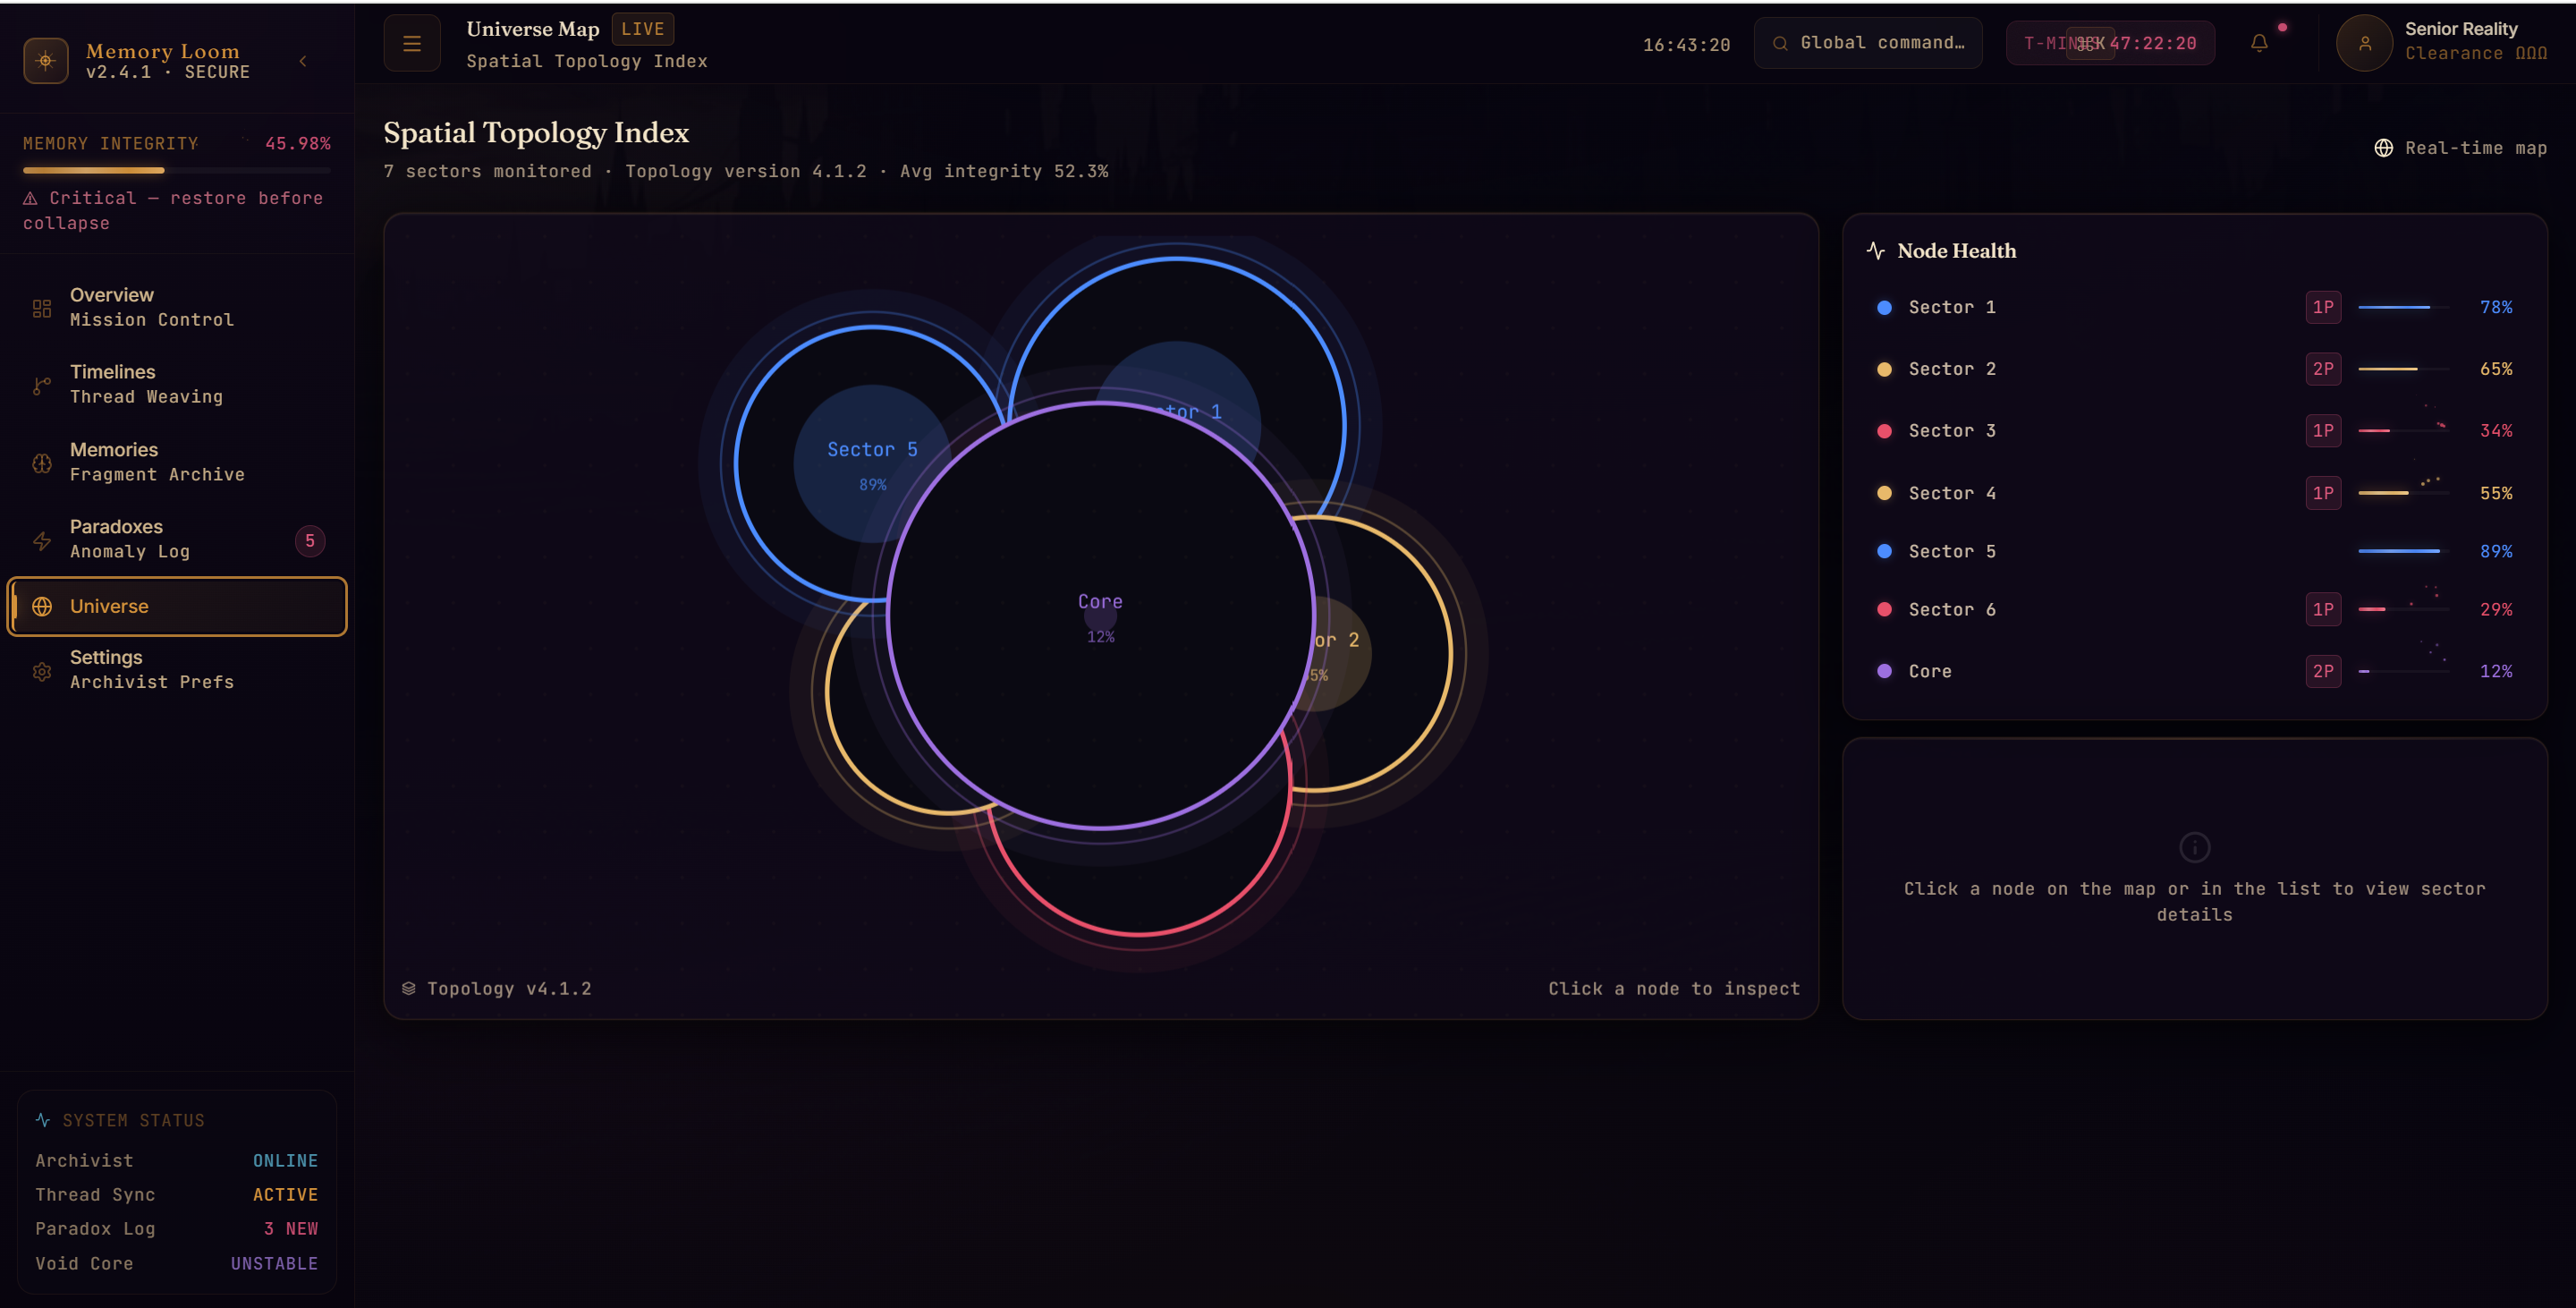
Cinematic Onboarding & Boot: An atmospheric landing hero featuring a 3D Memory Core and reality-erasure dissolve effects, transitioning into an authentic terminal boot sequence with automated diagnostic routines and one-click skip functionality. Live Mission Control (/overview): A volumetric 3D WebGL Loom Canvas rendering quantum thread constellations that dynamically tremble, shift hues, and decay as live integrity fluctuates. Thread Weaver Array (/timelines): An era-by-era timeline registry featuring scannable branch tracking, interactive row-level inspection, and glowing thermal EmberBars. Fragment Archive (/memories): A searchable archive indexing historical records across 17 distinct classifications, equipped with an accessible category chip system and popover dropdown. Anomaly Detection Lab (/paradoxes): An interactive paradox resolution station with terminal diagnostic feeds, confirmation gates, radial countdown locks, and live fragment drain meters. Spatial Topology Index (/universe-map): An interactive topological node graph depicting sector anchors and thread coupling strength. 🛠️ How We Built It Frontend Architecture: Built on React 19 and bundled with Vite 8 for near-instant hot module replacement and lean production builds. 3D Volumetric Canvas: Created with vanilla Three.js, implementing procedural particle dust, orbital cameras, and dynamic spline curves that map temporal threads directly to live simulation state without unmounting the WebGL context. Design System & Styling: Engineered using Tailwind CSS 4 augmented with custom CSS variables and utility tokens. We paired a high-contrast serif display font (Fraunces) with a crisp engineering monospace font (JetBrains Mono) to evoke an authentic archivist terminal aesthetic. State & Simulation Engine: Powered by a centralized React Context (SimulatorContext) driving real-time state mutations—including decaying memory integrity, ticking mission countdown clocks, and multi-stage paradox sealing state machines. Routing & Session Memory: Managed with React Router DOM 7, leveraging sessionStorage to gracefully transition first-time visitors through the boot sequence while routing returning archivists directly into mission control. 🏔️ Challenges We Faced Balancing Atmospheric Mood with WCAG 2.1 AA Contrast: Dark sci-fi interfaces often suffer from unreadable grey-on-black text. Achieving a moody, film-grain aesthetic while ensuring every single table header, card ID, subtitle, and input placeholder met or exceeded the strict 4.5:1 WCAG AA contrast ratio required rigorous mathematical color audits and custom token adjustments. Untangling Color Semantics: Originally, general memory categories (Personal, Military, Political) shared the same crimson/amber/teal hues as system alert statuses, creating visual clutter and false alarms. We decoupled them into muted, neutral outline badges, strictly reserving crimson for critical danger, amber for divergence, and teal for stability. Three.js Performance & React State Synchronization: Bridging reactive application state (decaying integrity and active anomalies) with the Three.js render loop without causing frame drops or React re-render thrashing required passing reactive state via mutable refs into the requestAnimationFrame loop. Mobile Scannability Without Page Overflow: Ensuring that complex data tables with 6 columns and multi-tiered metric cards scale gracefully down to 375px mobile screens required custom horizontal scroll containers and an off-canvas mobile drawer. 🧠 What We Learned Accessibility Enhances Aesthetic: We learned that adhering strictly to WCAG guidelines does not detract from dark, atmospheric design—it actually sharpens the visual hierarchy, making data denser and more readable at a glance. Motion Sensitivity Is Essential: Implementing prefers-reduced-motion across both CSS keyframe animations and 3D WebGL render loops taught us how to design graceful, static fallbacks that retain visual beauty without inducing motion sickness. Narrative-Driven UI Design: We discovered how subtle micro-animations (thermal ember particles, chevron hover nudges, and typewriter terminal lines) transform static dashboards into living,
Built With
- css
- html
- javascript
- lucide
- react
- three.js
- vercel
- vite


Log in or sign up for Devpost to join the conversation.