Inspiration
I'm an account manager at a venture firm and I run Claw Collective - a builder community launching across Vietnam and Southeast Asia. In both roles, my most important asset is my network. But I was managing it entirely in my head, scattered across Telegram, LinkedIn, Notion, Excel, and memory. The real problem isn't storing contacts. It's seeing them. Who connects to who. Which clusters exist. Who I should talk to before a meeting. No tool showed me that - they just gave me another spreadsheet. So I built Meesh: a visual relationship intelligence platform that turns your contact list into a living network graph.
What it does
Meesh lets you upload your contacts, map their relationships, and explore your entire network as an interactive graph — not a table and you can easily query it. The special thing here is that you can enrich the data using Tinyfish.
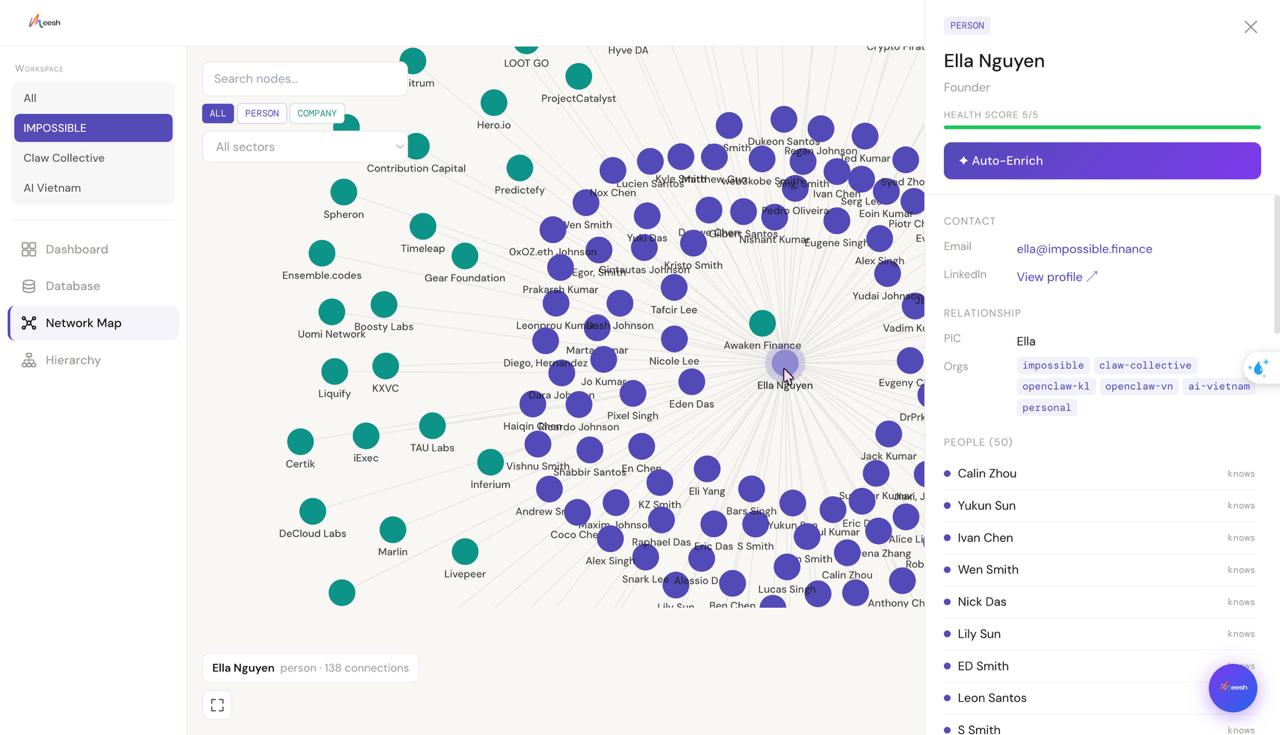
- Network graph view — force-directed, color-coded by node type, sized by connection count. Every person, company, and tag is a node. Every relationship is an edge.
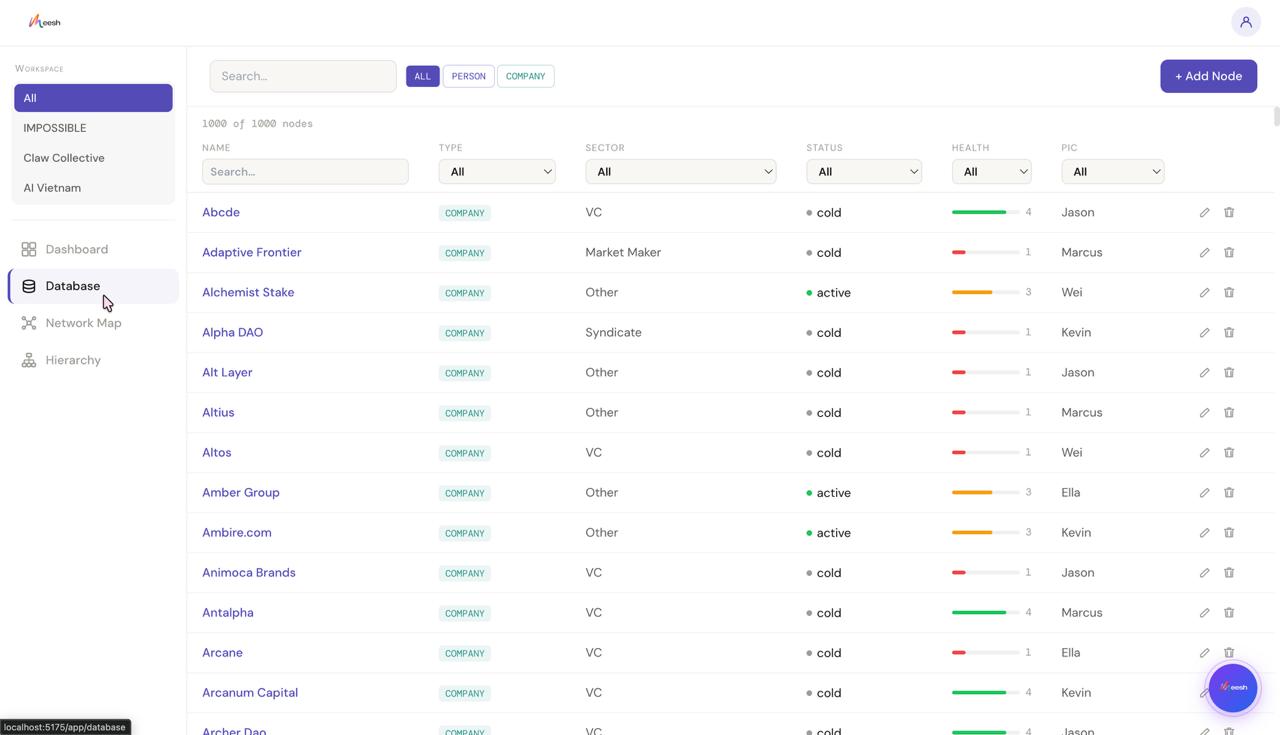
- Database tab — searchable, filterable table view of all nodes with inline editing
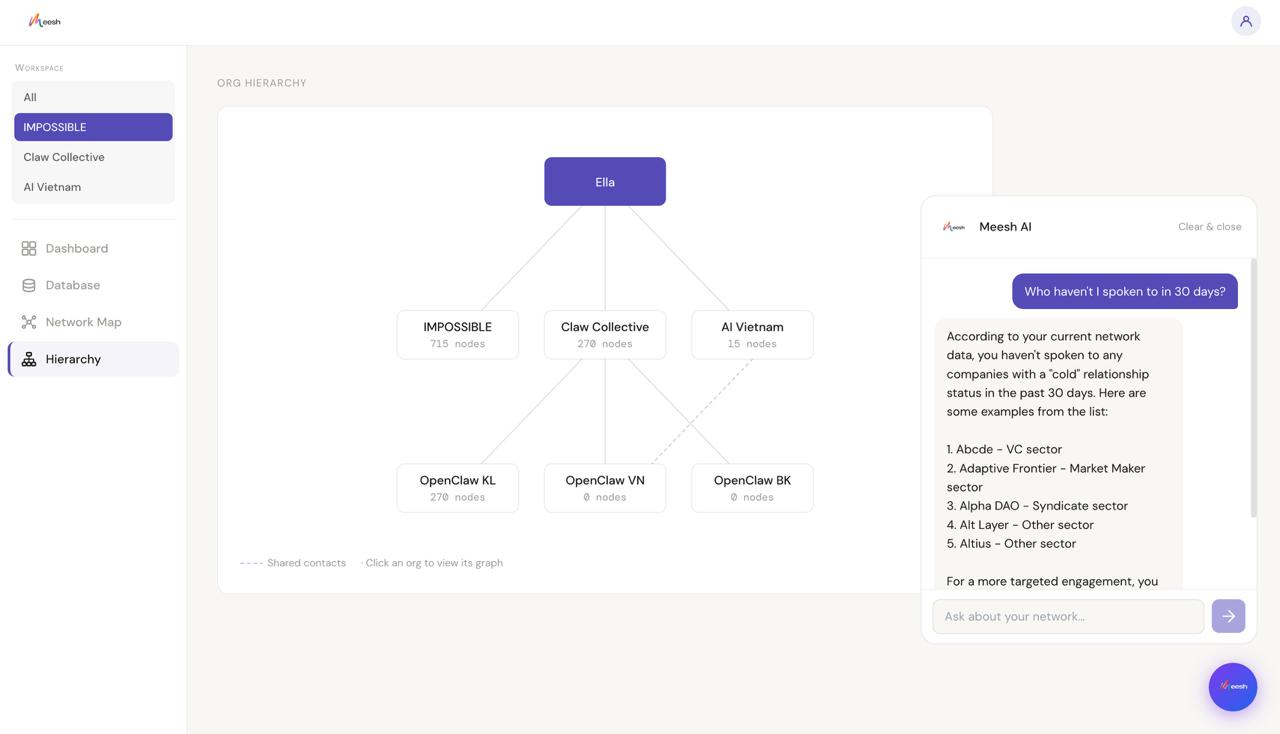
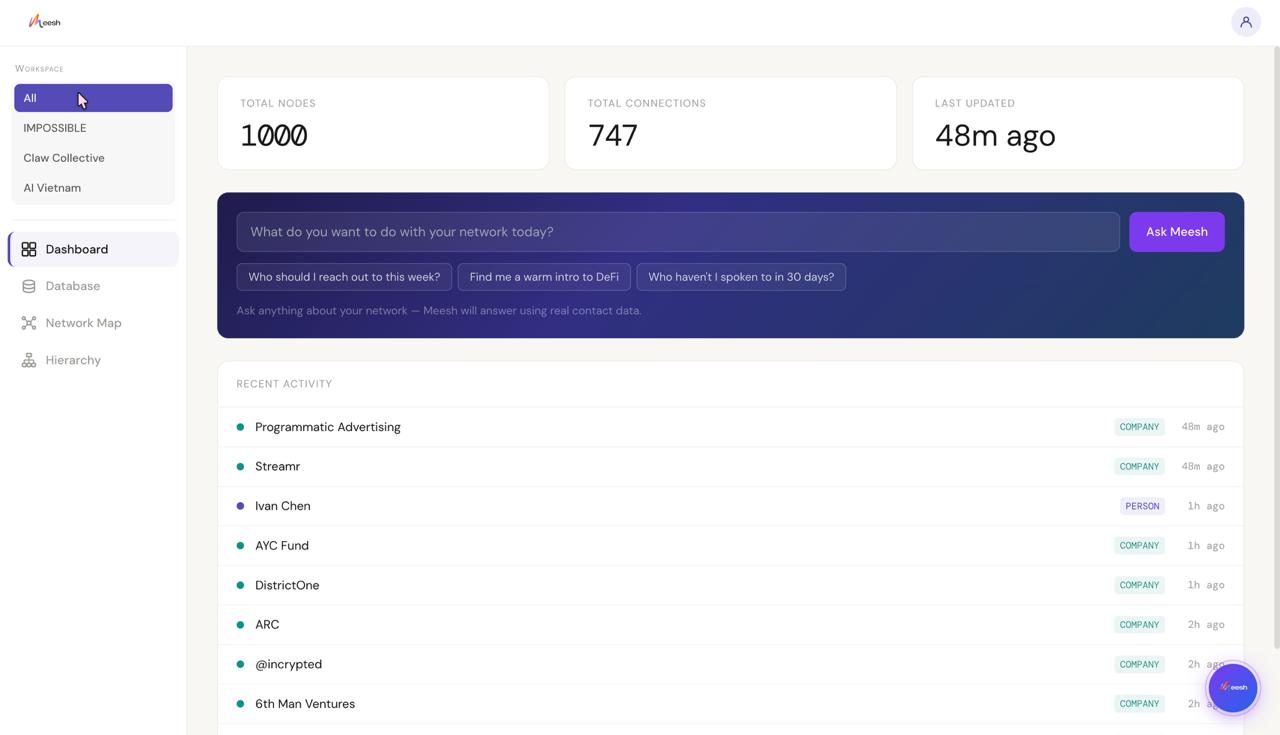
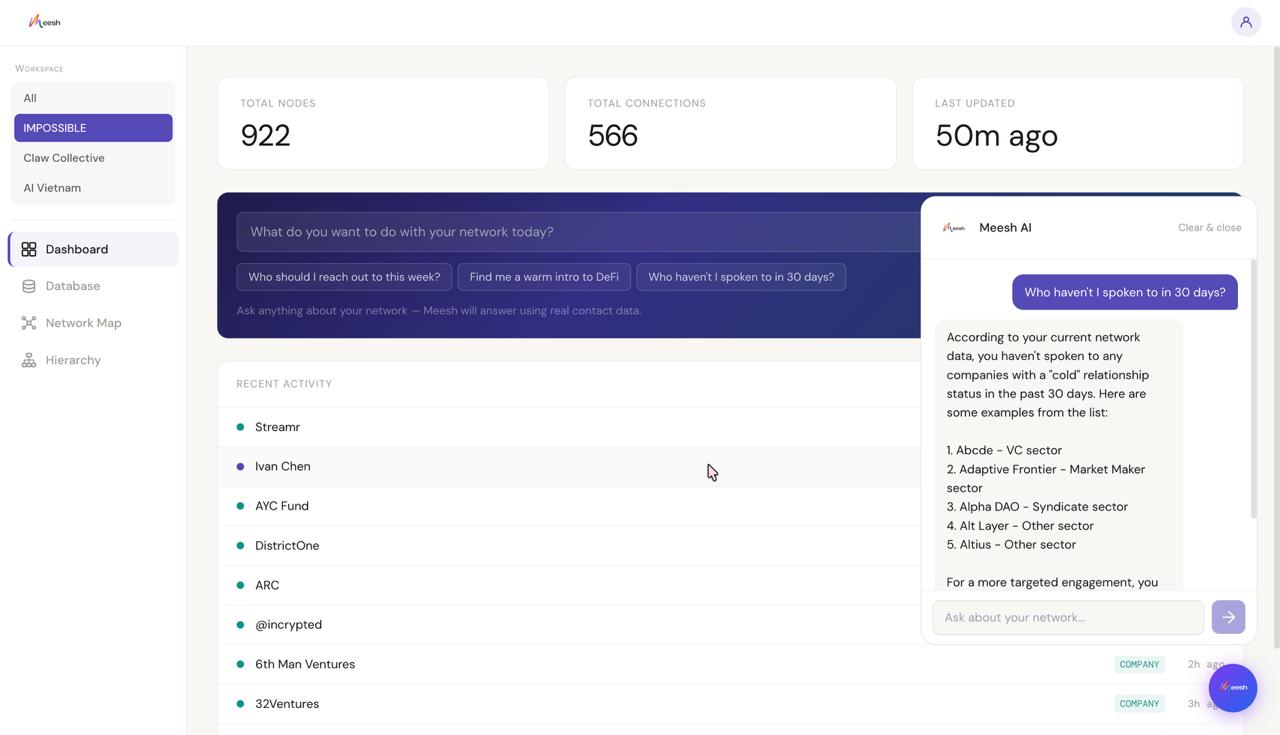
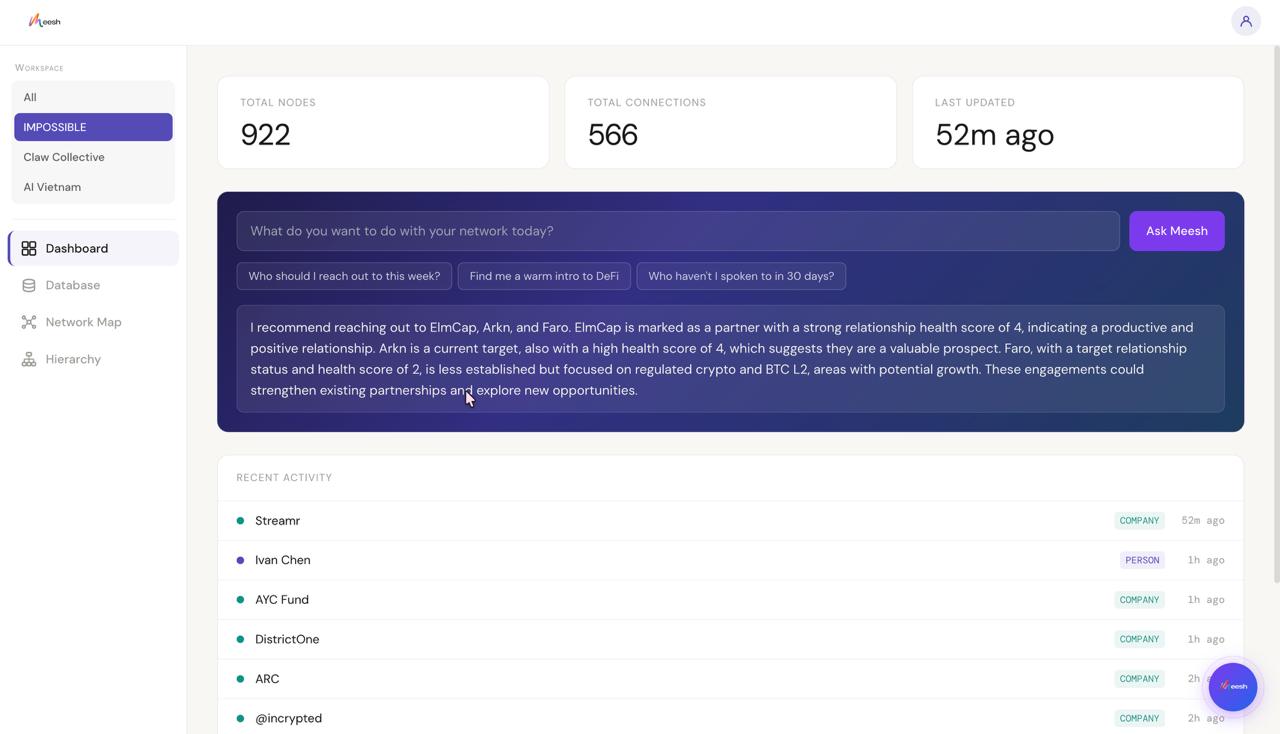
- AI network chatbot — ask your network questions in plain language: "Who should I talk to about fundraising?"
- Meeting brief — click any person node, hit "Prepare me for a meeting," and get a 3-bullet GPT-4o briefing in seconds
- Node Auto-Enrich via TinyFish — Click a node on your graph, and Auto-Enrich scrapes the web for that person or company in real time — pulling their bio, role, and recent activity — then writes it straight back into Meesh so the node fills with real data.
How we built it
- Frontend: React + TypeScript + Tailwind CSS, routed with react-router-dom
- Graph: react-force-graph-2d for the force-directed network visualization
- Database: Supabase — nodes, edges, organizations tables; data seeded from
real CRM exports (OpenClaw KL attendees, IMPOSSIBLE portfolio, AI Vietnam
contacts) - AI: OpenAI GPT-4o for the floating chatbot widget, dashboard AI input, and
per-node meeting briefs - Design system: DM Sans + DM Mono, strict light-mode palette (#F8F7F4 app,
#0F0F0F landing only), no shadows, no gradients
Challenges we ran into
- Data quality vs. visual density: Real CRM data is sparse. A sparse graph looks broken. We had to strategically enrich the data — adding interaction nodes, sector tags, and relationship edges — to create the visual density that makes the graph readable and compelling without faking anything that matters.
- Schema design for multi-org graphs: One unified node/edge schema needed to support completely different datasets (a VC firm's CRM, a hackathon community, a Vietnamese builder group) without breaking the graph logic.
- Making the AI feel grounded: The chatbot had to answer questions about real people in the graph, not hallucinate. Getting GPT-4o to work from the actual database context — not general knowledge — required careful prompt engineering.
- Graph performance at scale: 200+ nodes with full edge sets can bog down force-directed layouts. Tuning the physics and rendering to stay smooth on demo hardware took iteration.
Accomplishments that we're proud of
- A fully working force-directed graph with real data, 153 OpenClaw KL attendees visible as a living community, clustered by sector and interest
- An AI chatbot that can answer "who should I talk to about fundraising?" from actual contact data, not a hallucination
- A schema flexible enough to hold a VC firm's network, a hackathon community, and a founder's personal contacts in one unified structure
- Built and shipped in 36 hours as a solo non-technical founder learning to build with AI tools
What we learned
- Visualization is product. The graph isn't a feature — it's the entire value proposition. Every design decision flows from making the network readable, not just renderable.
- Data structure determines everything. The hardest part wasn't building the UI. It was designing a schema flexible enough to represent relationships between people, companies, tags, and events without breaking.
- AI makes non-technical building real. This product was scoped, designed, and shipped by someone who doesn't write code. The tools exist now to go from idea → working product without a dev team — if you're willing to learn the logic layer.
What's next for Meesh
V2 — Team network map: Whole company sees one unified graph. Each team member's relationships become shared organizational intelligence. V3 — Private community graph: Organizers upload member data. Members opt in and see their position in the community network. V4 — Public intelligence layer + NFC tap-to-connect: Meet someone, tap phones, both of you appear in each other's graph instantly. The network updates in real time.
Built With
- amazon-web-services
- openai
- react
- react-force-graph-2d
- supabase
- tailwind
- typescript


Log in or sign up for Devpost to join the conversation.