-
-
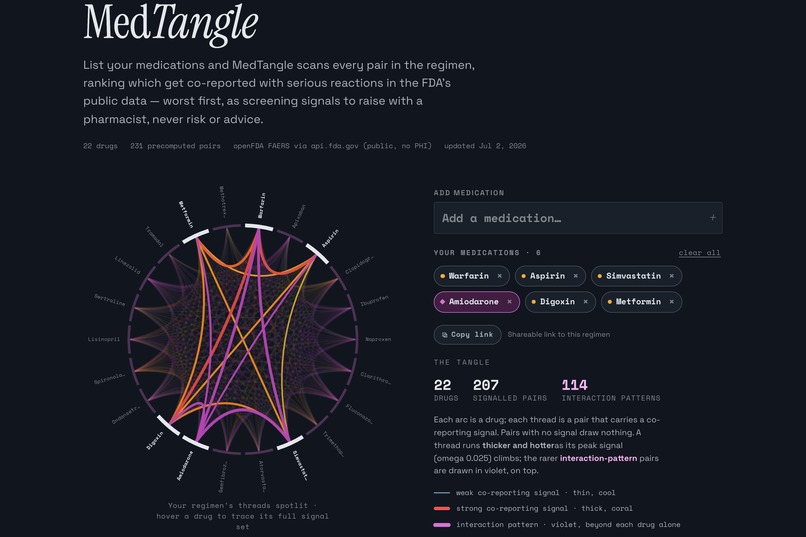
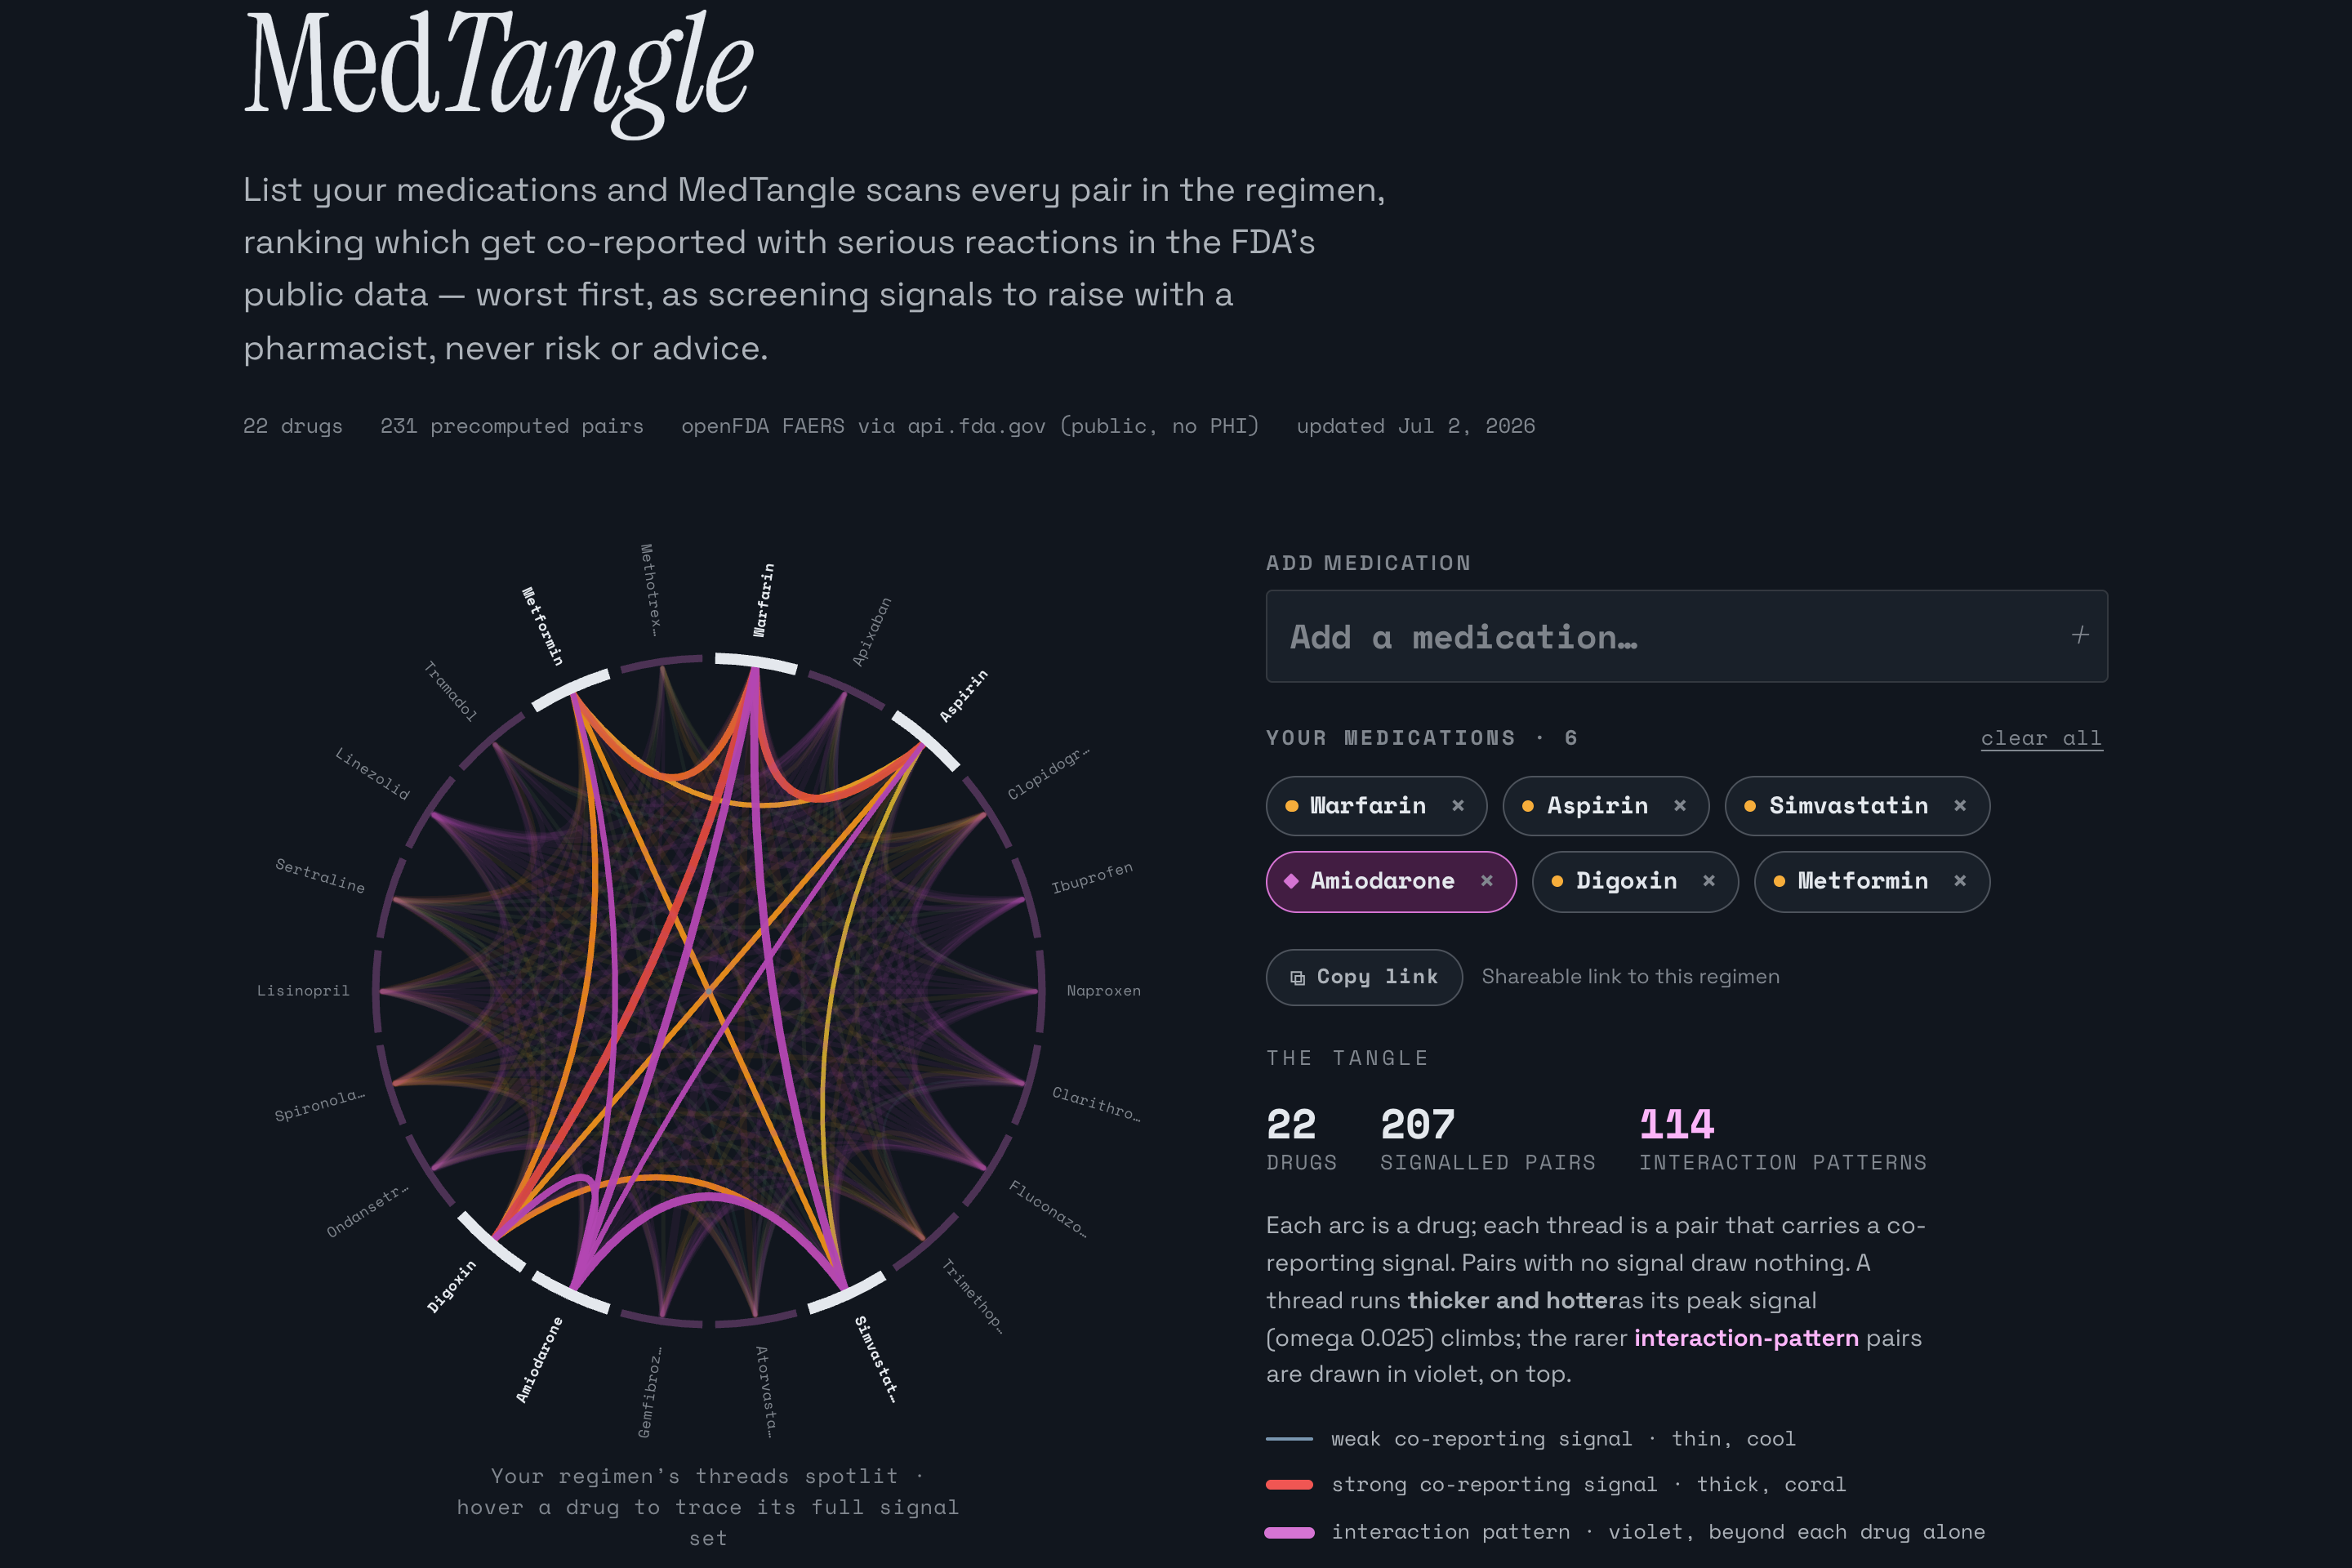
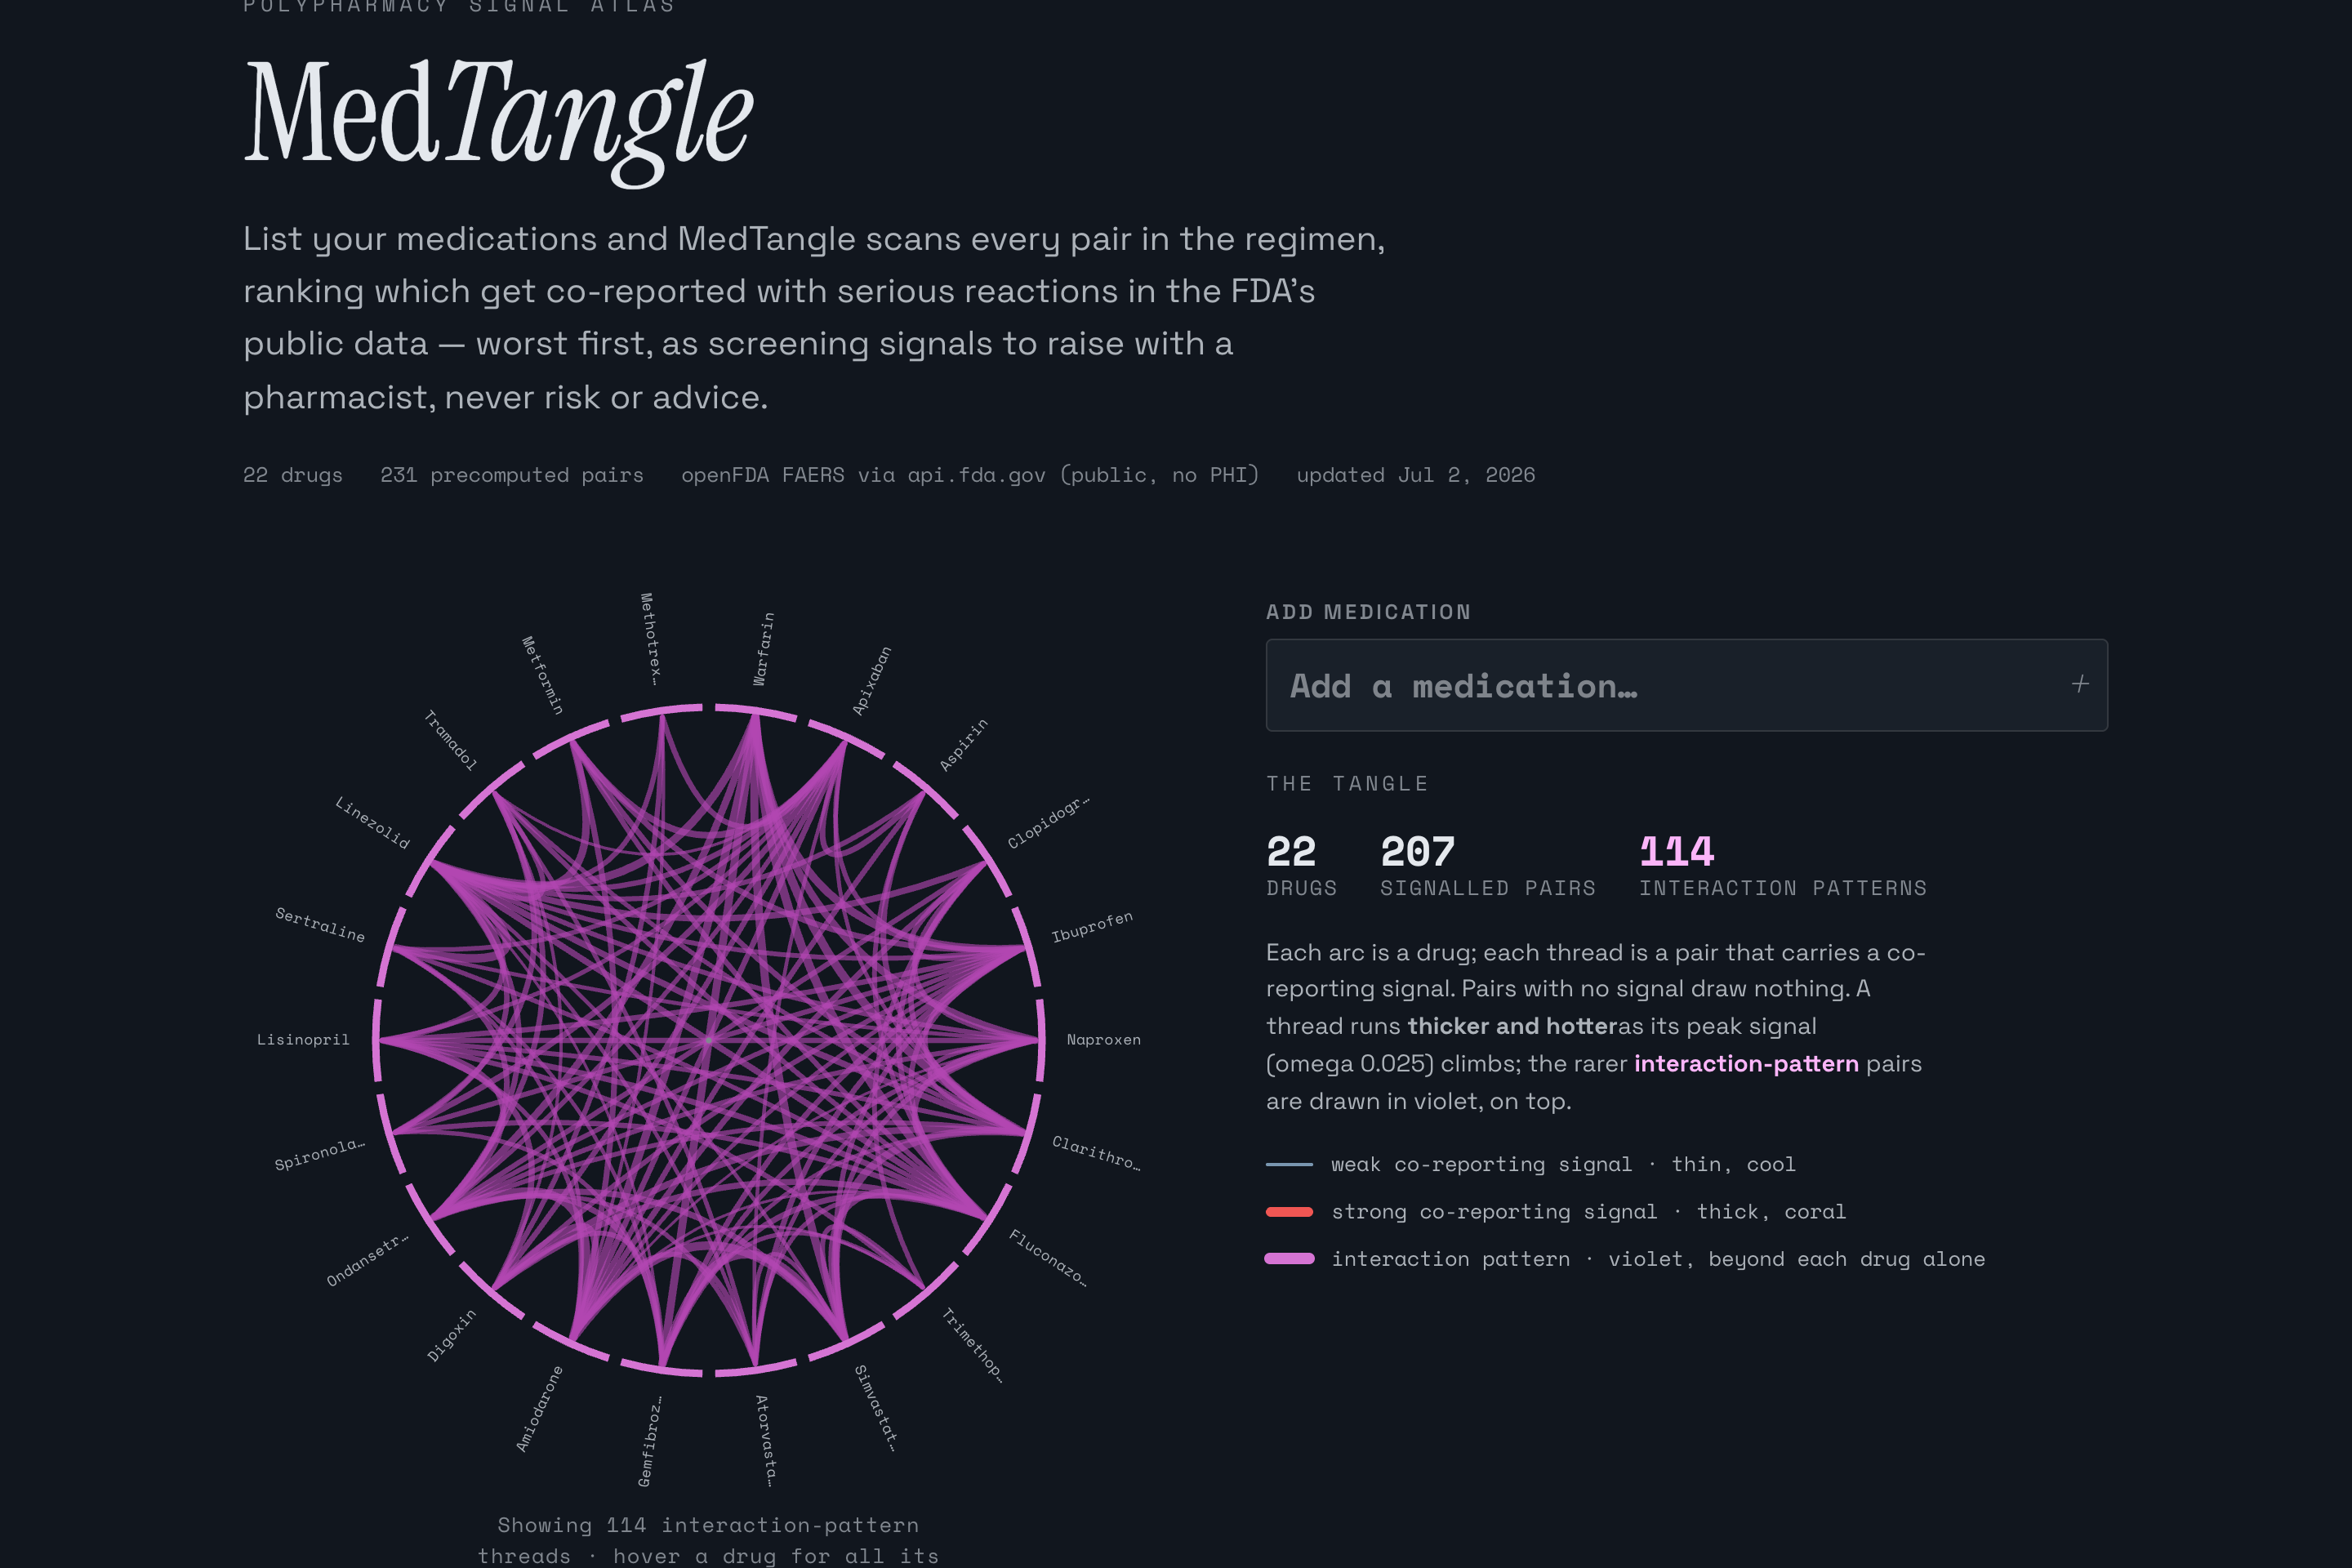
Six medications loaded. Every pair gets checked, and the threads light up for the ones that carry a signal in the FDA's adverse-event data.
-
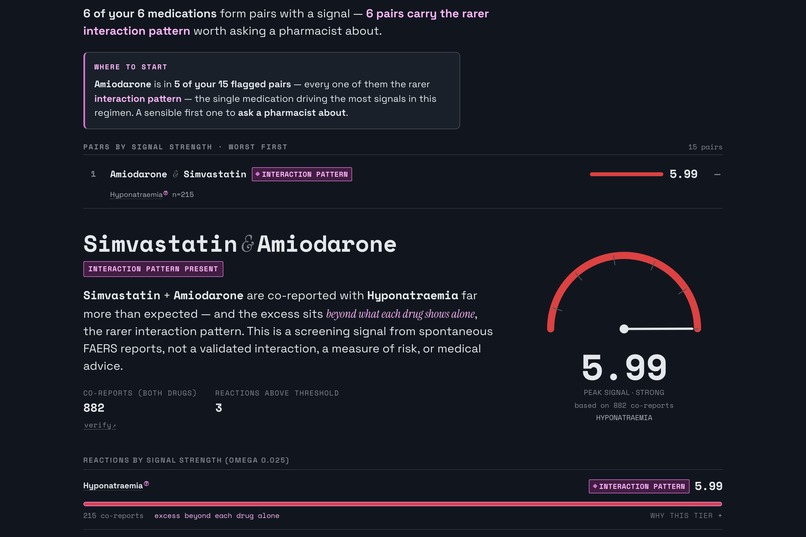
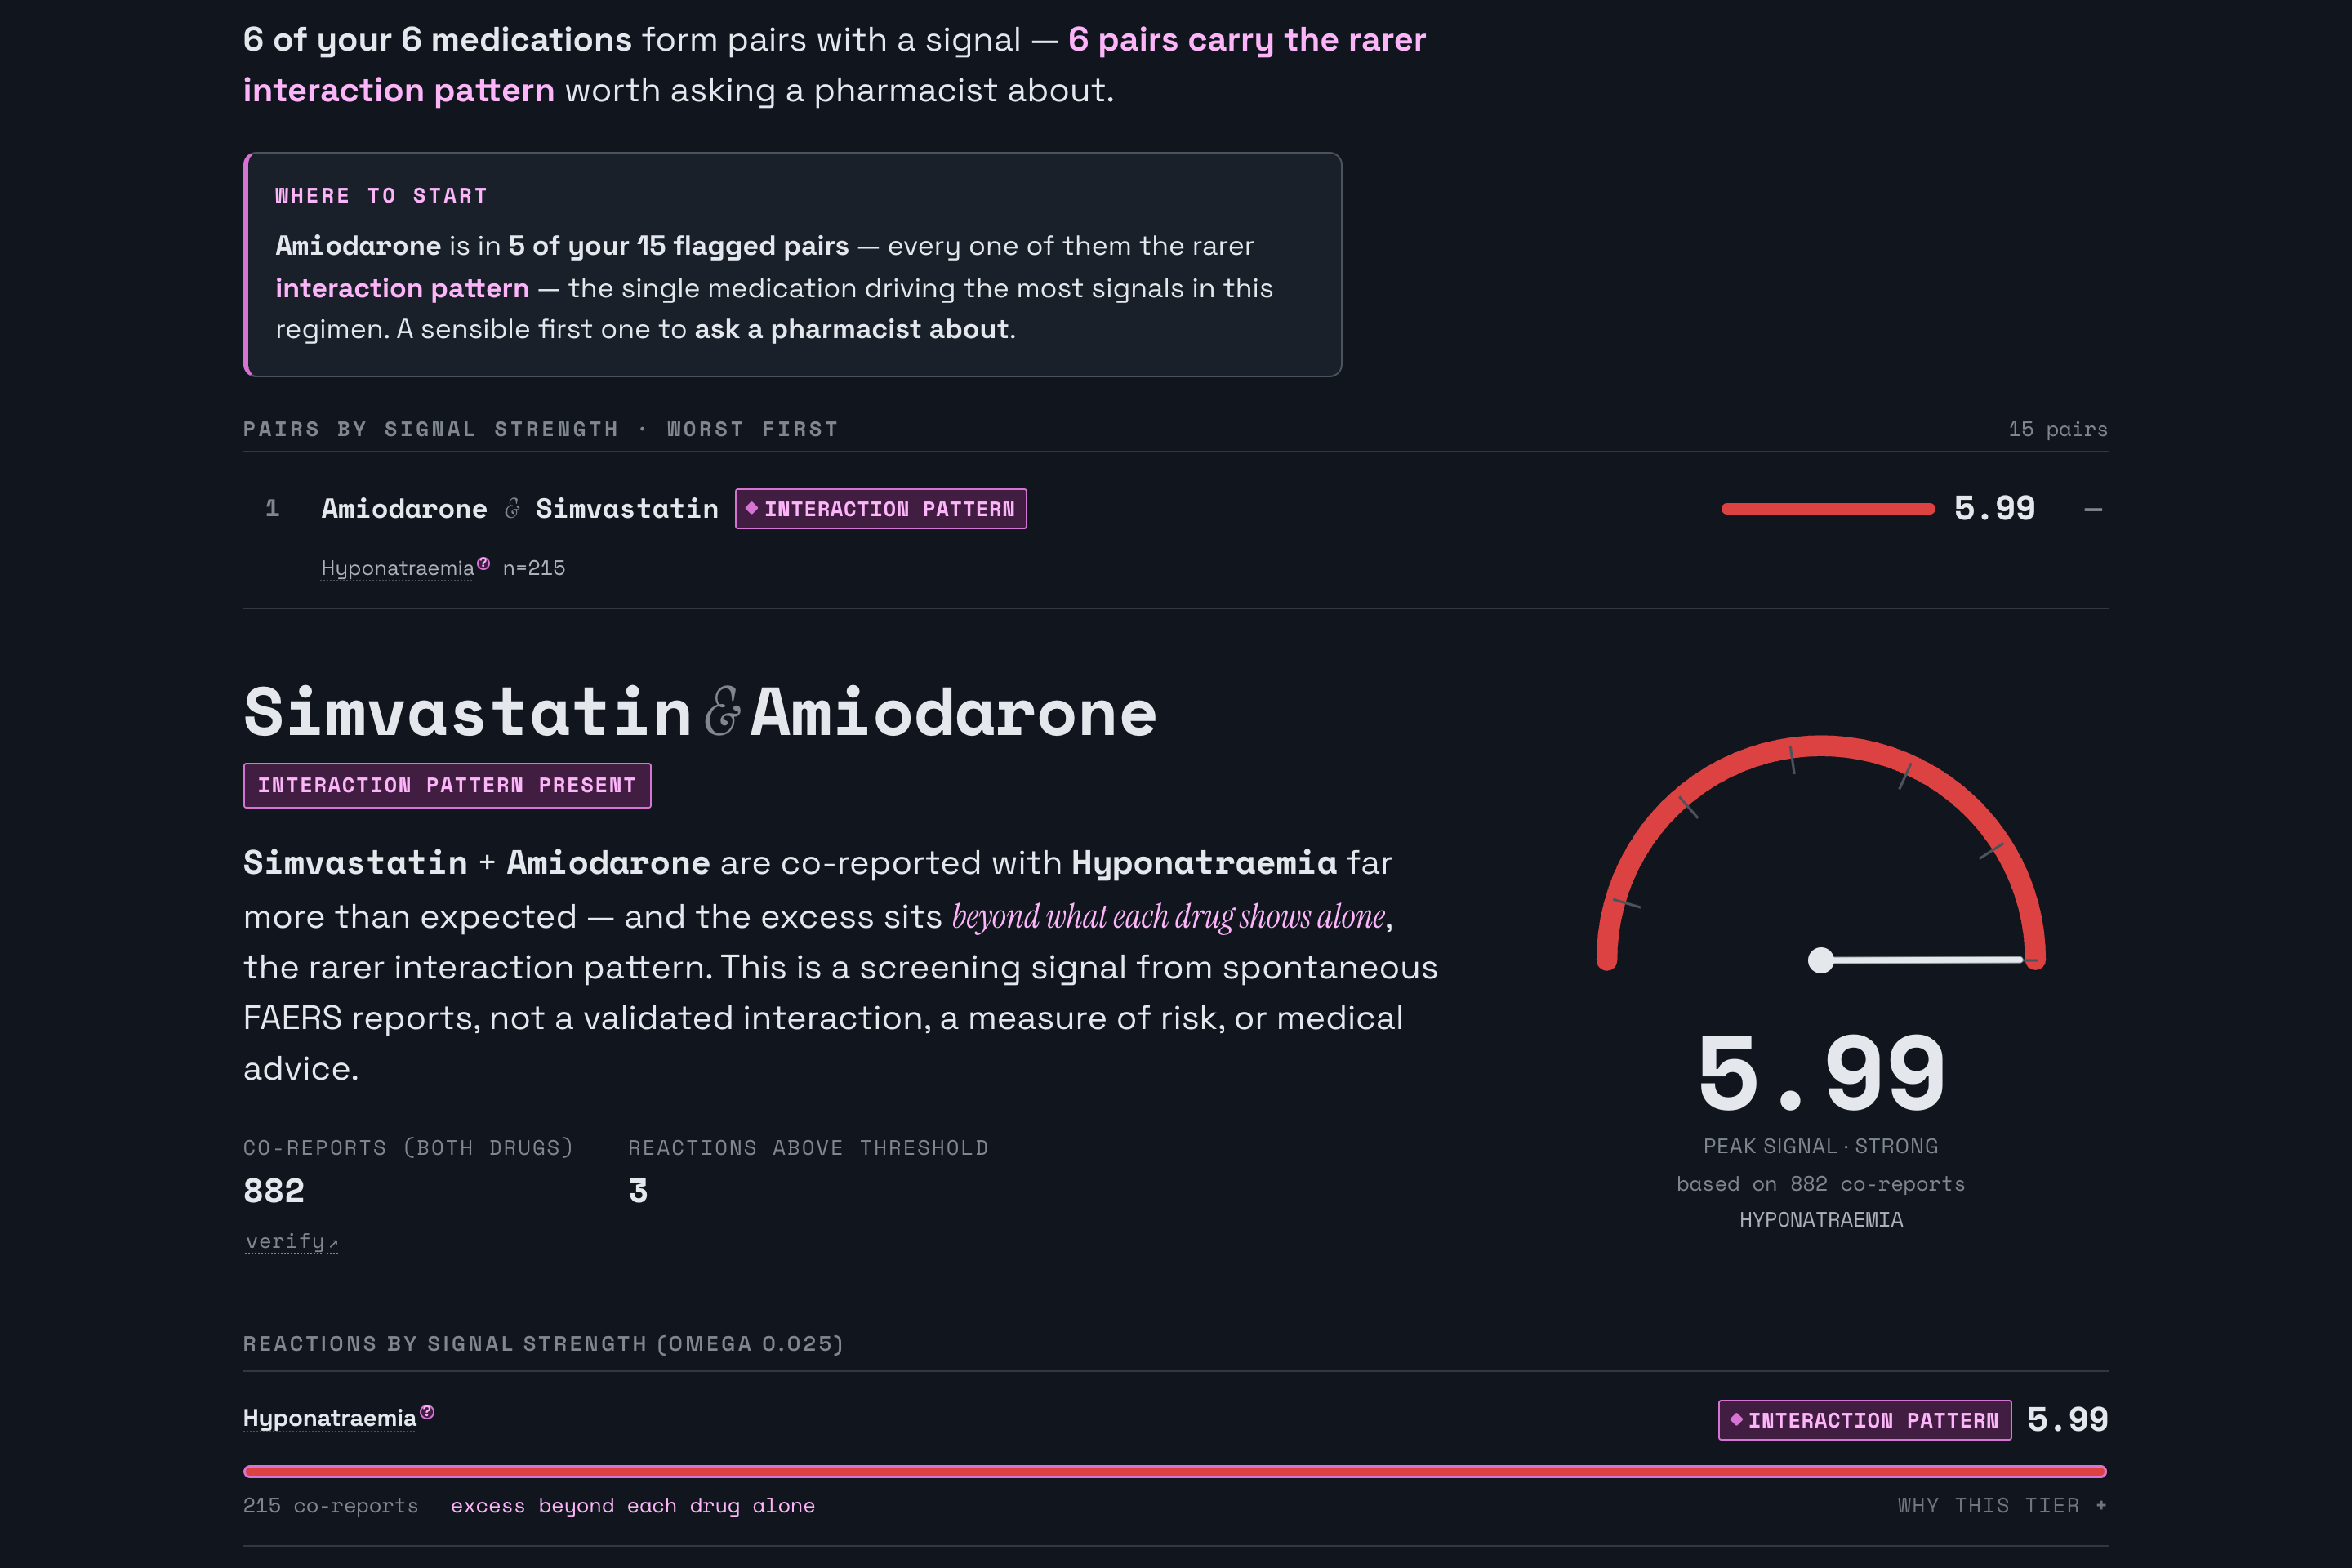
Instead of 15 results, it names the drug to ask about first: amiodarone, in 5 of the 15 flagged pairs, every one at the higher tier.
-
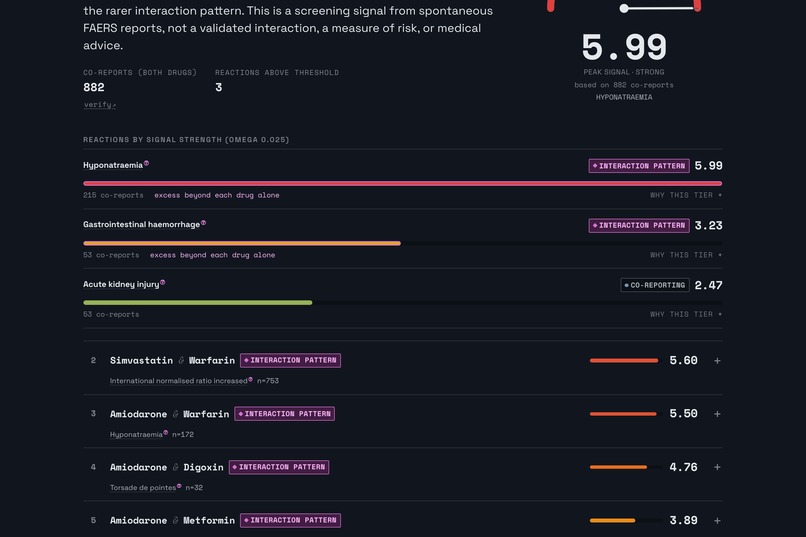
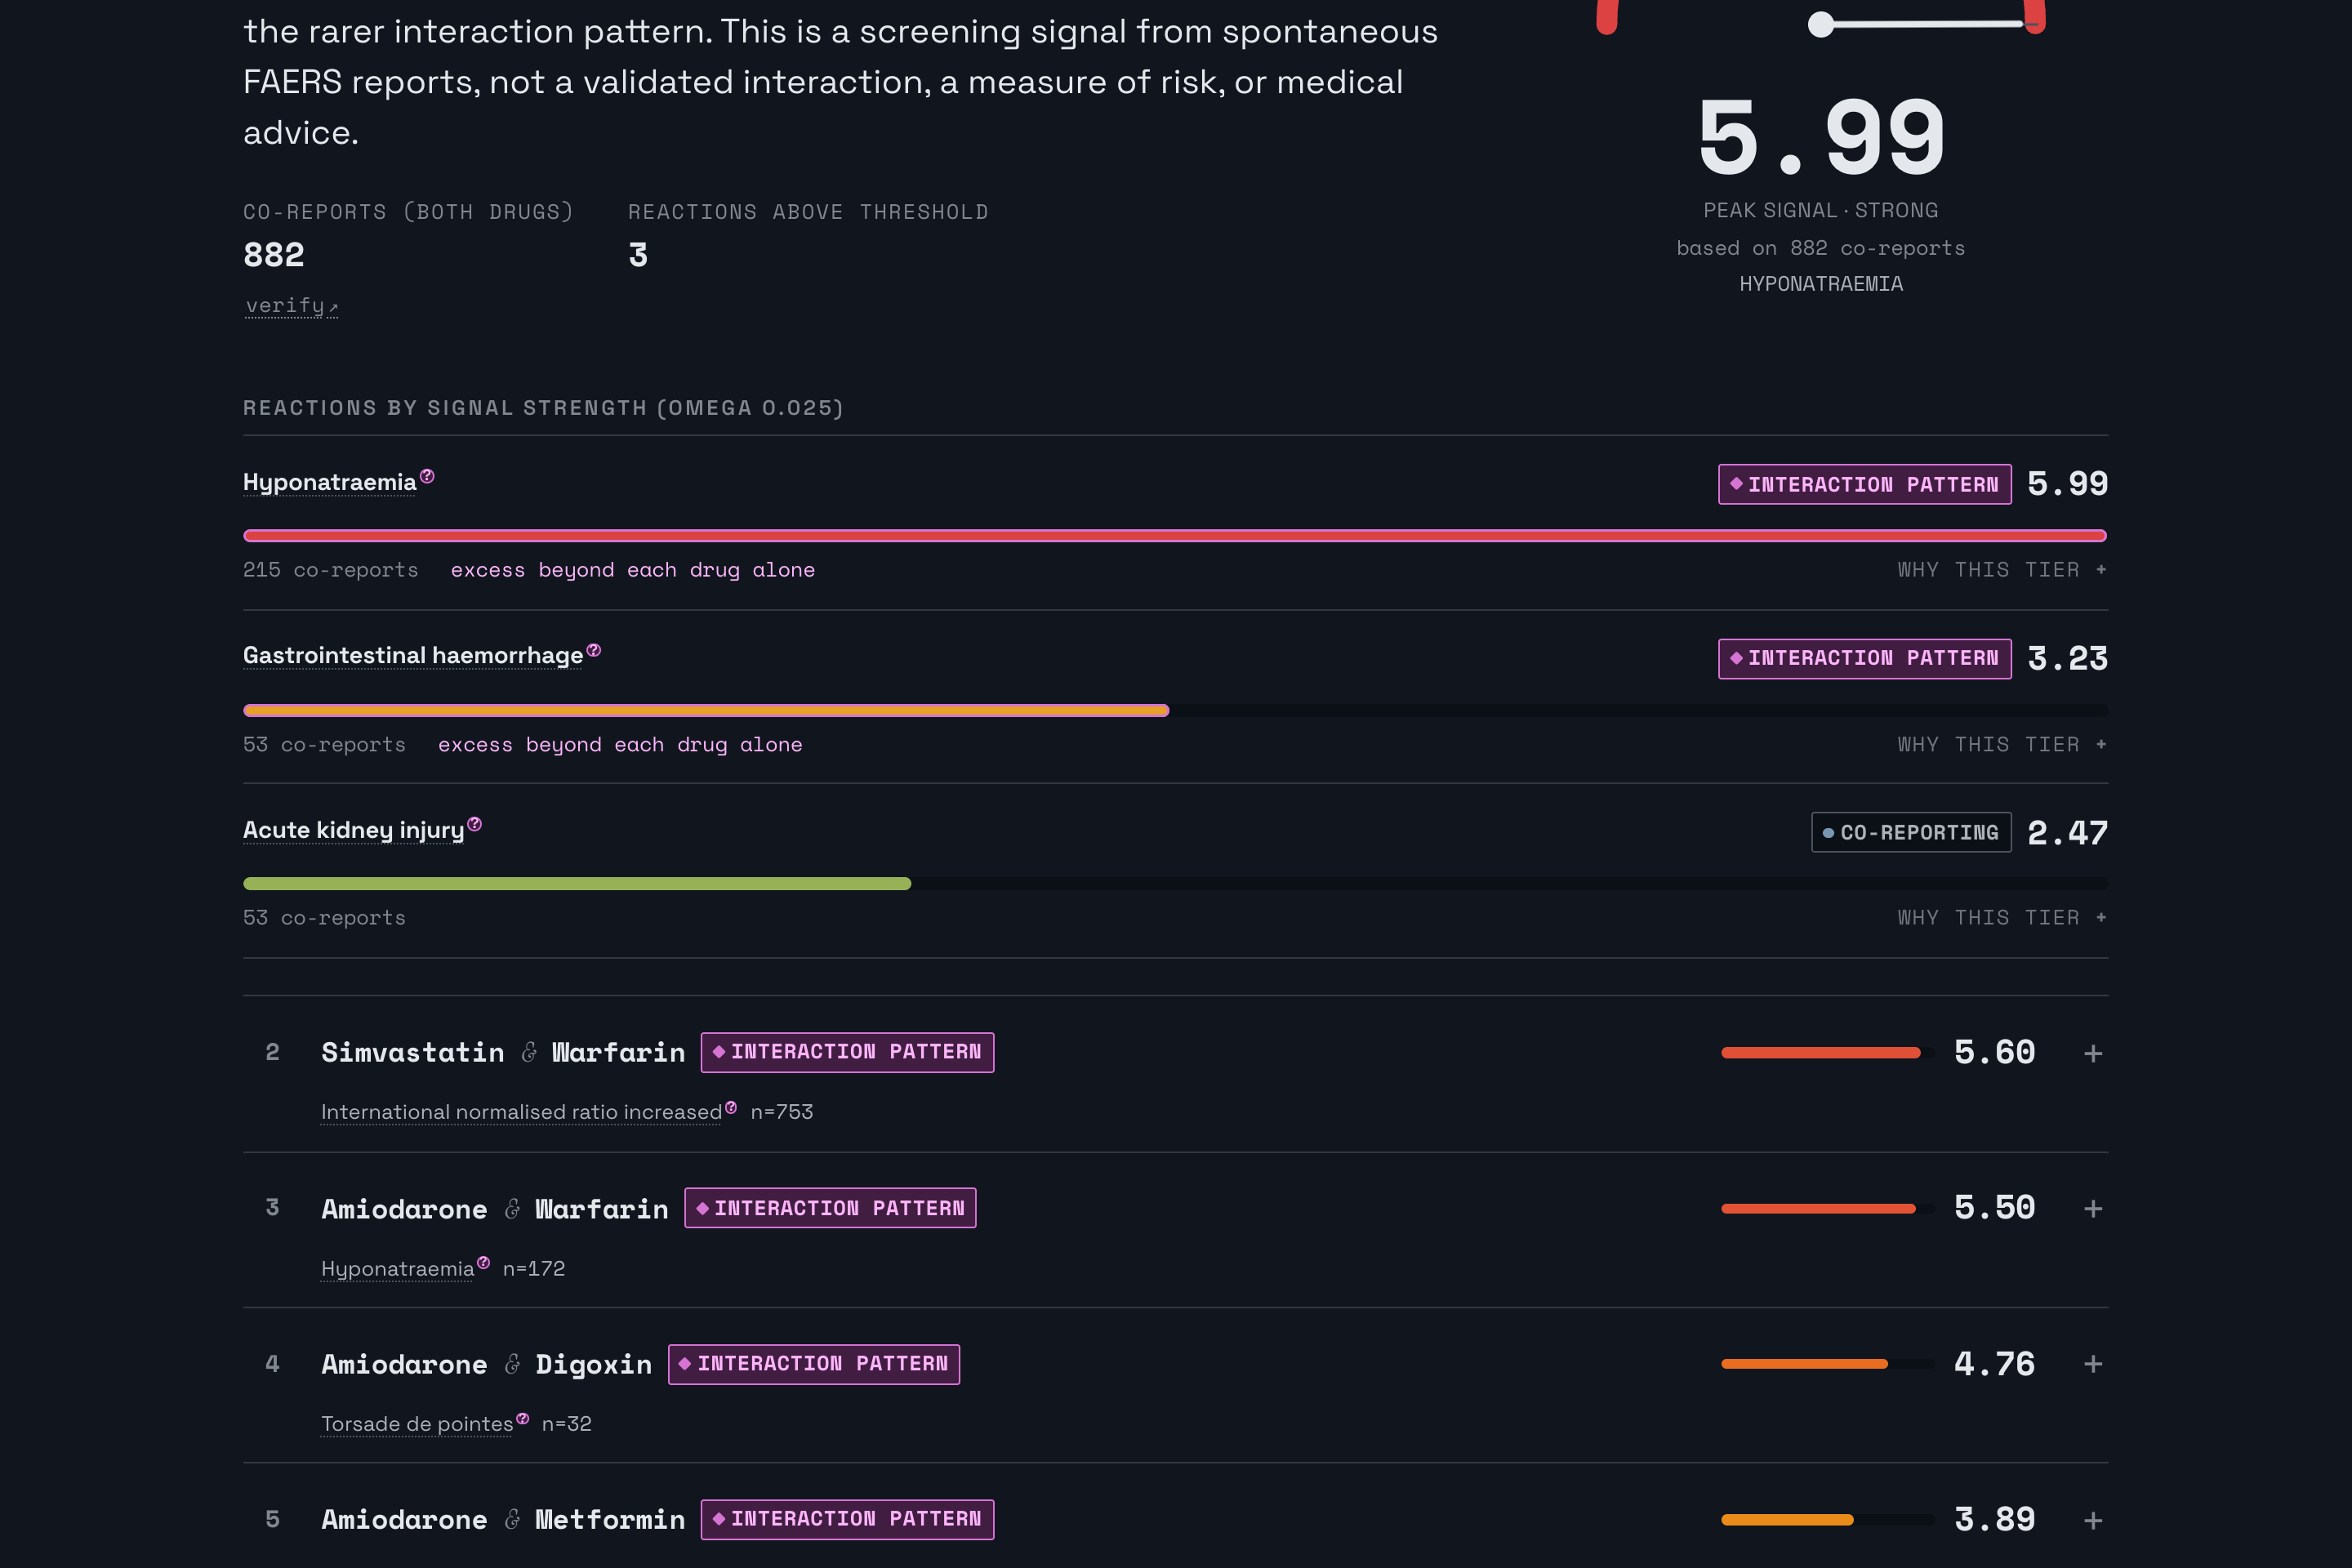
Pairs ranked worst first. Amiodarone + digoxin at #4, flagged for torsade de pointes, a dangerous heart rhythm, with no rules coded in.
-
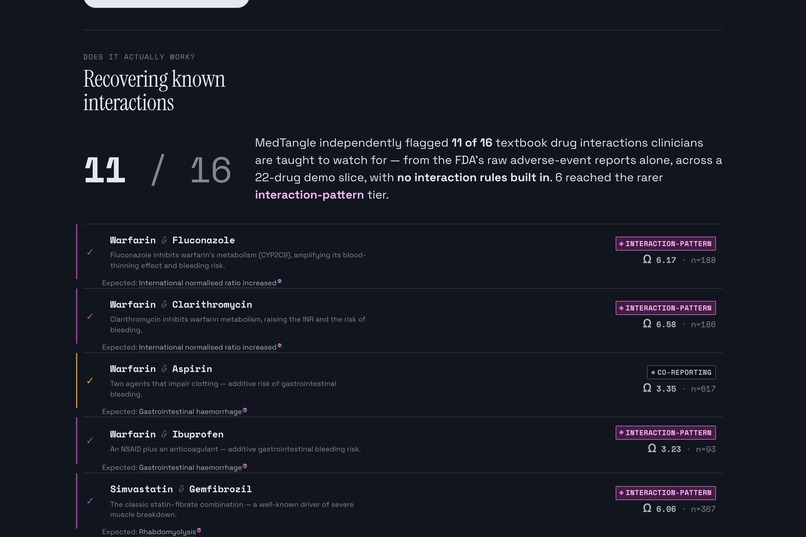
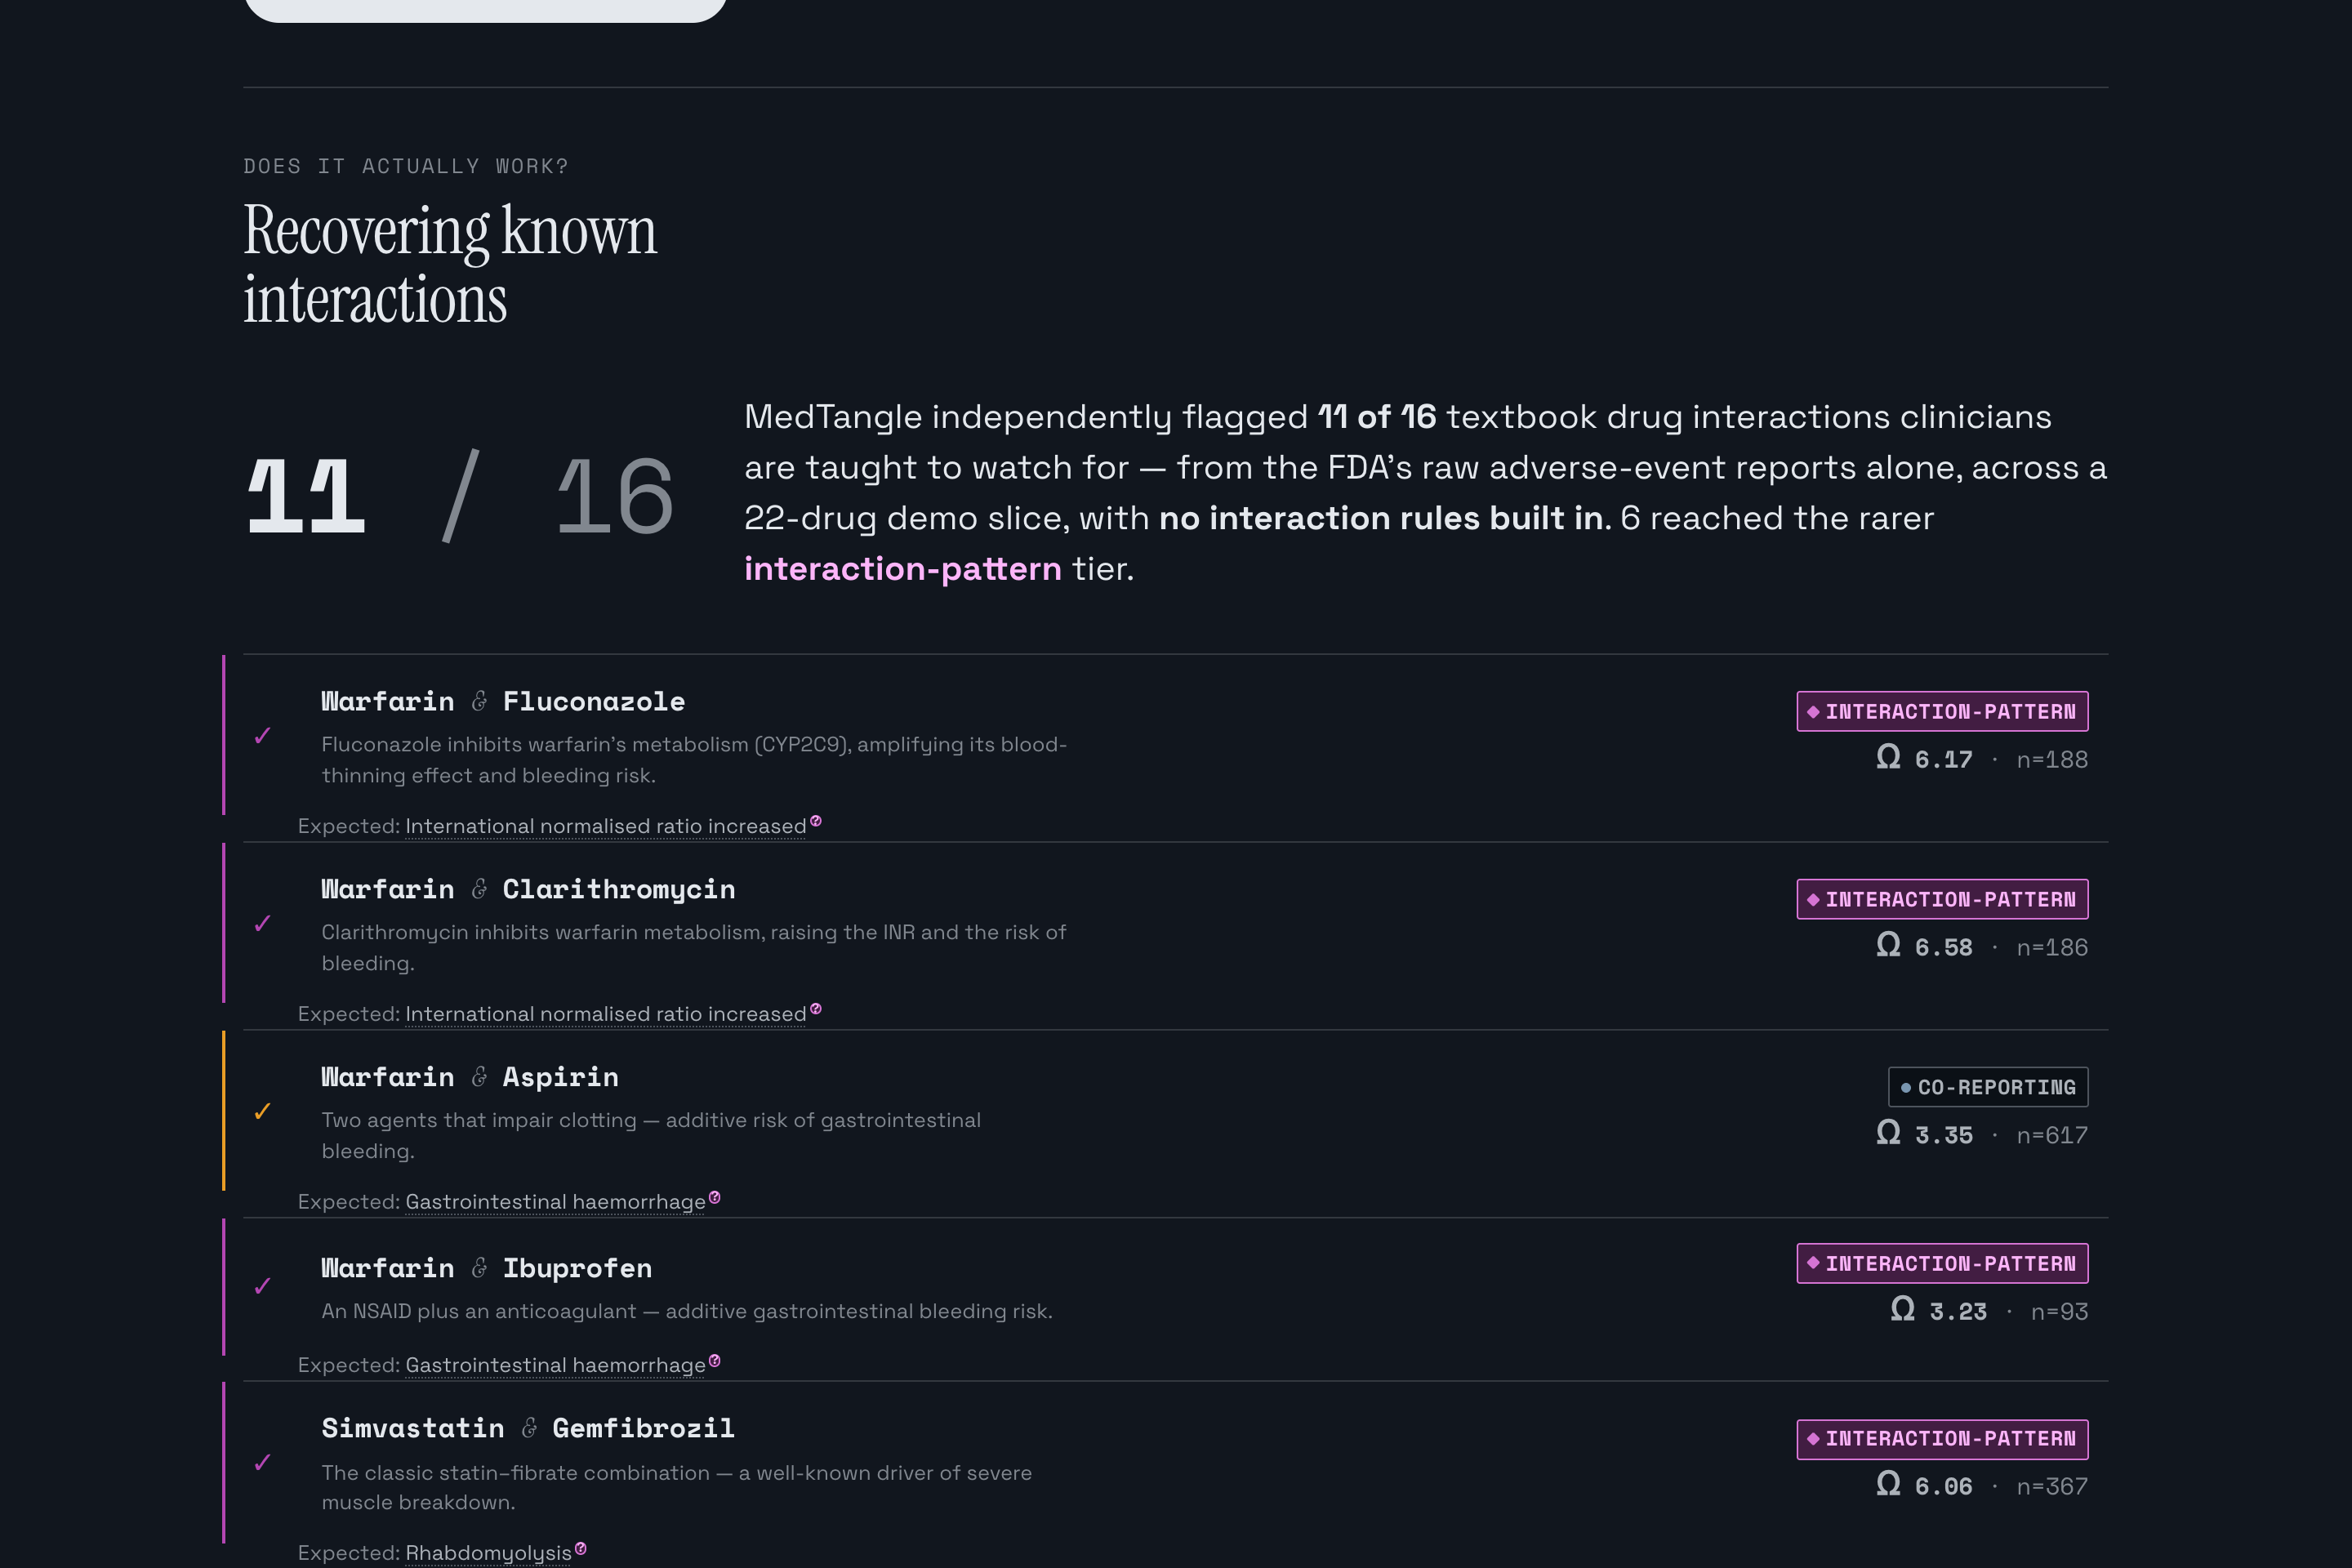
Tested against 16 interactions taught in pharmacology. It found 11 from raw data alone, and shows the 5 it missed rather than hiding them.
-
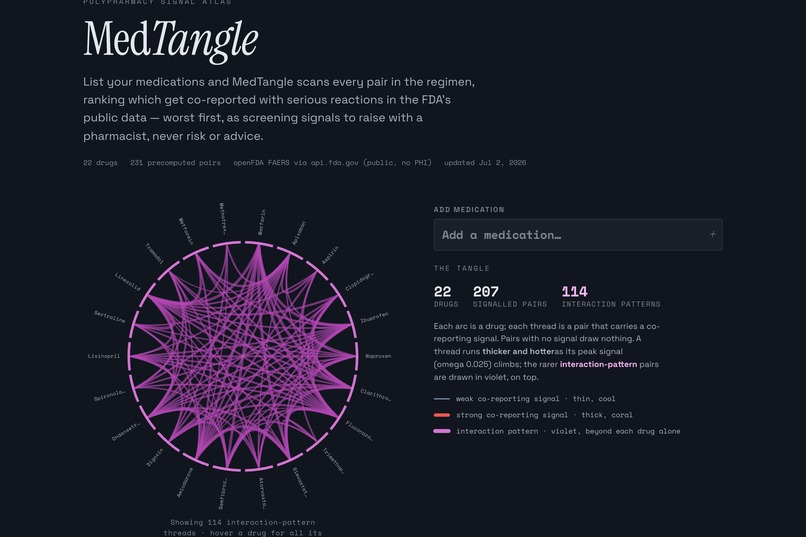
All 22 drugs, 231 pairs. Violet threads are the rarer interaction pattern, where the excess goes beyond what each drug does alone.
Inspiration
I started this assuming the hard part was already solved. Drug interactions are a known problem, so there must be a free API you can call. There used to be. The National Library of Medicine shut theirs down in January 2024, and what's left is either paid or licensed. That could have been the end of it. But the FDA still publishes something else: FAERS, a database of adverse-event reports that anyone can query. It's messier. Nobody verifies the reports, and you can't get a real rate out of it because you never know how many people took the drug. What you can ask is narrower. If two drugs keep turning up together in reports of the same serious reaction, more than either drug does on its own, is that worth a second look? That question I could actually answer with public data, so that's the one I built around.
What it does
You type in your medications, up to twelve, and it checks every pair. The sample regimen is a realistic one for an older patient: warfarin, aspirin, simvastatin, amiodarone, digoxin, metformin. Six drugs is fifteen pairs. All fifteen come back with some signal, and six of them clear the higher bar. They're ranked worst first, so you're not reading a table trying to figure out what matters. Then it does the part I think is actually useful. It looks at which single drug shows up in the most flagged pairs and names it. In that regimen it's amiodarone, in five of the fifteen, every one at the higher tier. So instead of handing you fifteen results, it says: start by asking about this one. There are two tiers on purpose. "Co-reporting" means the pair shows up with a reaction more than expected, but that can just mean doctors prescribe those two together for sick people. "Interaction pattern" is the narrower case where the excess goes beyond what each drug already does alone. Every number opens up, and every count links to the live FDA query behind it, so you can check whether I'm telling the truth.
How we built it
Next.js 16, React 19, TypeScript, and Tailwind on Vercel. D3 draws the circular diagram. Data comes from openFDA's FAERS endpoint, which is public, needs no key, and contains no patient information. Every query counts reports naming drug A and drug B and reaction R together.
The statistics are the part I spent the most time on. The main score is Norén's omega, a log2 comparison of how often a pair and reaction actually co-occur versus how often you'd expect if they were unrelated:
$$\Omega = \log_2 \left( \frac{n_{ABR} + 0.5}{E_{ABR} + 0.5} \right) \qquad \Omega_{0.25} = \Omega - \frac{3.3}{\sqrt{n_{ABR} + 0.5}} - \frac{2}{n_{ABR} + 0.5}$$
The first value is the raw score and the second is a shrinkage lower bound, and the lower bound is what I actually gate on. With a small number of reports it stays near zero, so a pair that looks dramatic off six coincidences doesn't get through. A pair needs that lower bound above log2 of 2, and at least five co-reports.
The second measure decides the higher tier. It's an additive contrast:
$$\text{INT}_{\text{add}} = P(R \mid A,B) - \bigl[ P(R \mid A) + P(R \mid B) - P(R) \bigr] > 0.015$$
It subtracts what each drug does on its own instead of multiplying, which matters more than it sounds like.
The app never calls the API while you're using it. A separate script pulls everything from openFDA offline and writes it to a static file the site reads. That was mostly so a slow API couldn't ruin a demo, but it also made the whole thing faster.
There are 50 tests across three files, 26 of them on the statistics module. The one I care about most reproduces numbers I worked out separately in Python from hardcoded FDA counts, so if I ever break the math the test catches it instead of me finding out later.
Challenges we ran into
The statistic was the whole project, and my first version was wrong. I started with a straightforward disproportionality score. It flagged 43% of all pairs as interactions. That's obviously useless, and the reason is that FAERS is full of drugs that get prescribed together. Sicker patients take more medications and have more events, so almost any common pair looks correlated. A number that says everything is dangerous says nothing. I also tried the version that seemed obvious, a three-way omega. Working through it, it reduces to a multiplicative ratio, and multiplicative ratios have a specific failure: they under-flag pairs where both drugs already cause the reaction. Warfarin and aspirin both cause bleeding on their own, so multiplying their rates sets the bar too high and the pair disappears. That's how I ended up with an additive measure and two separate tiers instead of one number. The bug I'm least proud of was a duplicated .exact in one query string. Every reaction lookup silently returned nothing. No error. The app just showed a world where no drug combination was ever dangerous, which looked fine until I noticed it looked too fine. Now when results are clean I assume something's broken before I assume I'm right.
Accomplishments that we're proud of
I tested it against sixteen interactions that get taught in pharmacology, the ones clinicians are trained to watch for. It found eleven, with no interaction rules written into the code at all. Six of those reached the higher tier. The app shows all sixteen, including the five it missed, and why it missed them, which is that there weren't enough co-reports to clear the threshold. I'd rather show that than a number with the failures cropped out. Eleven of sixteen is a real result. Sixteen of sixteen would have meant I tuned the thresholds until it passed. One case I didn't expect: digoxin and amiodarone came back flagged for torsade de pointes, a dangerous heart rhythm. That's a documented interaction and I hadn't told the program anything about it. It came out of the report counts. The one I left alone is warfarin and aspirin. It's a textbook bleeding interaction and it only reaches the lower tier, because each drug causes bleeding on its own so the math can't separate the combination from the parts. I could have special-cased it. Leaving it honest seemed more useful than a scoreboard I'd fixed.
What we learned
The main thing is the difference between two drugs being reported together and two drugs interacting. They look identical in the data. Everything hard about this project came from that gap. I learned that adding and multiplying are not interchangeable when you're comparing against a baseline. Multiplying inflates what you expect from already-risky drugs and hides exactly the pairs you want to find. I learned to check data at the point it enters the program. All the openFDA responses get validated before anything uses them, so bad data stops the offline script instead of quietly producing a wrong signal on a live page. And I learned that a shipped thing that admits its limits is worth more than a more impressive thing that overstates them. Almost every decision here came down to picking the version that was easier to defend.
What's next for MedTangle
Run it across the full drug list. The method doesn't change, it just needs a bigger request budget than the free tier allows in one go. Get a pharmacist to mark signals as worth-checking or not, and use those judgments to tune the thresholds against something better than my own reasoning. Add time windows, so a pattern that's growing looks different from one that's been steady for a decade.
Built With
- bayesian-statistics
- css
- d3.js
- data-visualization
- disproportionality-analysis
- drug-safety
- faers
- health
- next.js
- node.js
- openfda
- pharmacovigilance
- polypharmacy
- react
- statistics
- tailwindcss
- typescript
- vercel

Log in or sign up for Devpost to join the conversation.