Inspiration
This project was inspired by a collection of features that Annie saw online in the past. Annie was impressed by scaling timelines, vector graphics, density maps, and network maps. These features together combined with our team's life sciences/health background led us to want to do something in the area of health care.
A lot of health care data is tracked through census, research studies, and population level tracking--and most of this data is overwhelming and difficult to understand for the layperson. As a healthcare provider, Annie is always telling people how "this medication is well tolerated". Patients and consumers are always seeing information like "9 in 10 dentists recommend" some toothpaste, but what does that really mean to them? It is hard for people to connect with such a nebulous concept.
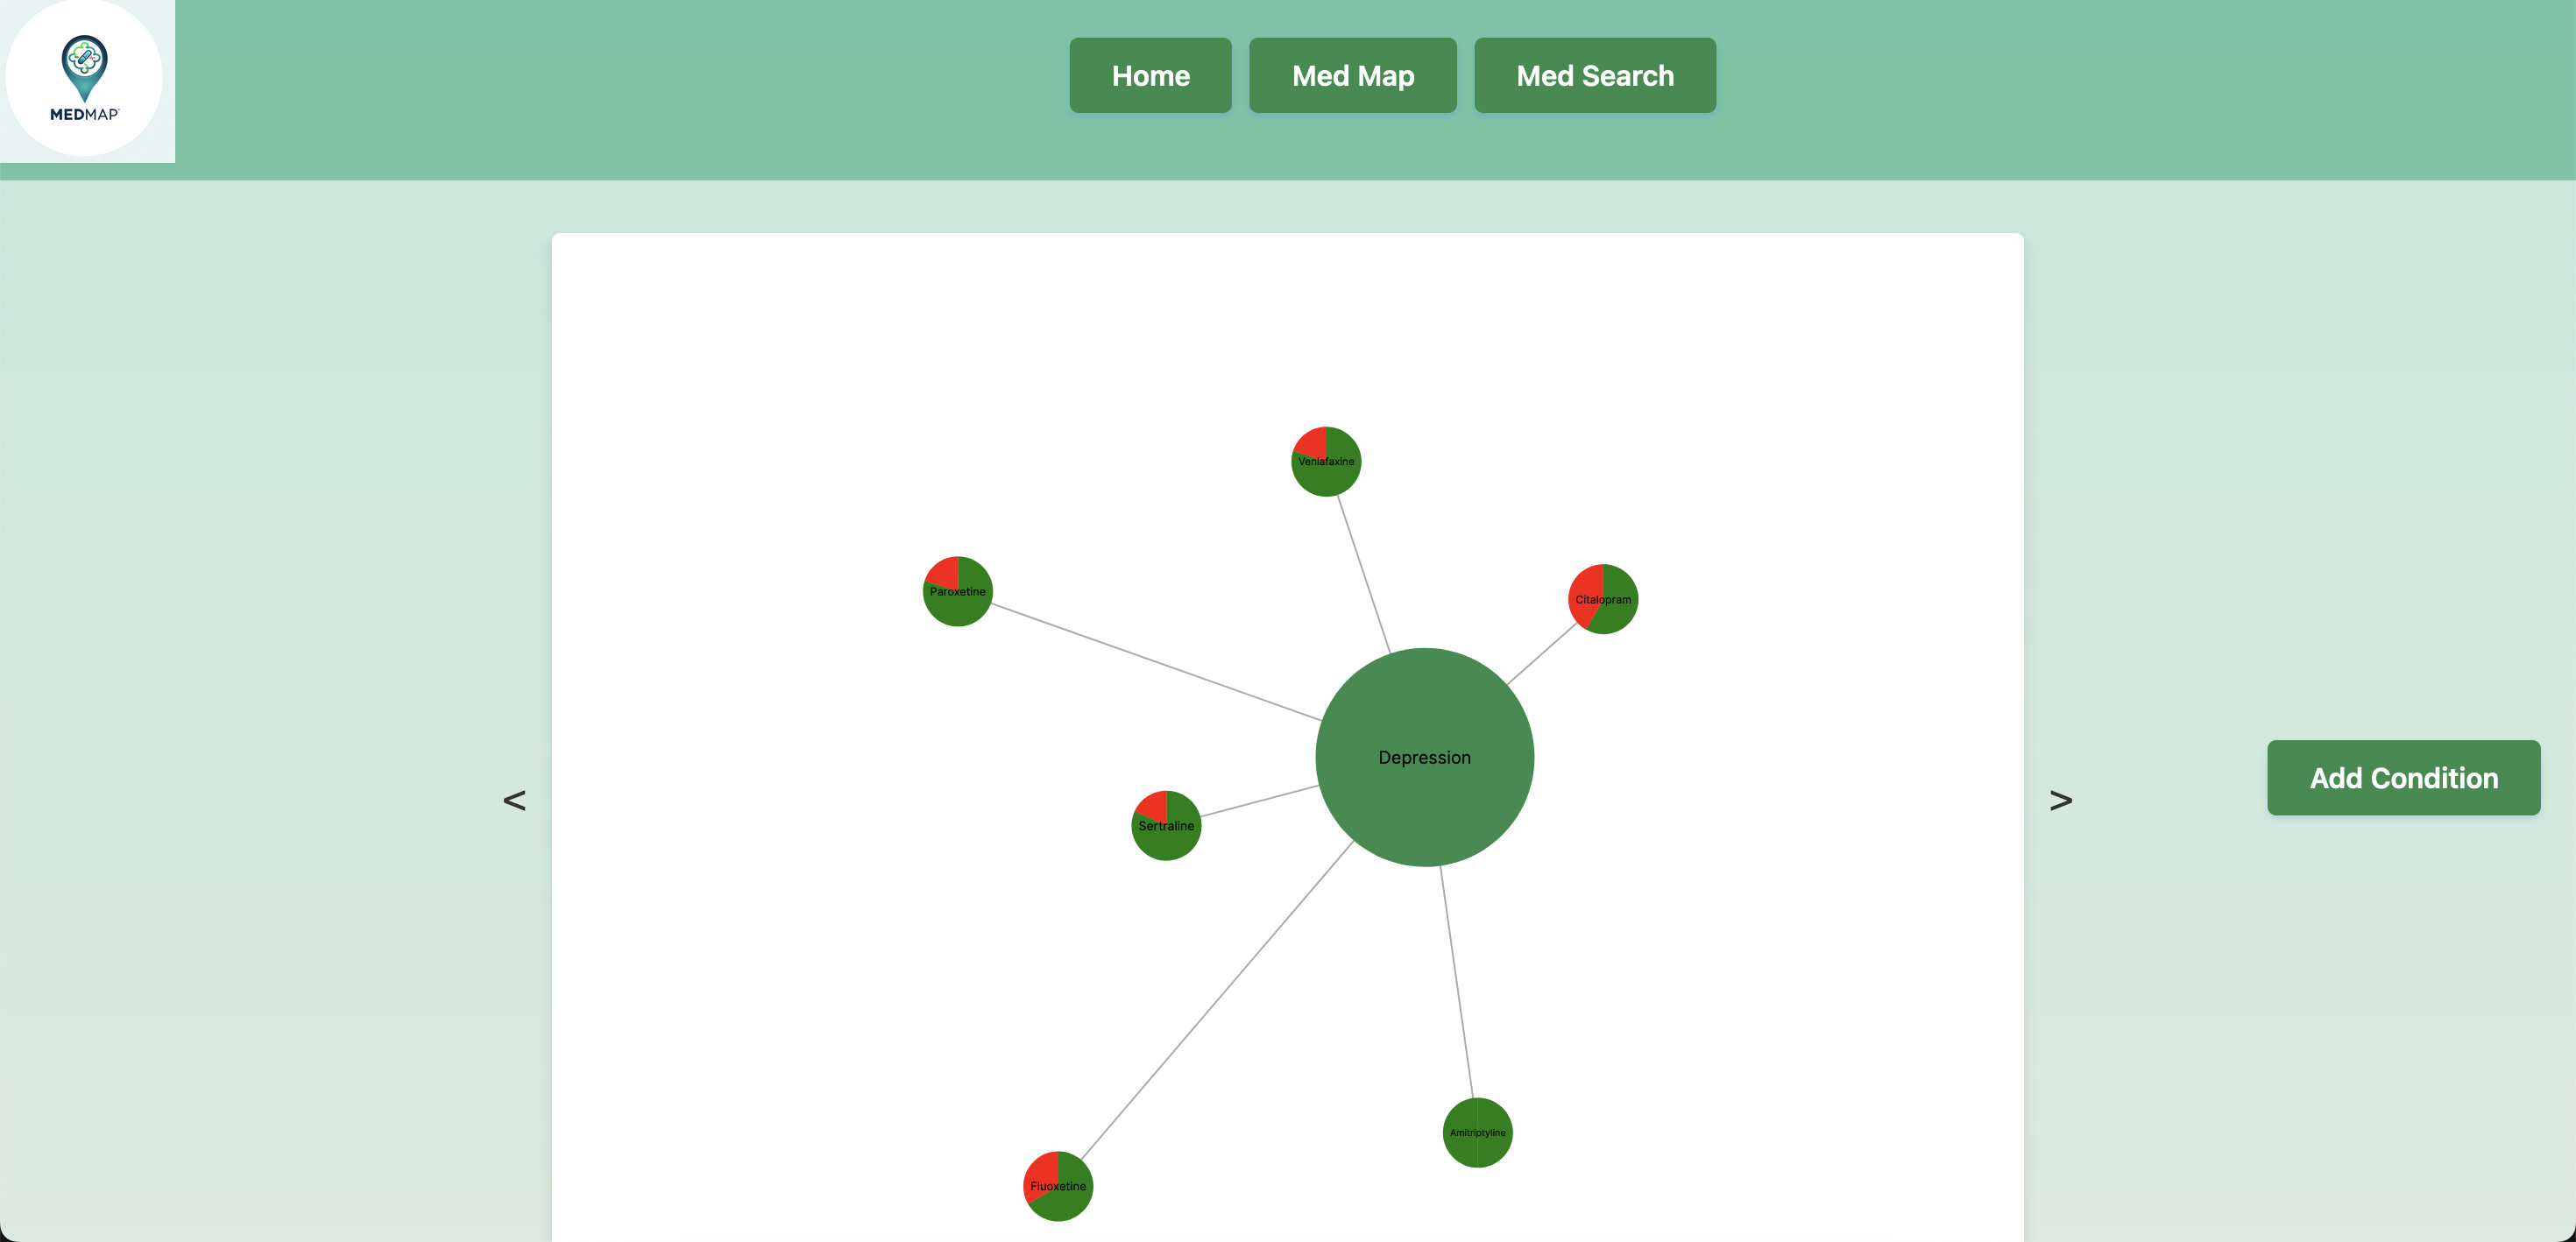
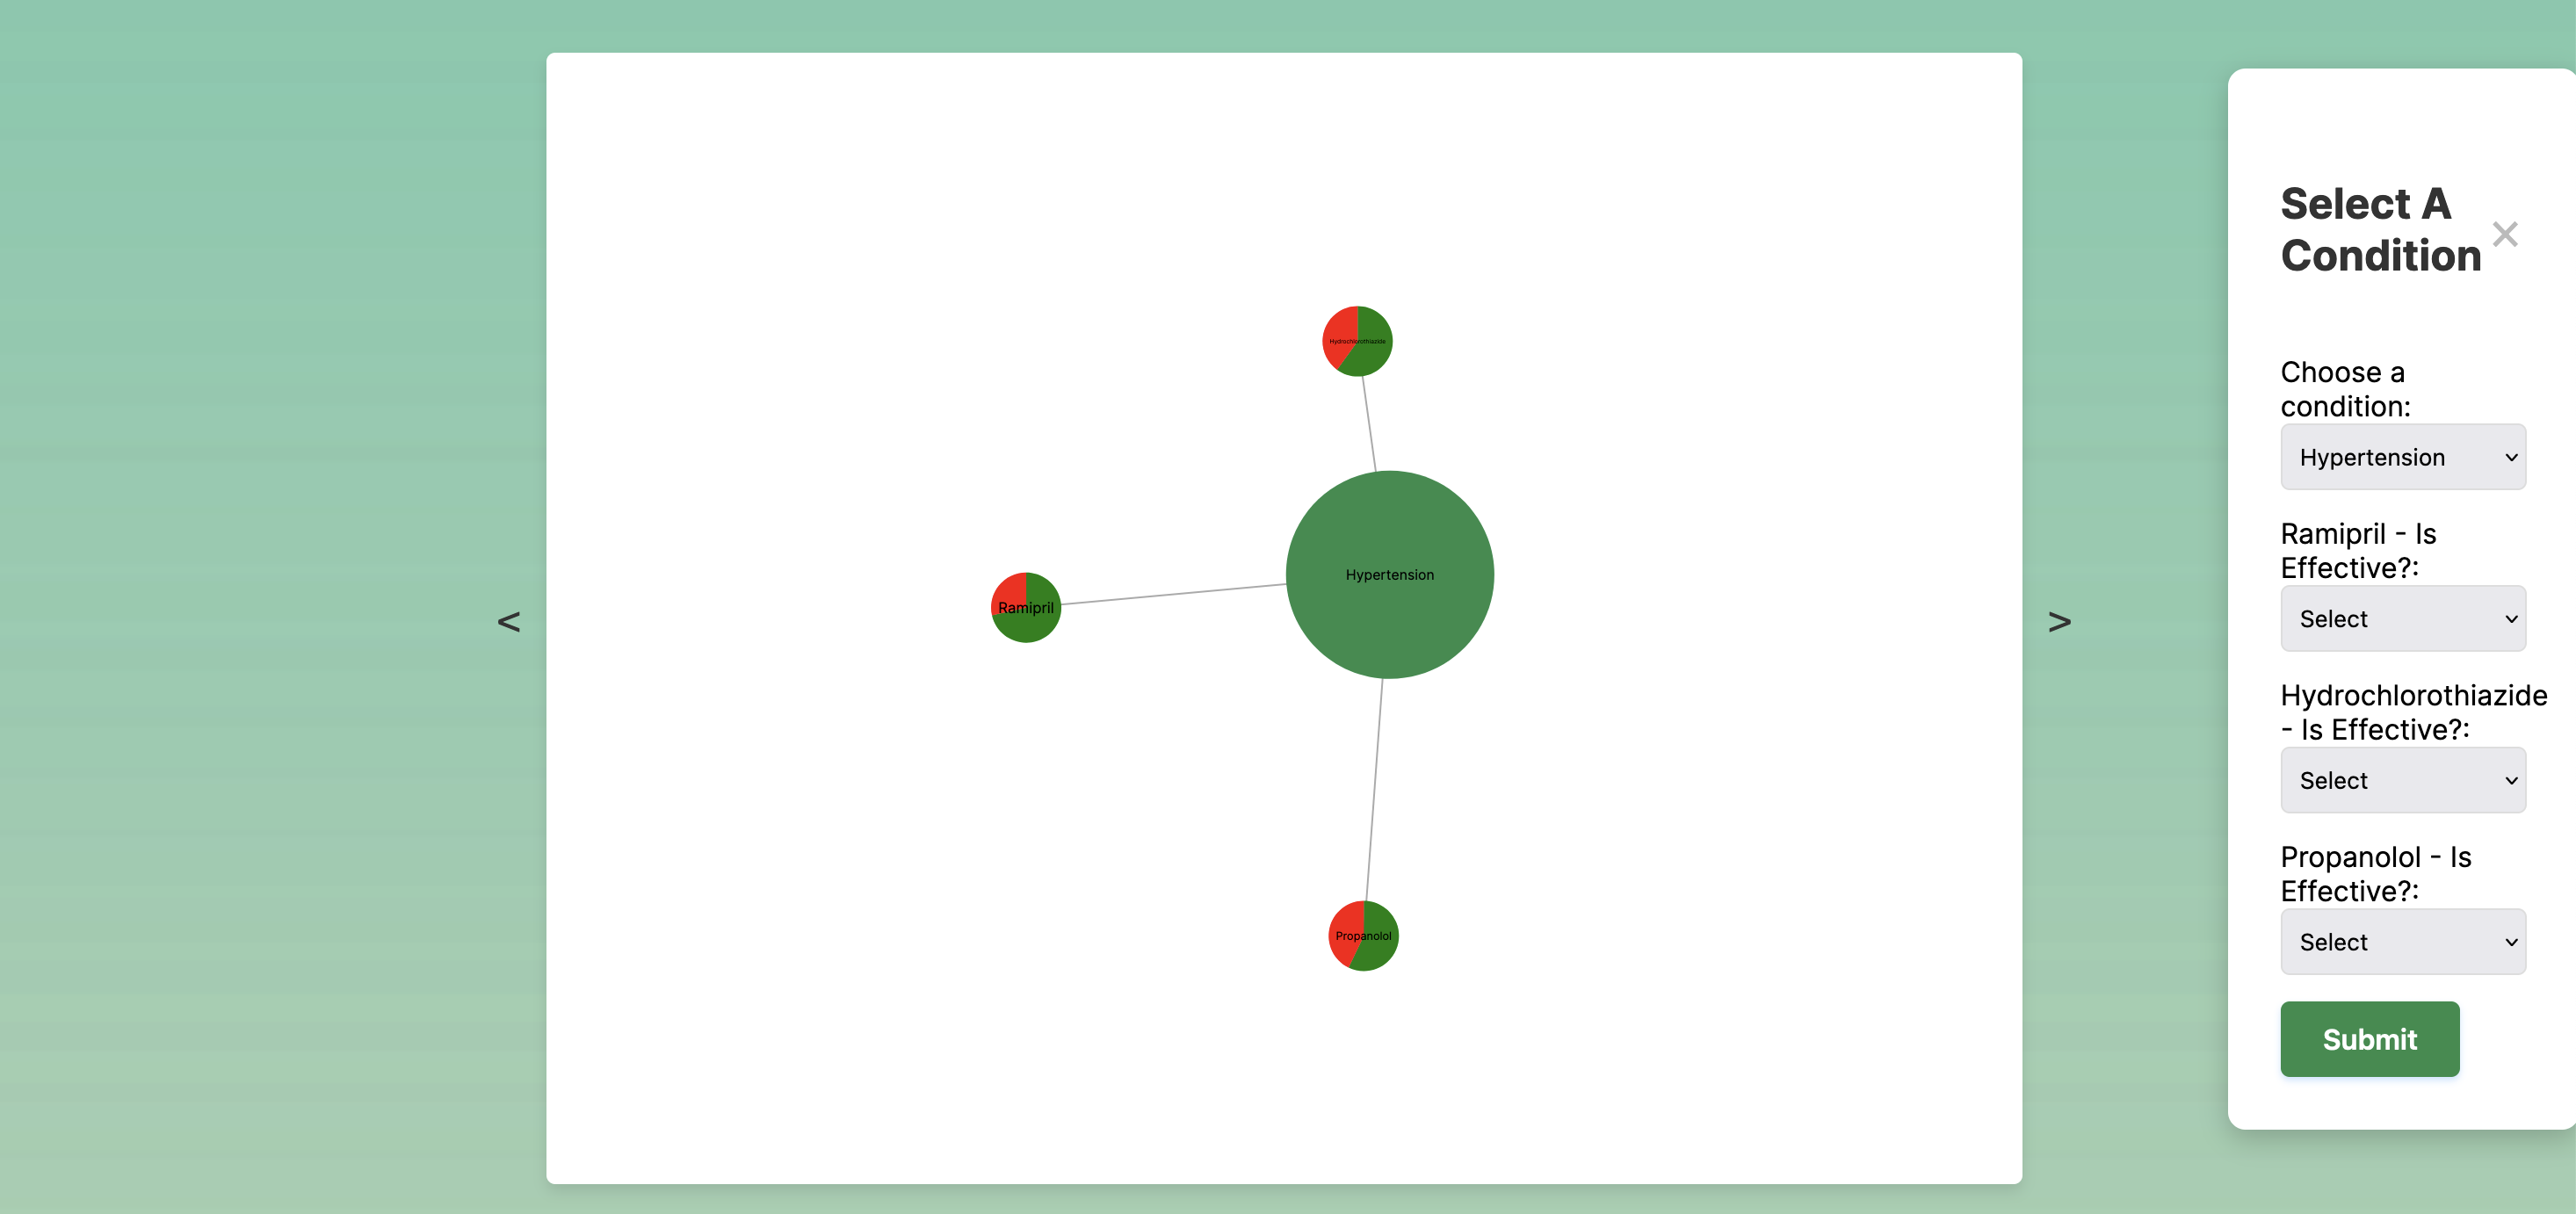
This is where MedMap comes in: it is a network/density node map that allows users to anonymously submit information about medications they have taken for any medical condition. The patient/user can add multiple medications and indicate whether that medication is effective or not.
This stream of anonymous user data is then aggregated and displayed as a central medical condition node with surrounding medication nodes. The size of the nodes indicates the number of people who have entered information for the medication and medical condition. We've implemented a pie chart system for each medication to show how many people rated it as effective vs. ineffective. By allowing the user to input their own information into a database of other users' information, we ground these stats so that the user can feel like the data is more applicable to them (since they too are contributing). The user can also see and potentially relate to others without compromising patient health information security.
What it does
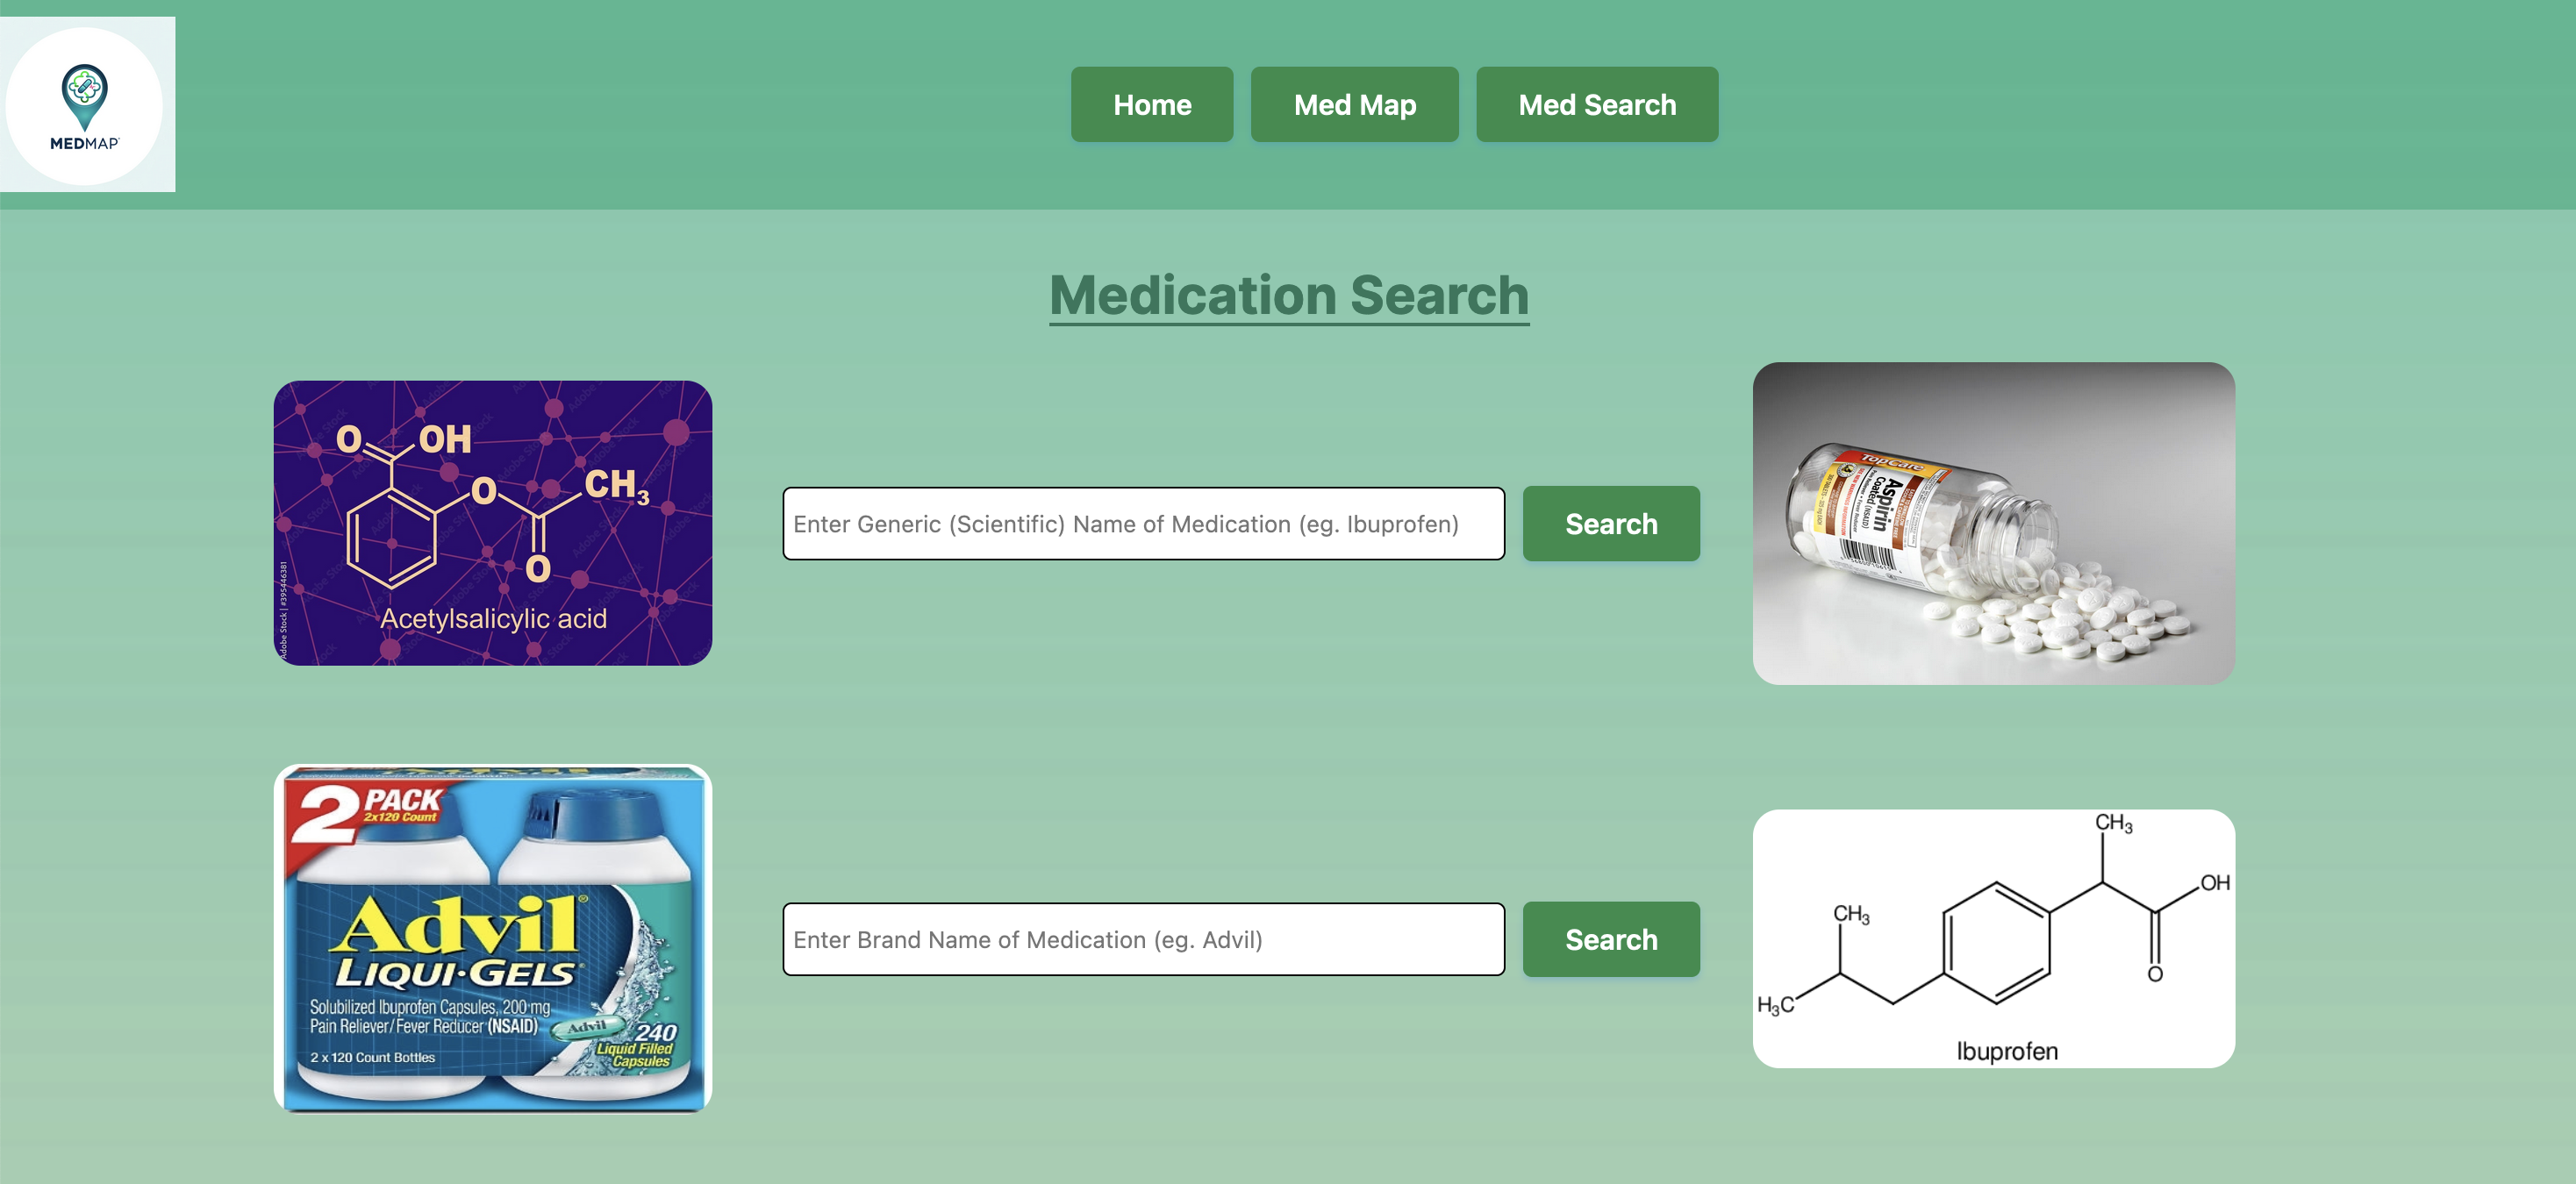
MedMap is an interactive site where we have mapped user-inputted data of medication based on effectiveness onto a real-time updating network map. You can see what medication people have used and how effective it was. We would love your input on your medical condition, which medication you took, and the effectiveness of the medication. You may also use our medication search tool to determine other names for medications you may not be familiar with.
How we built it
We used the next.js route to store user input data and retrieve data from MongoDB. With Flask, we set up a Flask server that calls Cohere chat API with user data to present specified data to the user.
Challenges we ran into
We ran into multiple merge conflicts in which we collaborated as a group and communicated our changes to ensure a smooth merge process. It was most of our first time doing front-end styling and connecting front-end to back-end using the next.js framework. We utilized each other's strengths and helped other teammates develop their learning. The d3 framework was also a challenge for us to incorporate the moving bubbles and line connections on our front end.
Accomplishments that we're proud of
We are very proud of each other's development in building a full-stack application. Everyone went out of their comfort bubbles to take on challenges in new and difficult tasks. We have all learned so much from this experience and will continue to take this learning in our future journeys.
What we learned
We learned how to develop a full-stack application with the next.js framework as well as incorporating d3 into our front-end design.
What's next for MedMap
We want to develop a data retrieval system from the FDA that takes in all the conditions and associated medications and stores in our database. Users can then search for the medication in our database and evaluate the effectiveness of the potential medications they are taking with their condition. This would improve the robustness of our project and make it usable for everyone with any medication condition.


Log in or sign up for Devpost to join the conversation.