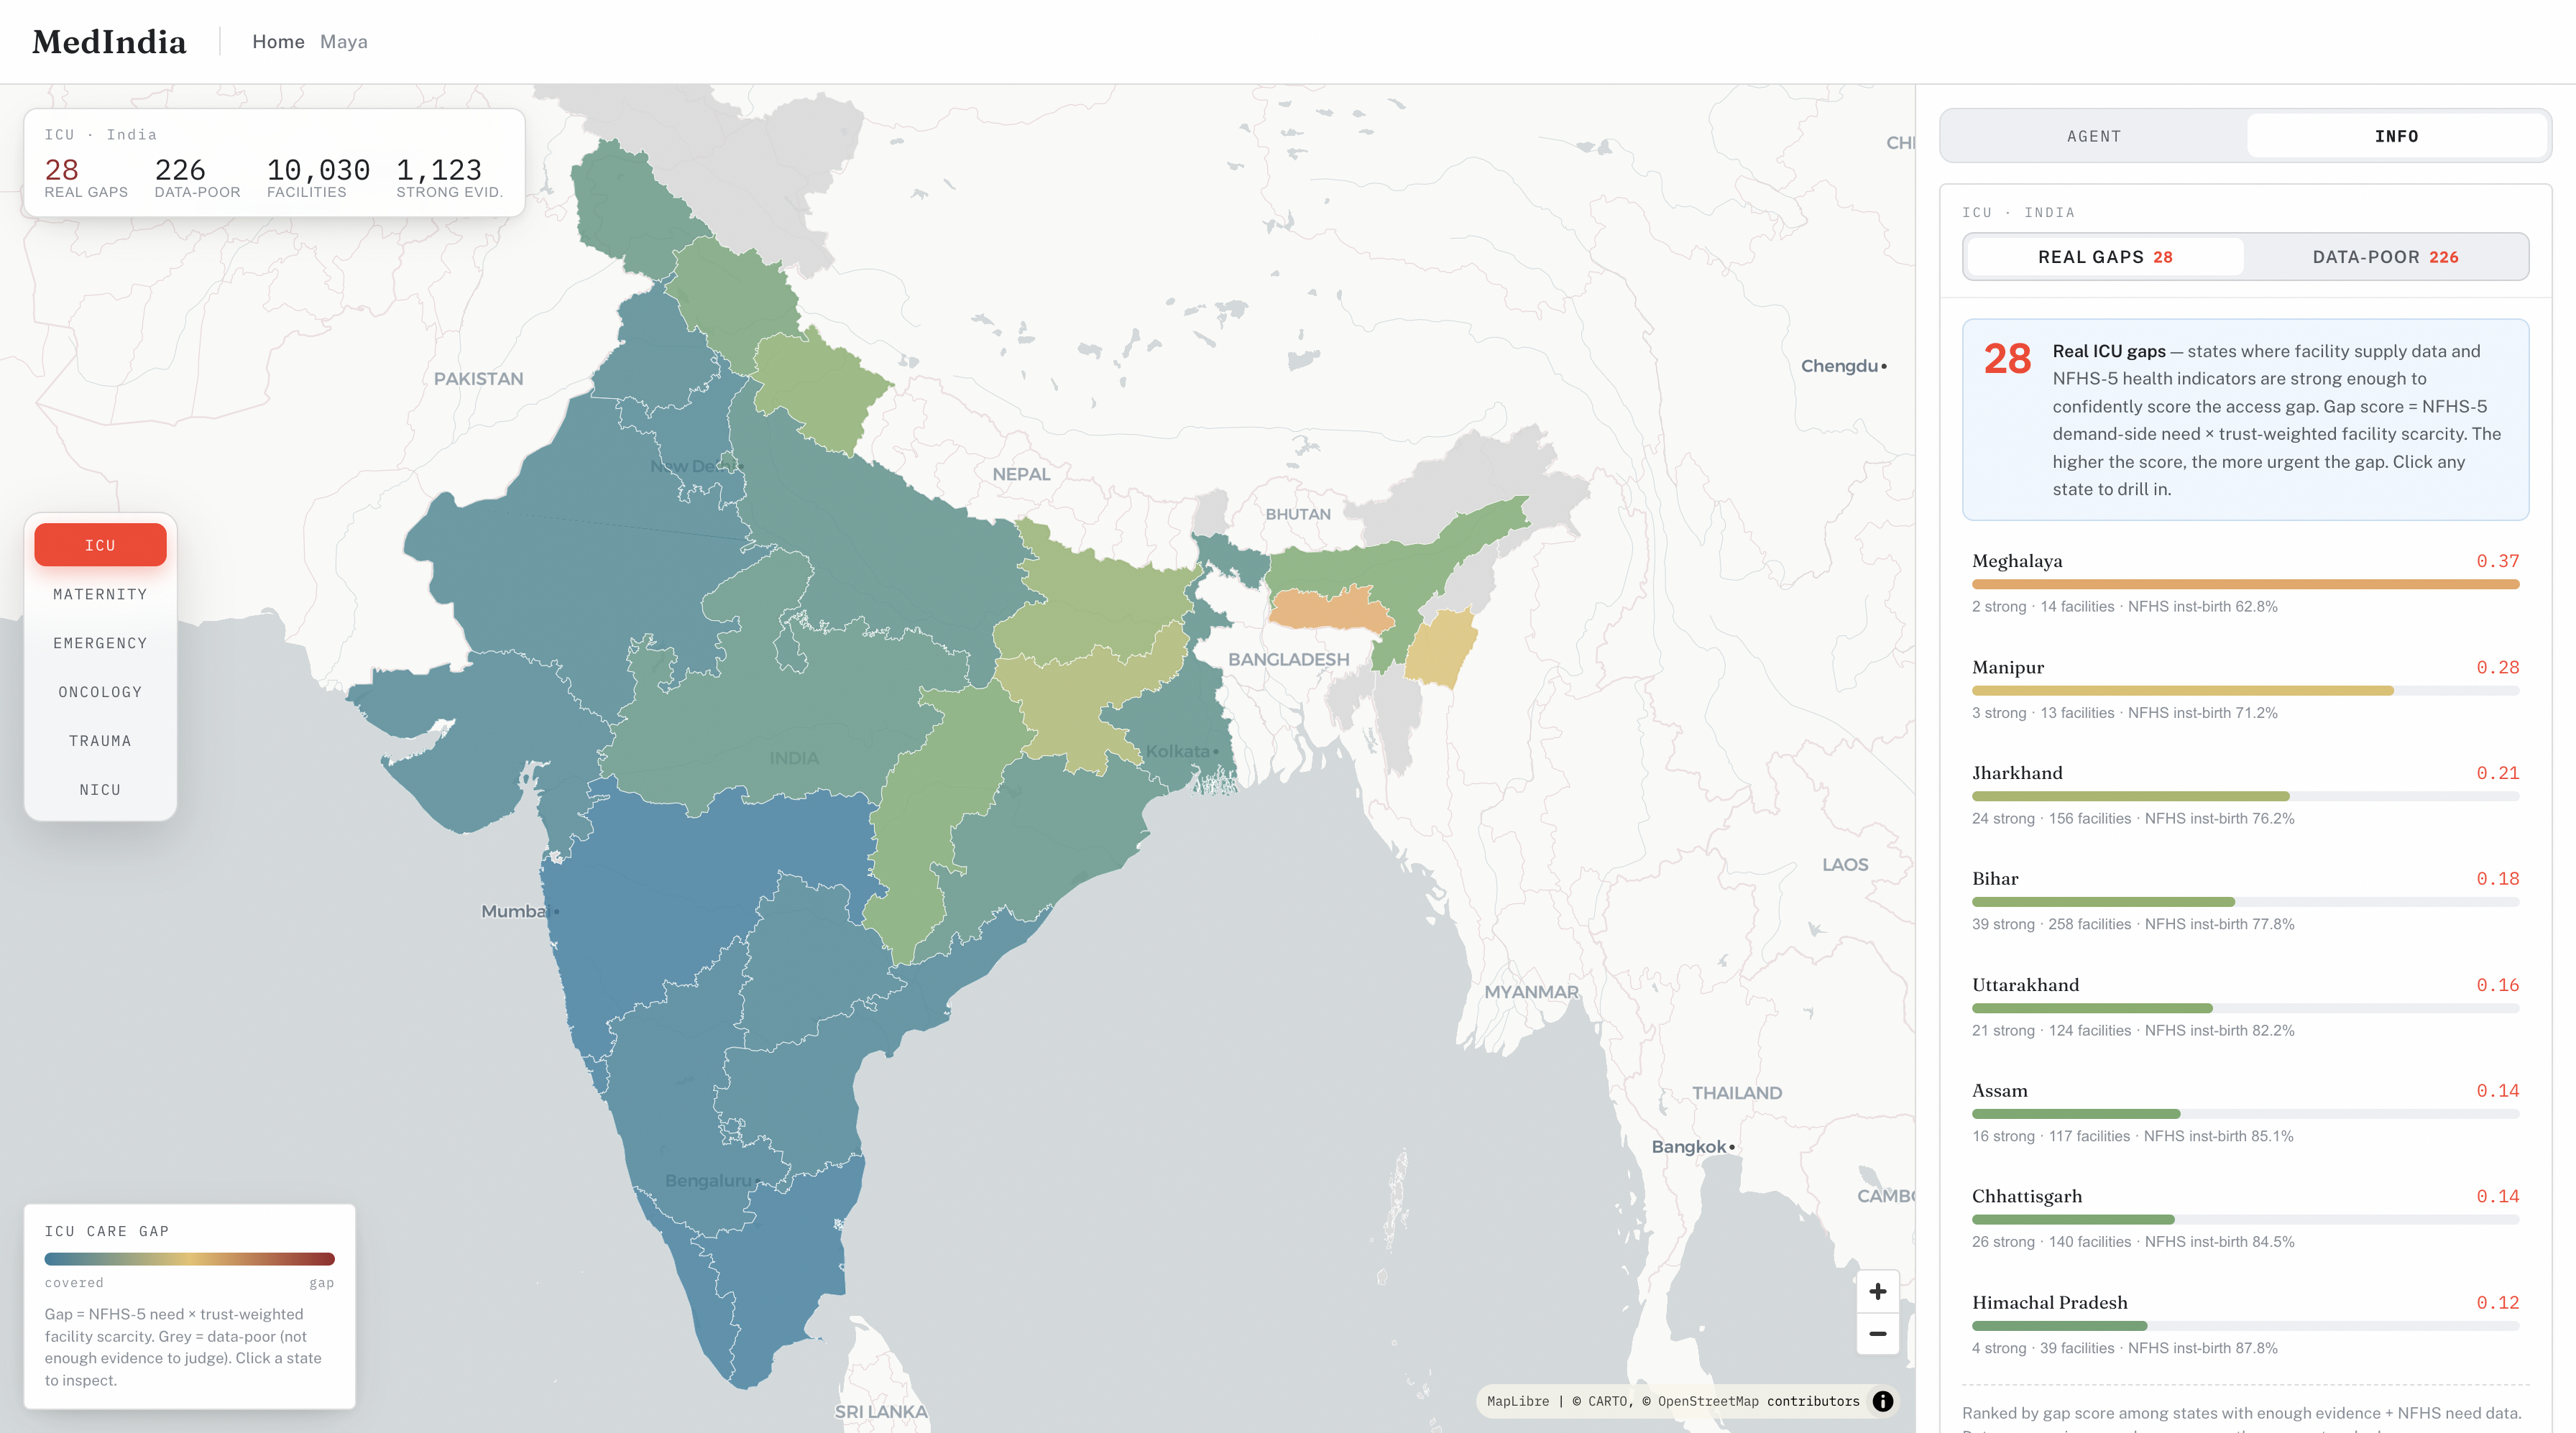
In India there are tens of thousands of under documented ICU's and countless hospitals to keep track of cleanly. MedIndia is a web-based agentic data application for non technical health planners and institutional funders who want to help with the crisis but may not have technical backgrounds. A user selects a clinical capability ICU, Maternity, Emergency, Oncology, Trauma, or NICU and the app renders an interactive color coded map of India showing regional care gap scores at the state level.
The key design decision: the app explicitly highlights two types of problems:
- Real gaps — states where the data is strong enough to confidently score the access gap. These are colored on the map from blue (well-served) to red (severe gap), based on a mathematical NFHS-5 formula.
- Data-poor regions — states or territories without enough verifiable facility records or NFHS-5 indicators to produce a reliable score. These appear grey meaning the evidence is missing, which is an indicator finding that should drive data collection.
Please access the README for app login!
From the map, users can:
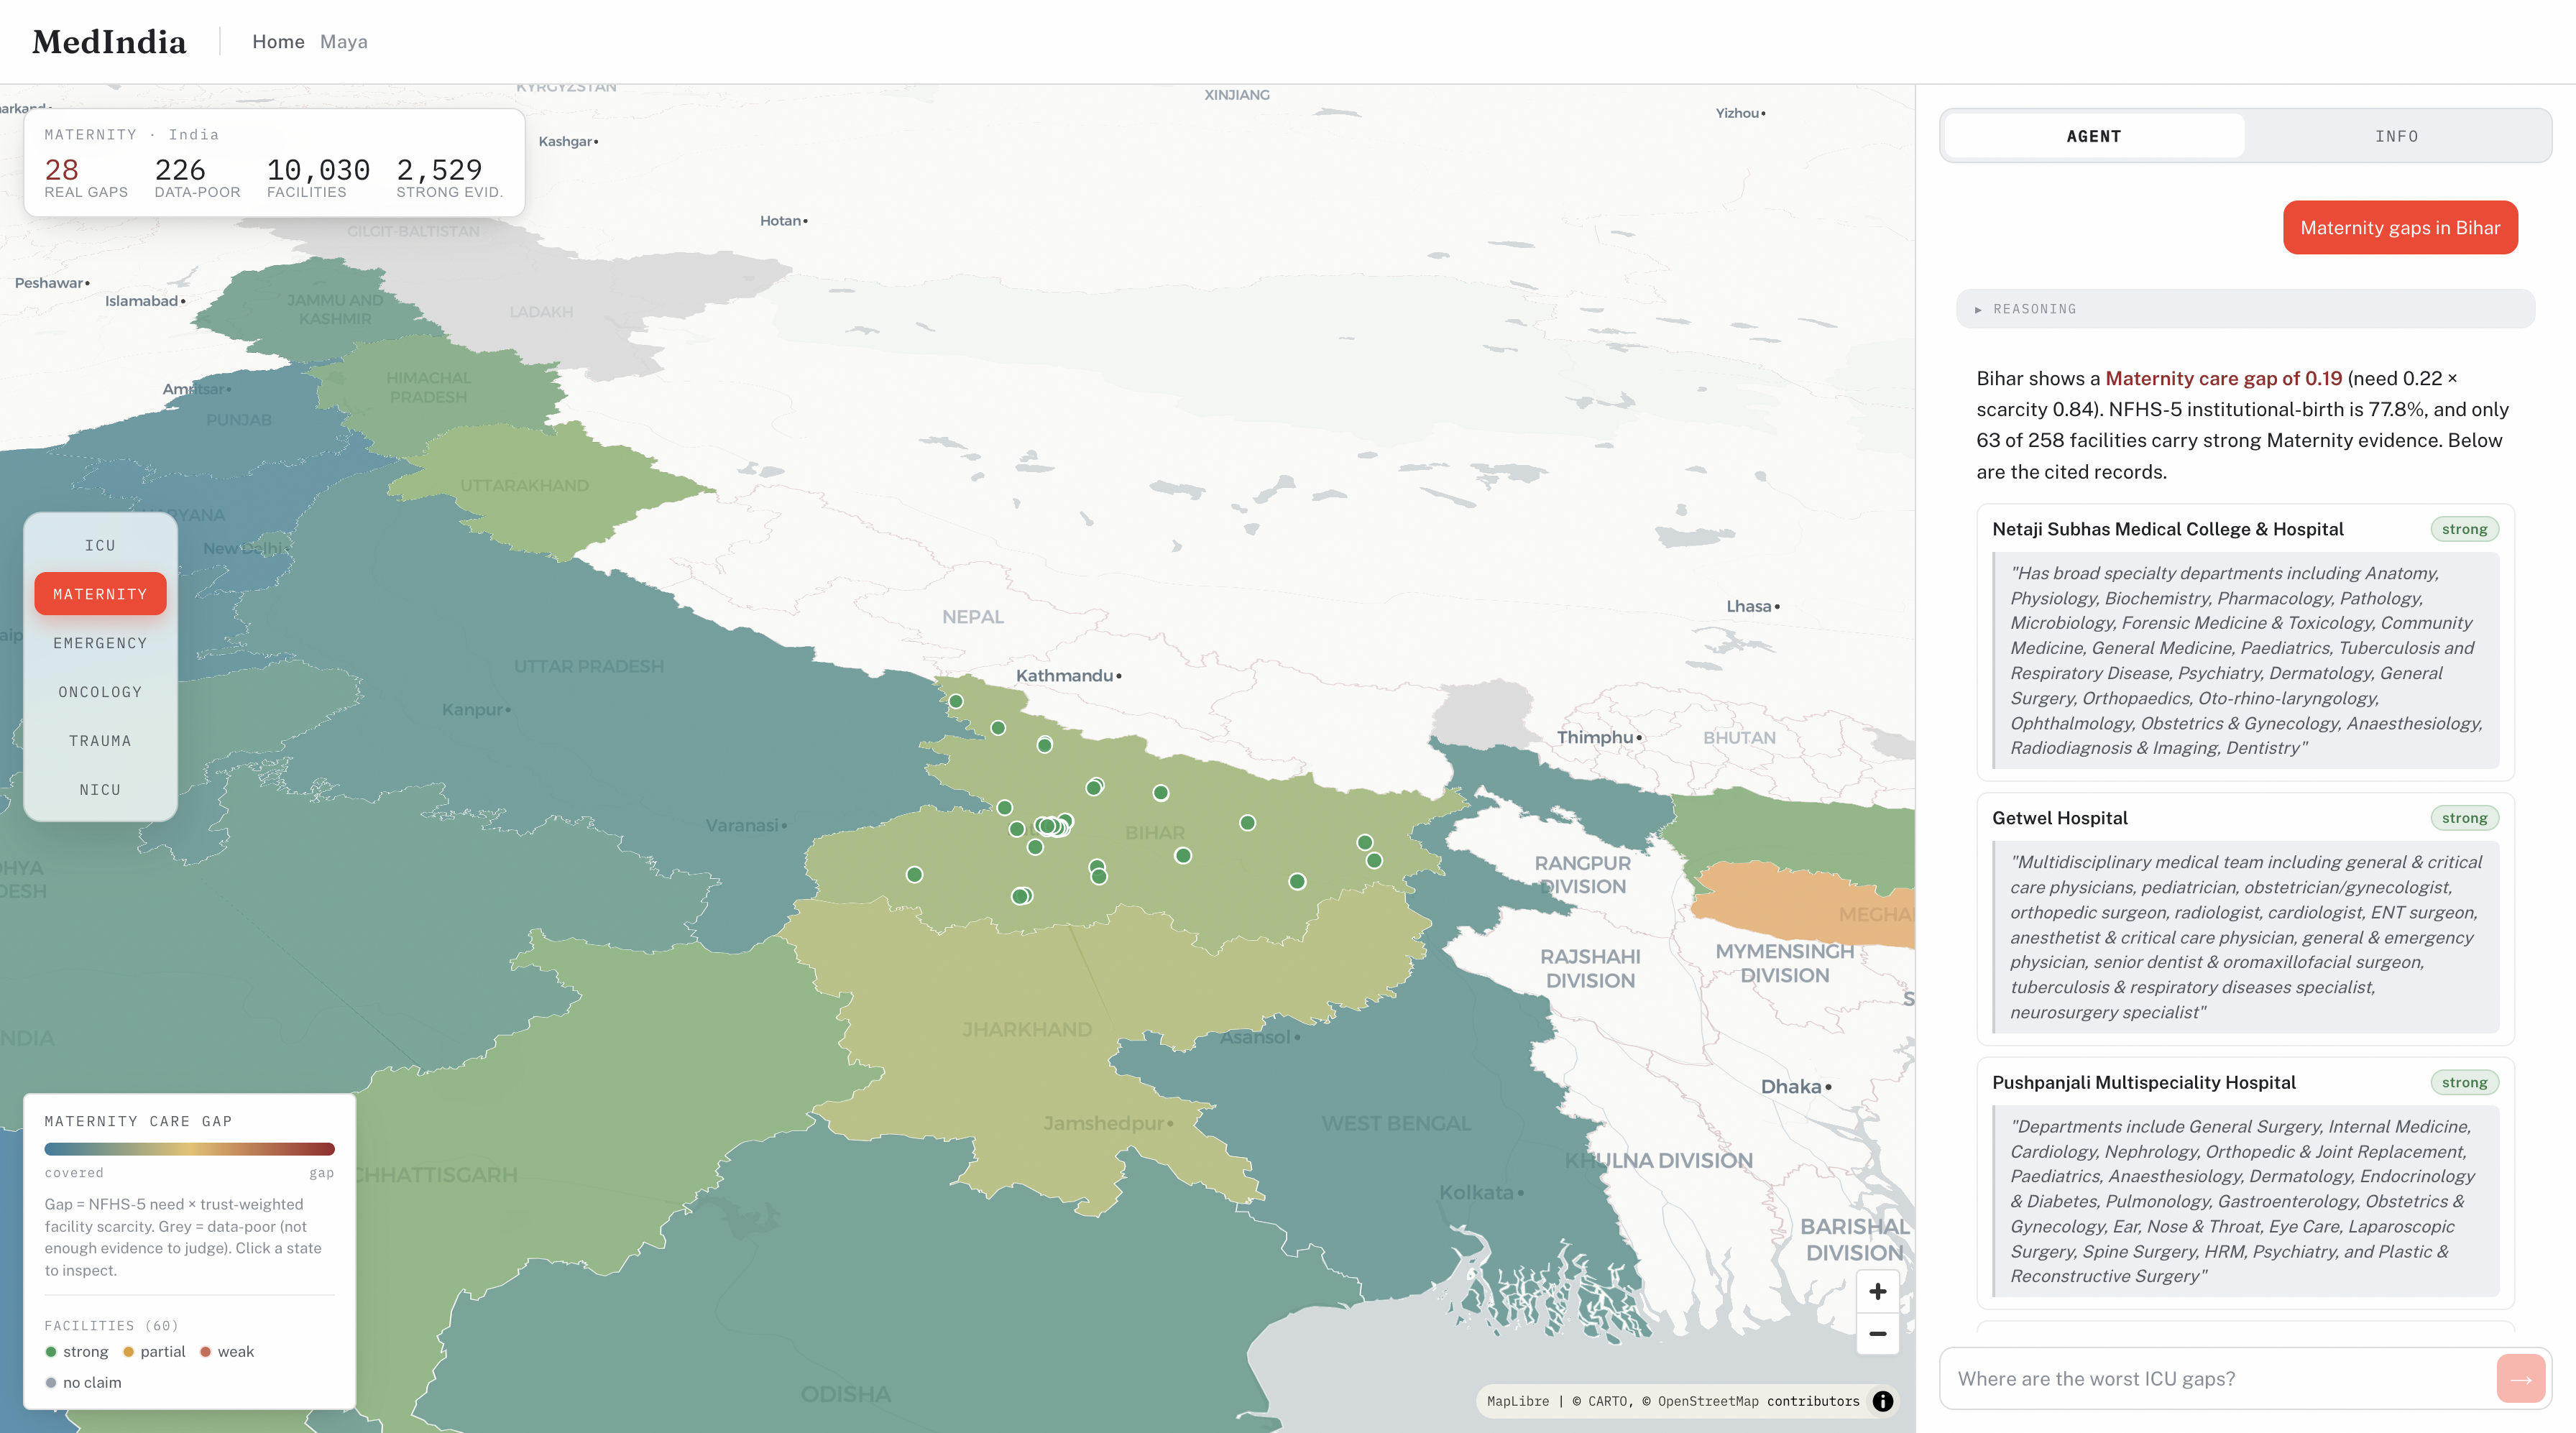
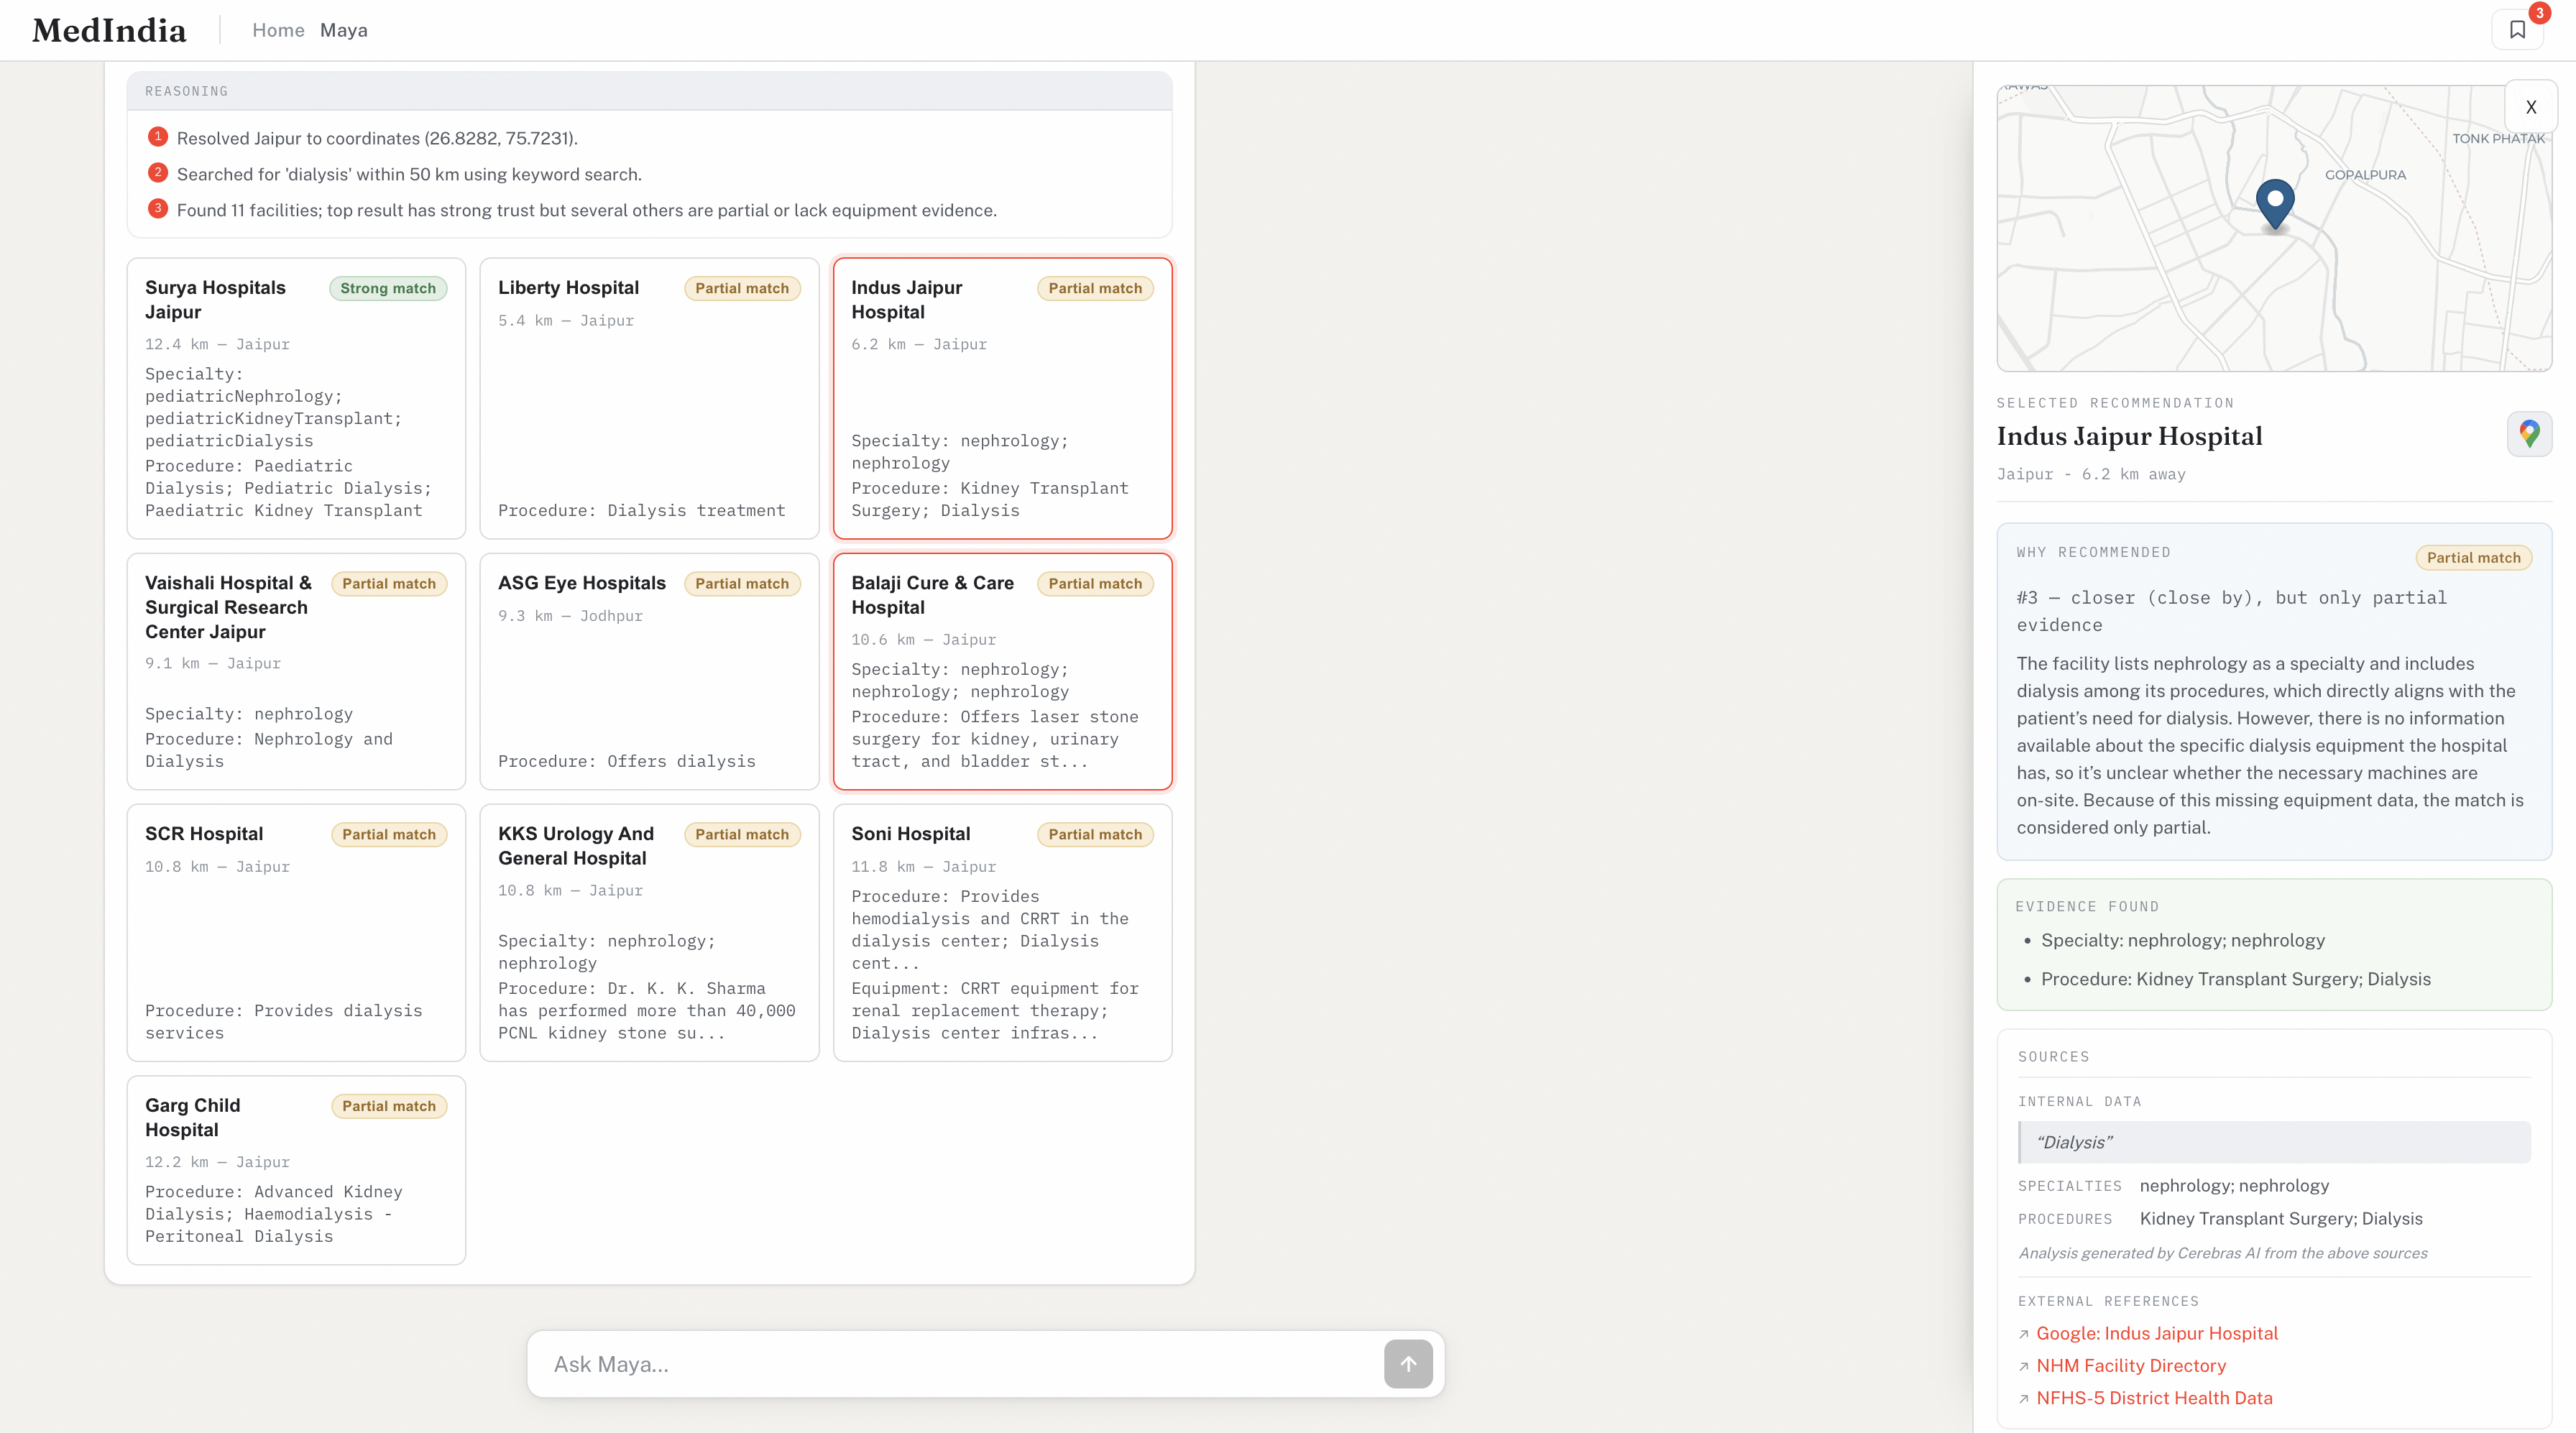
- Dive deeper and drill into its facility records, see individual hospitals with trust ratings, read the free-text evidence behind each rating, and get cited reasoning for the gap score.
- Ask the AI agent natural-language questions to get answers grounded in the actual data, with a Databricks Genie-powered conversation that can run live SQL and return results as charts. This feature is perfect for users who may not have data analytics and technical backgrounds to fetch and analyze messy data themselves.
- Save planning scenarios to bookmark regions of interest, add notes, build a shortlist of specific facilities to follow up on, and persist everything across sessions via Lakebase.
- Explore facility photos, a reliable Wikipedia image enrichment pipeline ran across thousands of facilities, attaching real photos to map pins where available, so planners can quickly visually verify hospitals before committing resources.
How We Built It ....
Data Pipeline
All data lives in the Databricks Lakehouse built from the Databricks Marketplace dataset (≈10,000 facilities, India PIN directory, NFHS-5 district health indicators):
- 1. raw facility records and NFHS-5 indicators ingested as-is into Delta tables.
- 2. normalized state names, capability detection from free-text fields, and per-facility trust signal assignment based on whether structured data and free-text claims agree.
- 3. individual facility evidence used for citations and map pins. Wikipedia-sourced image URLs matched to facilities by name.
The gap score formula creates an objective metric that combines:
- Need index: NFHS-5 indicators (institutional birth rate, insurance coverage, health burden proxies) normalized per state.
- Scarcity index: trust-weighted facility density (strong-evidence facilities count more than weak ones).
- Gap score = need × scarcity, bounded [0, 1].
Image Webscraping
A Python pipeline queried the Wikipedia REST API for each facility, matched hospital images by confidence scoring, and added locations to the interactive map. Results are joined at query time so map pins display real photos where available.
Application Layer
The app is built with Next.js (App Router) deployed as a Databricks App on Free Edition. Next.js handles both the React frontend and the API routes that serve as the backend.
Key API routes:
- gap scores for all states for a given capability (powers the map choropleth).
- individual facility records for a selected state (powers the drill-down panel and map pins).
- orchestrates a Genie conversation turn in parallel with a SQL fetch of regional data, then merges the AI answer with cited facility evidence and an inferred chart spec.
- Lakebase-backed persistence for saved planning sessions.
- Wikipedia image URLs for map pin popups.
Databricks integrations used:
- SQL Statement Execution API — all analytical queries, fully parameterized (no string concatenation), with chunked result fetching.
- Genie Conversation API — natural language Q&A with multi-turn conversation support. Genie runs live SQL against the gold tables and returns both a text answer and a query result we visualize as a bar or line chart.
- Lakebase (Databricks Postgres OLTP) — persists user scenarios and shortlists with a
pgconnection pool; survives across sessions without touching the analytical warehouse. - Unity Catalog governs all gold tables; all warehouse access is scoped to least-privilege tokens loaded from environment variables.
AI Agent
- Parses the natural-language question to extract intent, capability, and geography using synonym dictionaries and whole-token state matching.
- Plans the SQL steps needed to answer it.
- Merge Genie's text answer + cited facility evidence into a single JSON response.
- Gives human readable and non technical explanations on reasoning and thought process.
- Generates visual and simple graphs
Built With
- databricks

Log in or sign up for Devpost to join the conversation.