-
H&E Stained Image: https://www.cancerimagingarchive.net/collection/osteosarcoma-tumor-assessment/
Inspiration
I am currently a mathematics student researcher using topological data analysis to train a machine learning model on multi-class identification using H&E stained histology images. It was difficult for me to understand what was happening in these images and know parts of the image were important to segment. When training machine learning models, 'data is king'. Without understanding the data you're working with, you're already setting yourself up for failure.
What it does
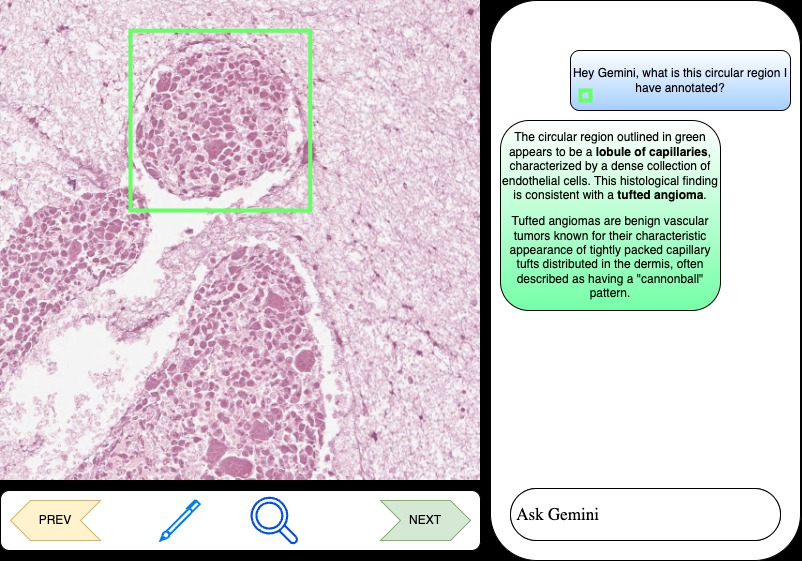
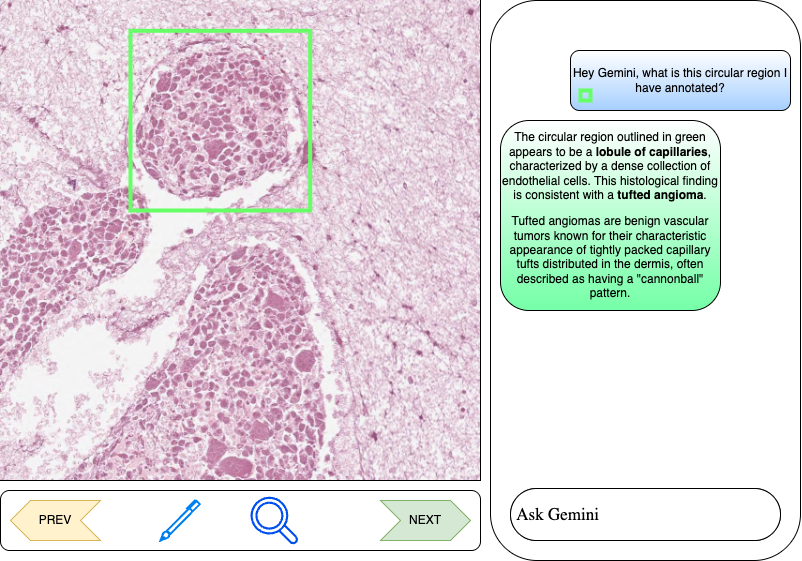
A user inputs a local directory on their computer or uploads multiple images onto the website. The site displays an image with a chat box to the right. The user can seamlessly slide through different images and ask the chatbot what is happening in each image. In many medical image data like H&E stained histology, the general structure of the image varies widely from image to image and it's difficult to understand specific regions of interest. The user is able to annotate/draw on the image to pinpoint a specific region of interest that the chatbot can explain more in depth on. The chatbot may also provide sources for the user to read up on their own.
How we built it
Built using react for the frontend and python for the backend.
Challenges we ran into
We had an issue implementing an image annotation library using react and couldn't actually debug the issue before the deadline.
What we learned
We learned how to create a basic app using react and python flask.
What's next for EasyAnalyze
Since the code is currently still in its debugging phase, we'll be able to publish the code publicly after solving the problem. Some ideas to add on to the project would be to

Log in or sign up for Devpost to join the conversation.