Inspiration
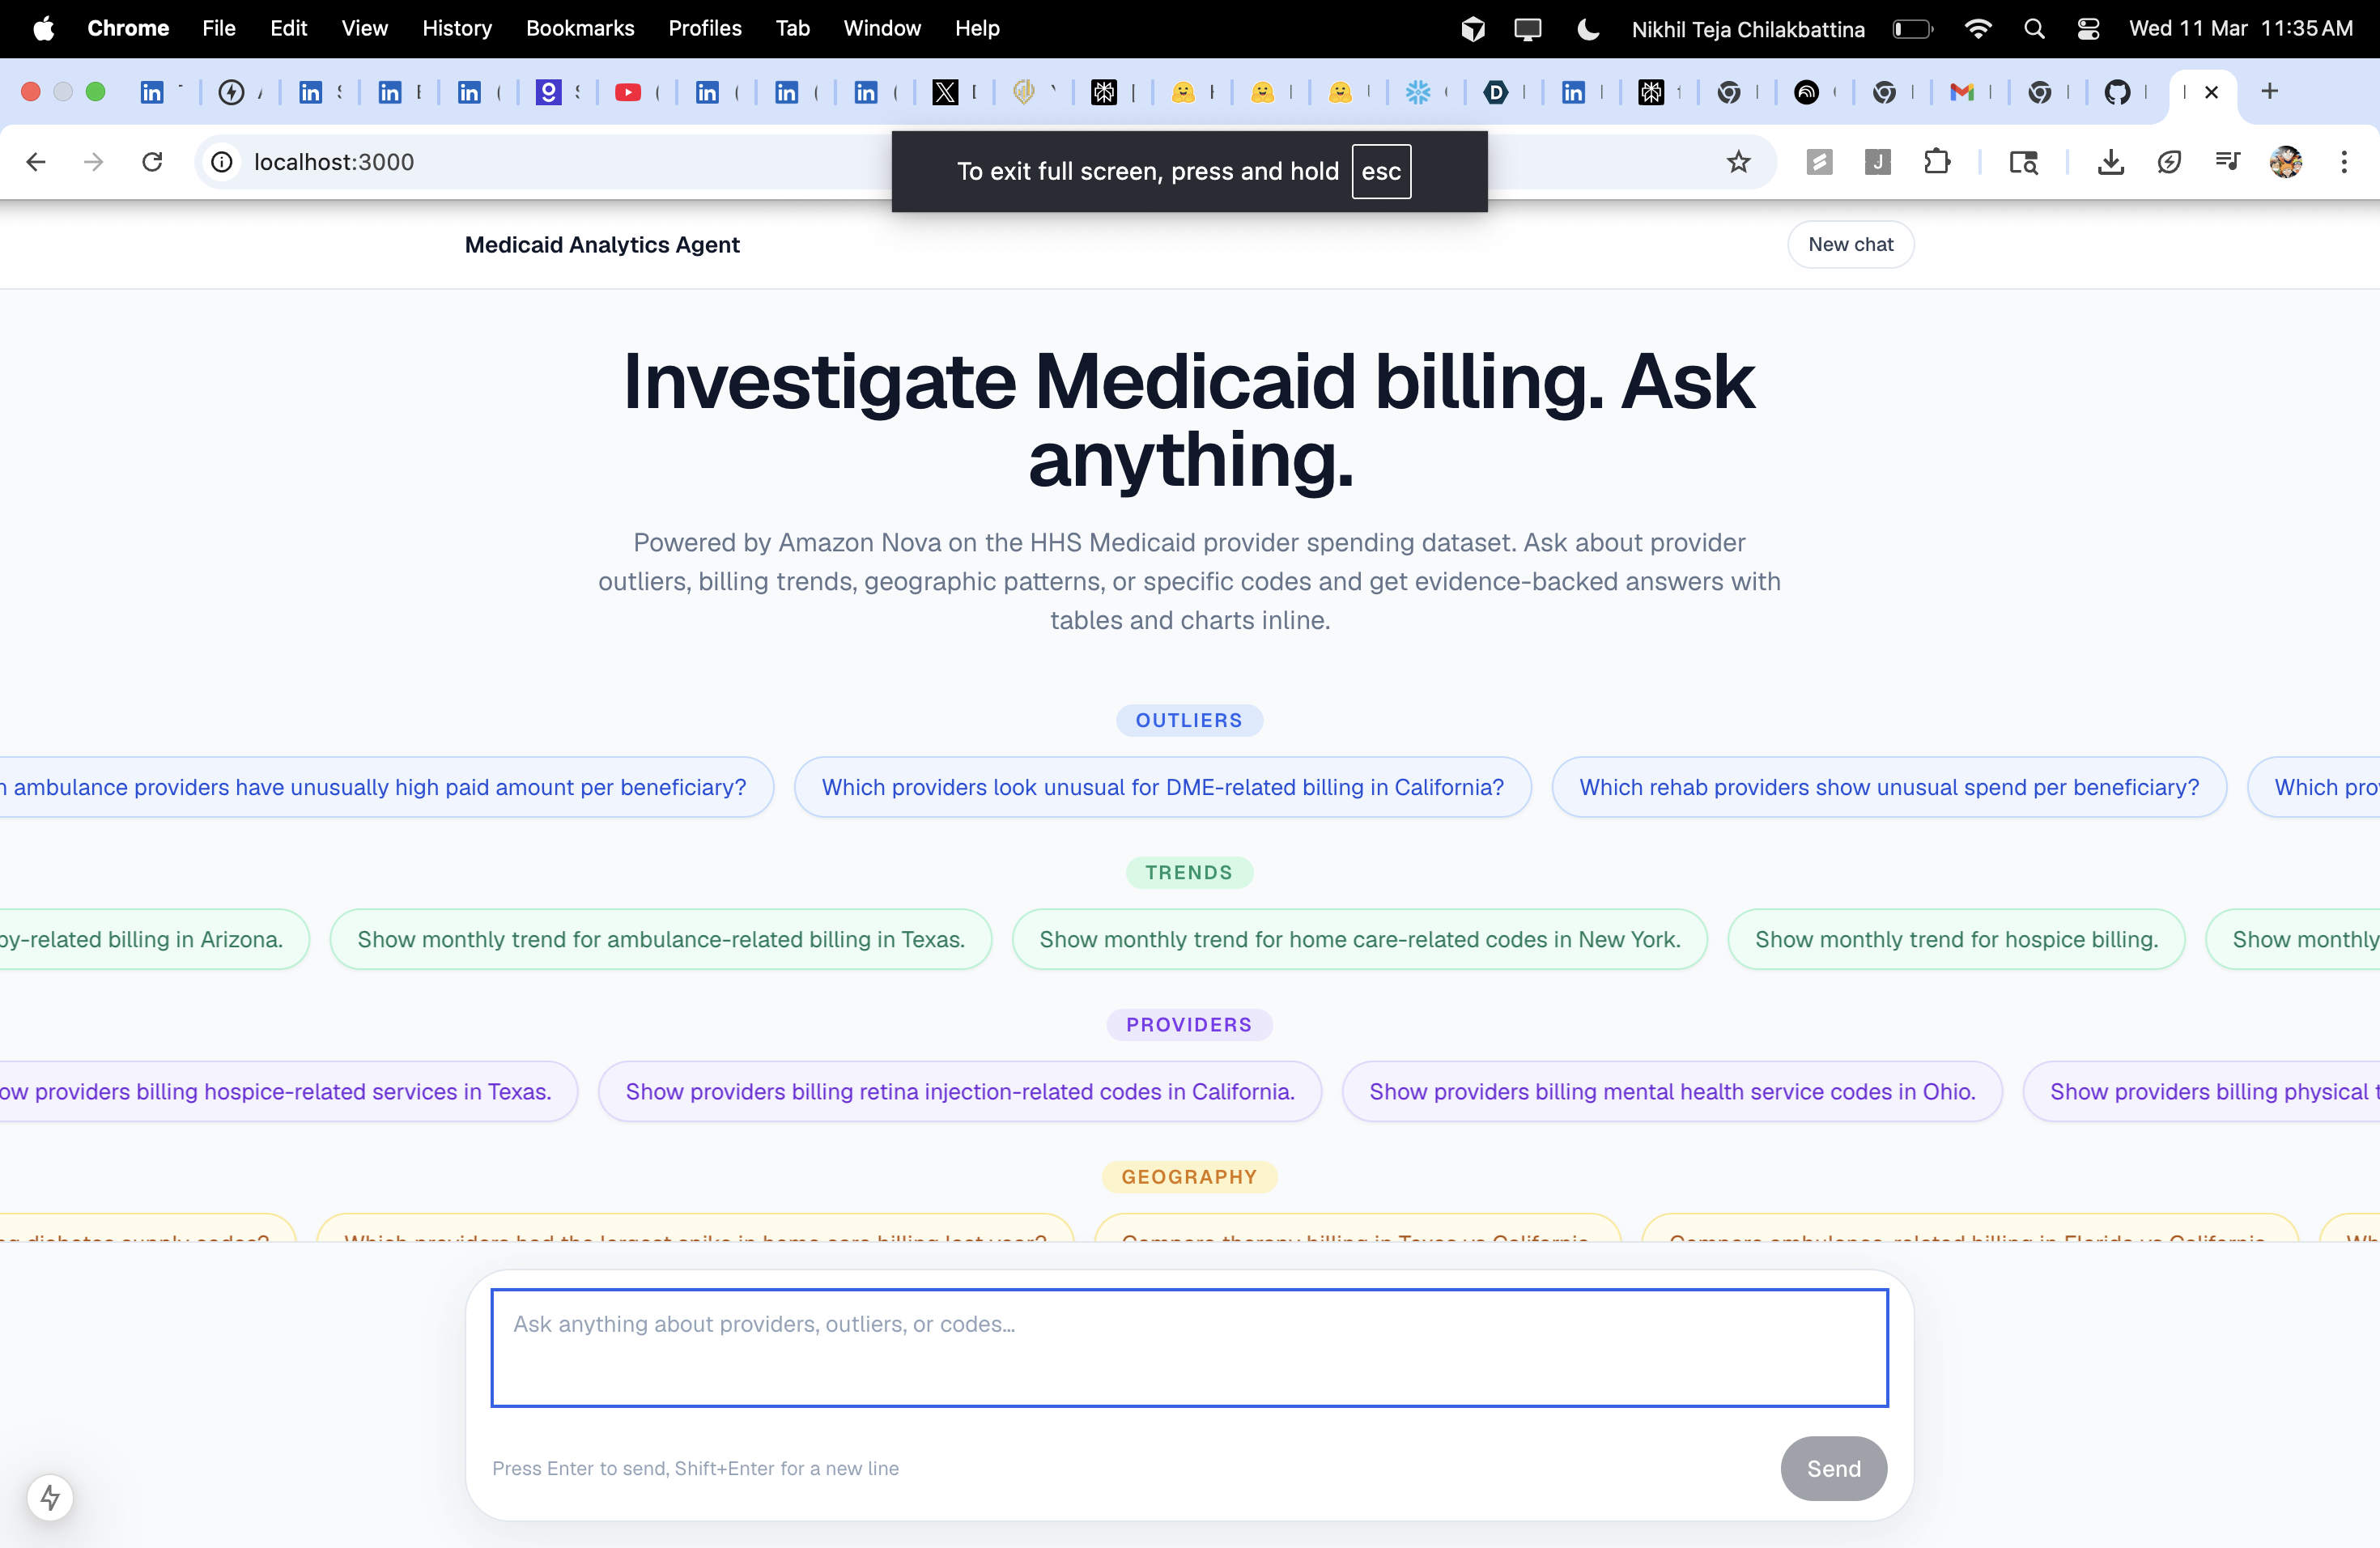
The February 2026 release of HHS Medicaid provider spending data sparked a wave of public scrutiny — journalists, researchers, and policy analysts asking the same kinds of questions: Which providers are billing at rates far outside their peers? Which ABA therapy providers in Texas are billing the most? How did spending for a specific code change over the last six years?
The problem was that answering even one of these questions required SQL knowledge, access to Snowflake, and hours of data wrangling. We wanted to make that instant — let anyone ask the question in plain English and get a real, evidence-backed answer in seconds.
What it does
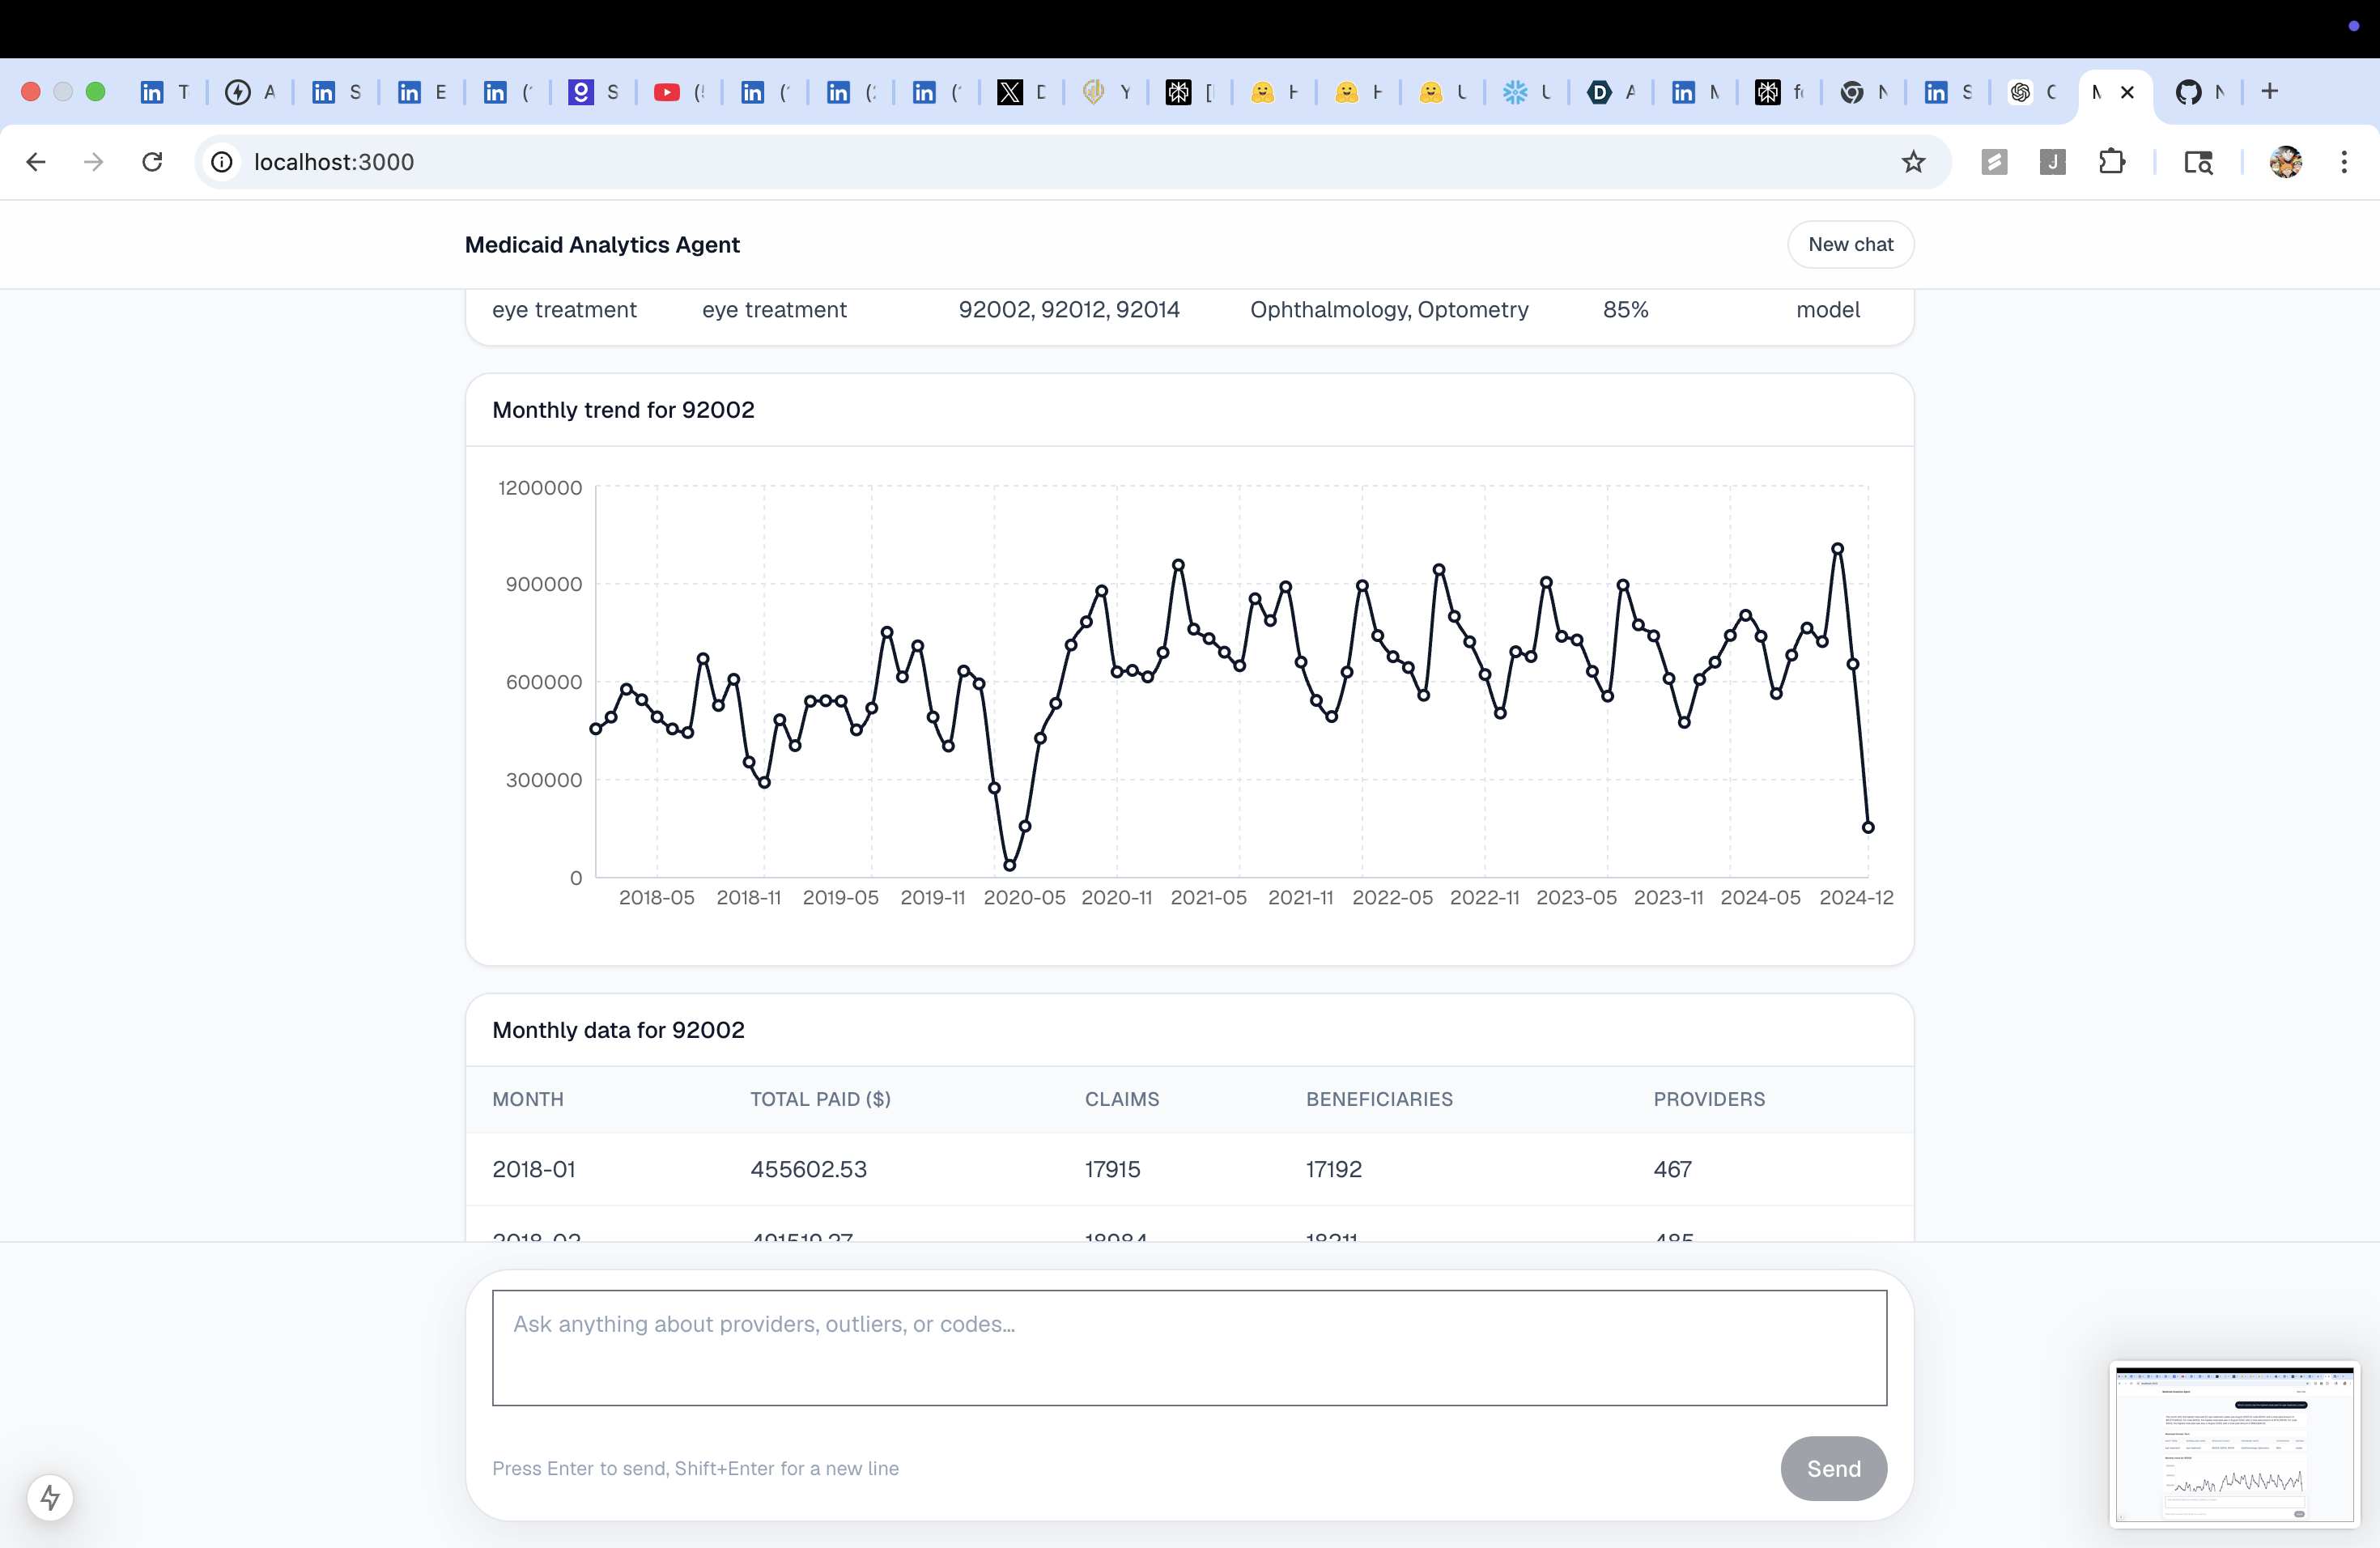
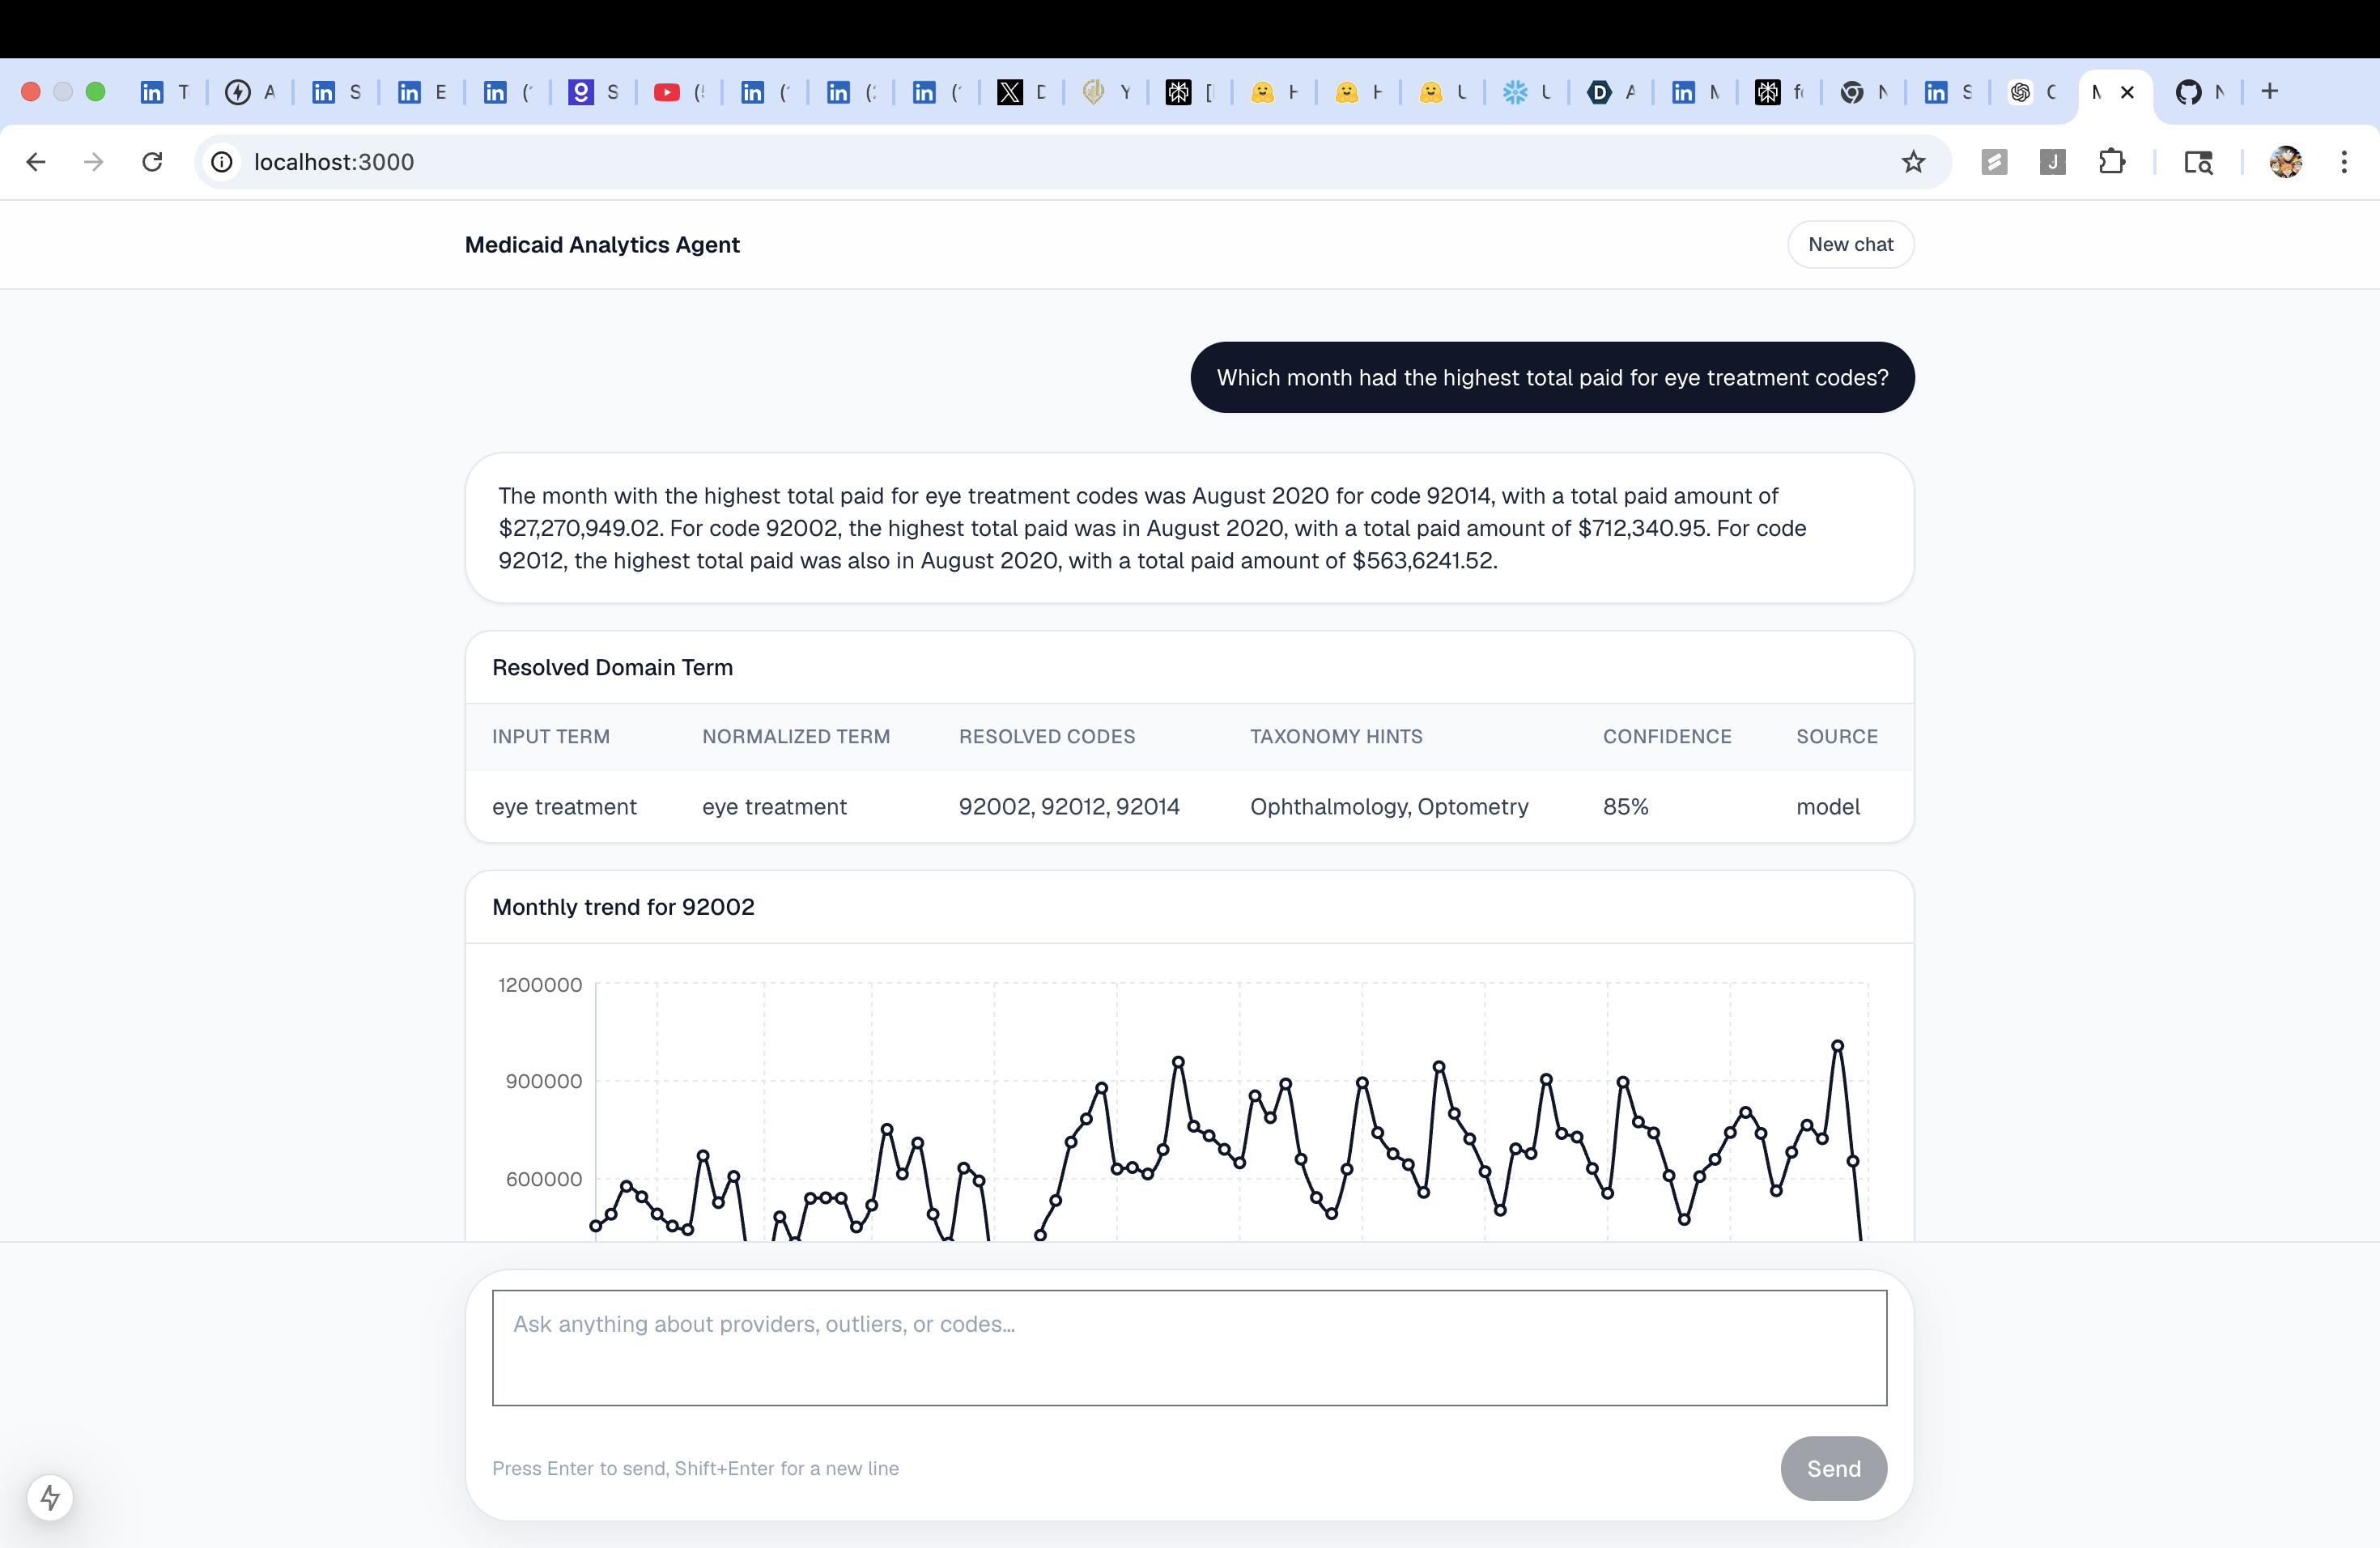
Medicaid Analytics Agent is a chat-first analytics workspace over the HHS Medicaid provider spending dataset. You type a question; the agent figures out what data to pull, runs the right queries against Snowflake, and renders the answer inline as narrative text, tables, and charts — all in one conversation.
Questions it answers today:
- "Which providers look unusual for mental health billing in Ohio?"
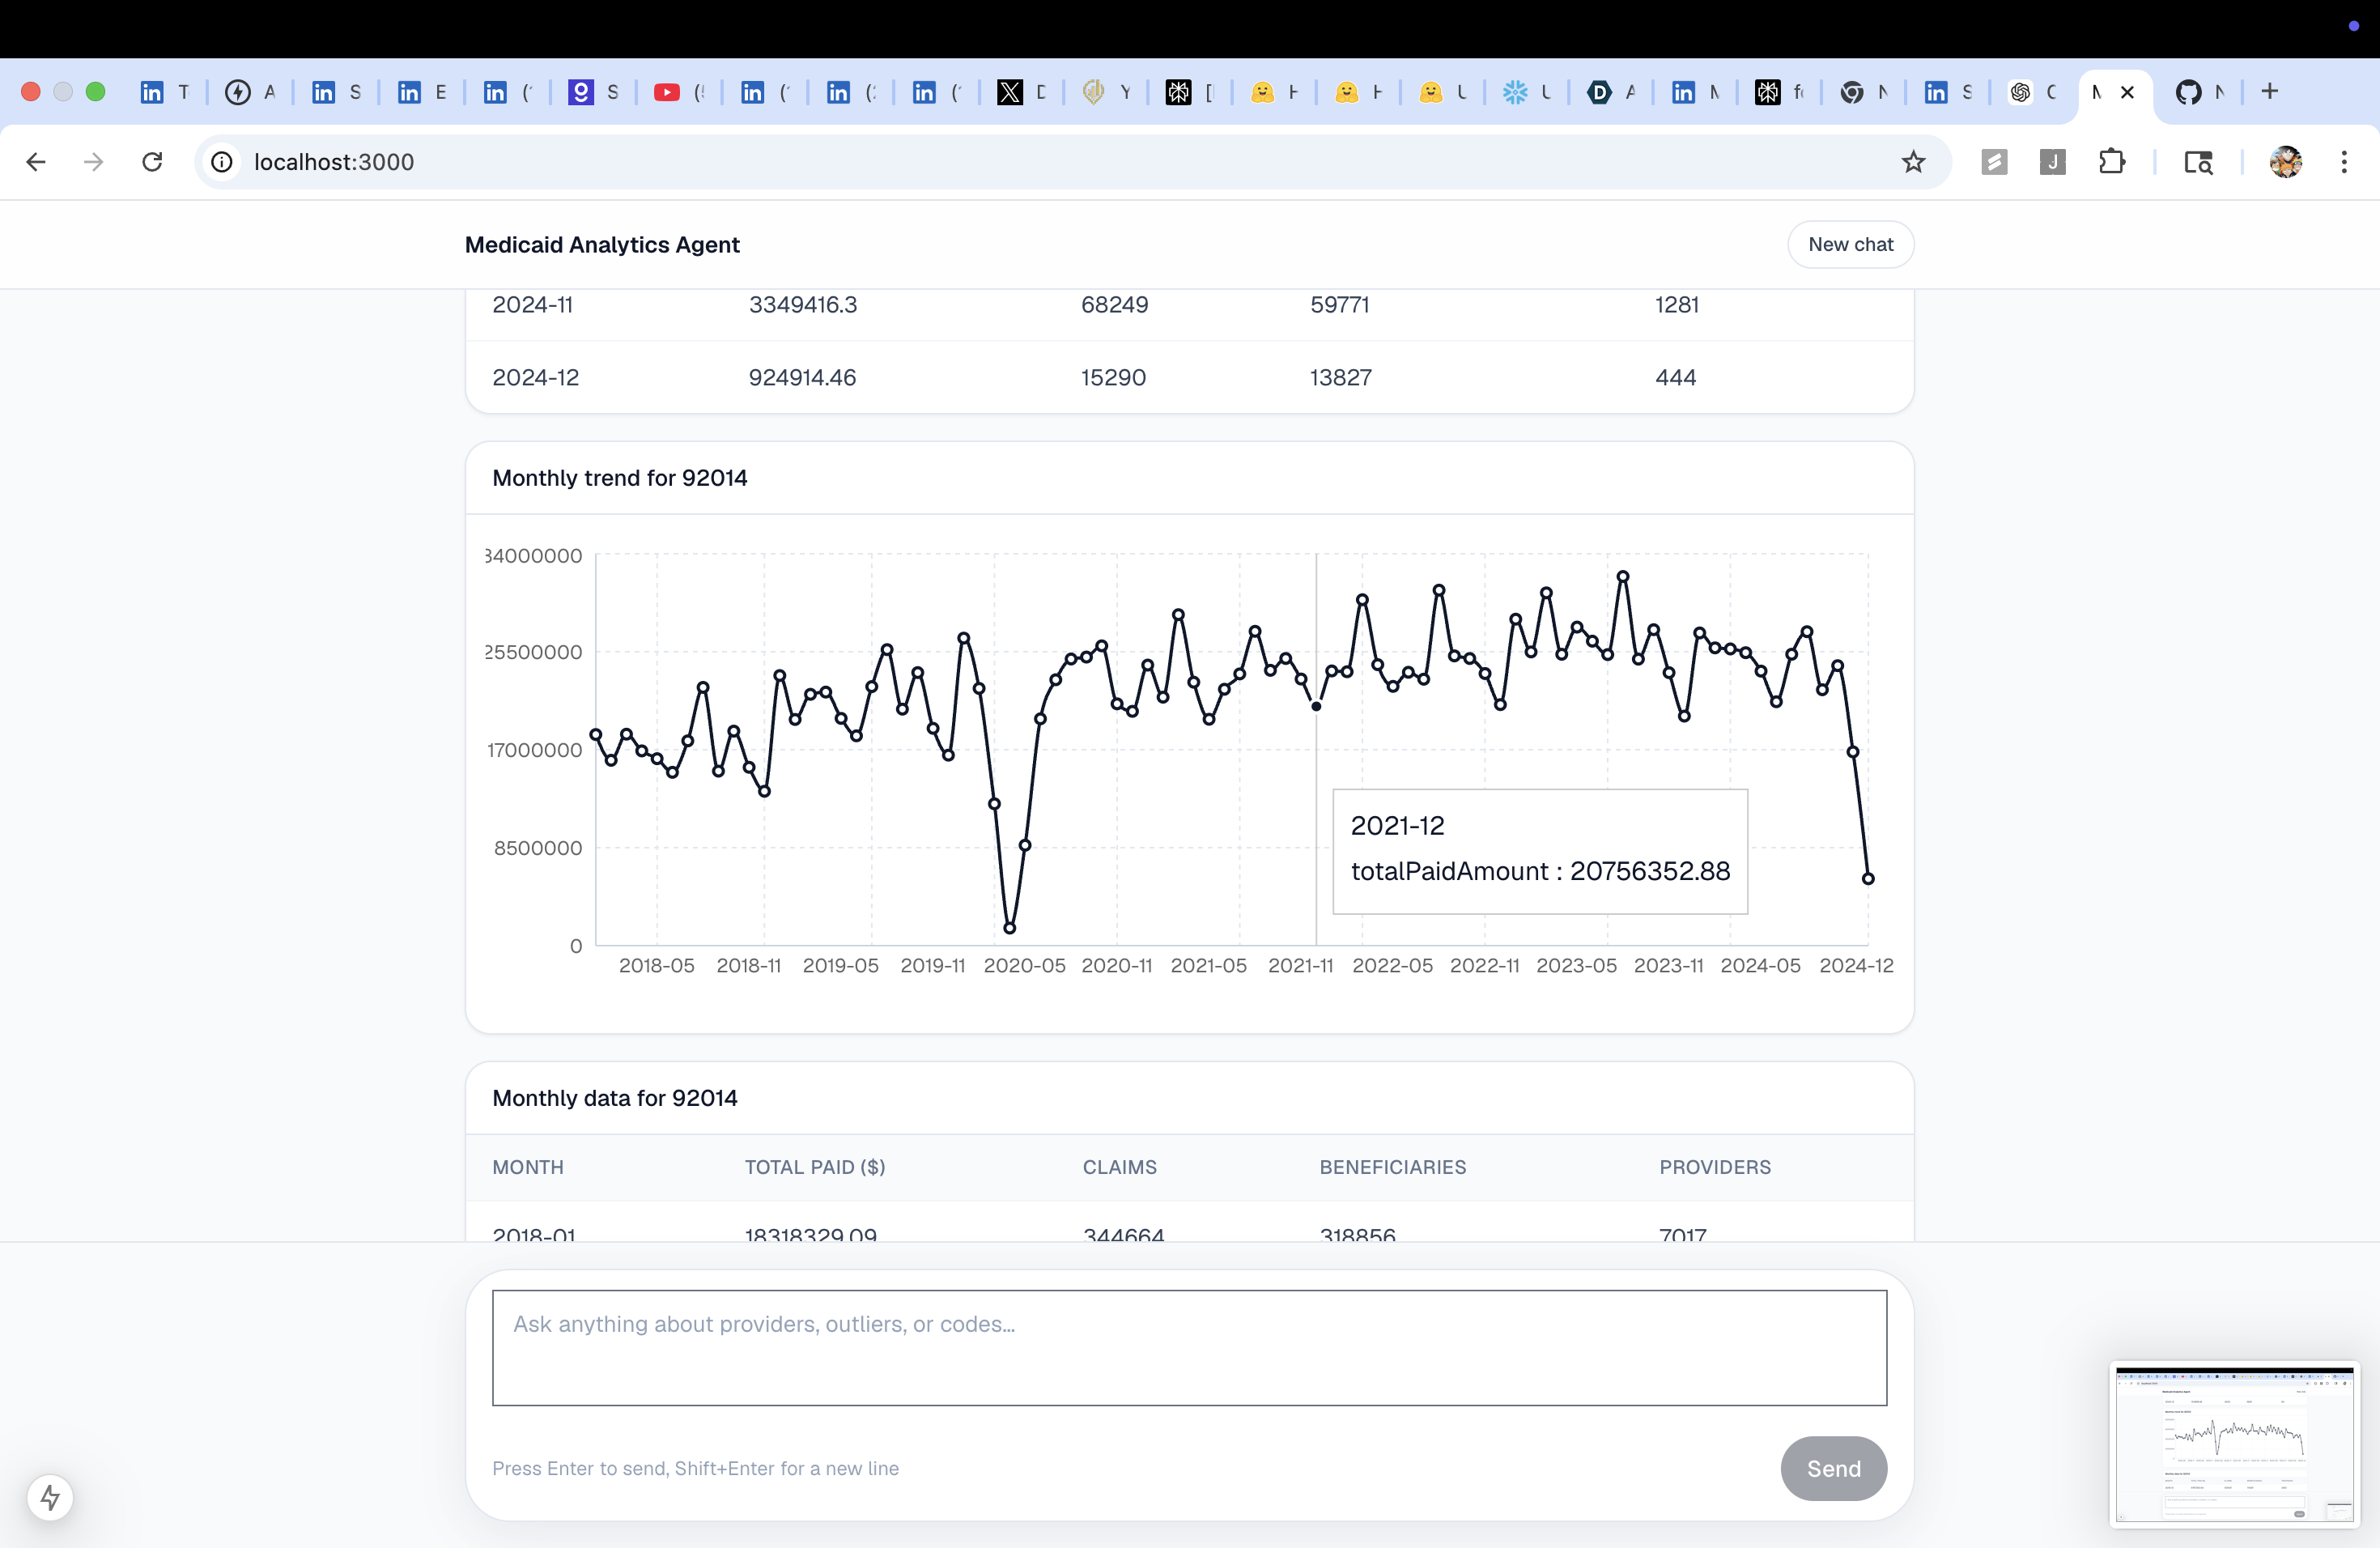
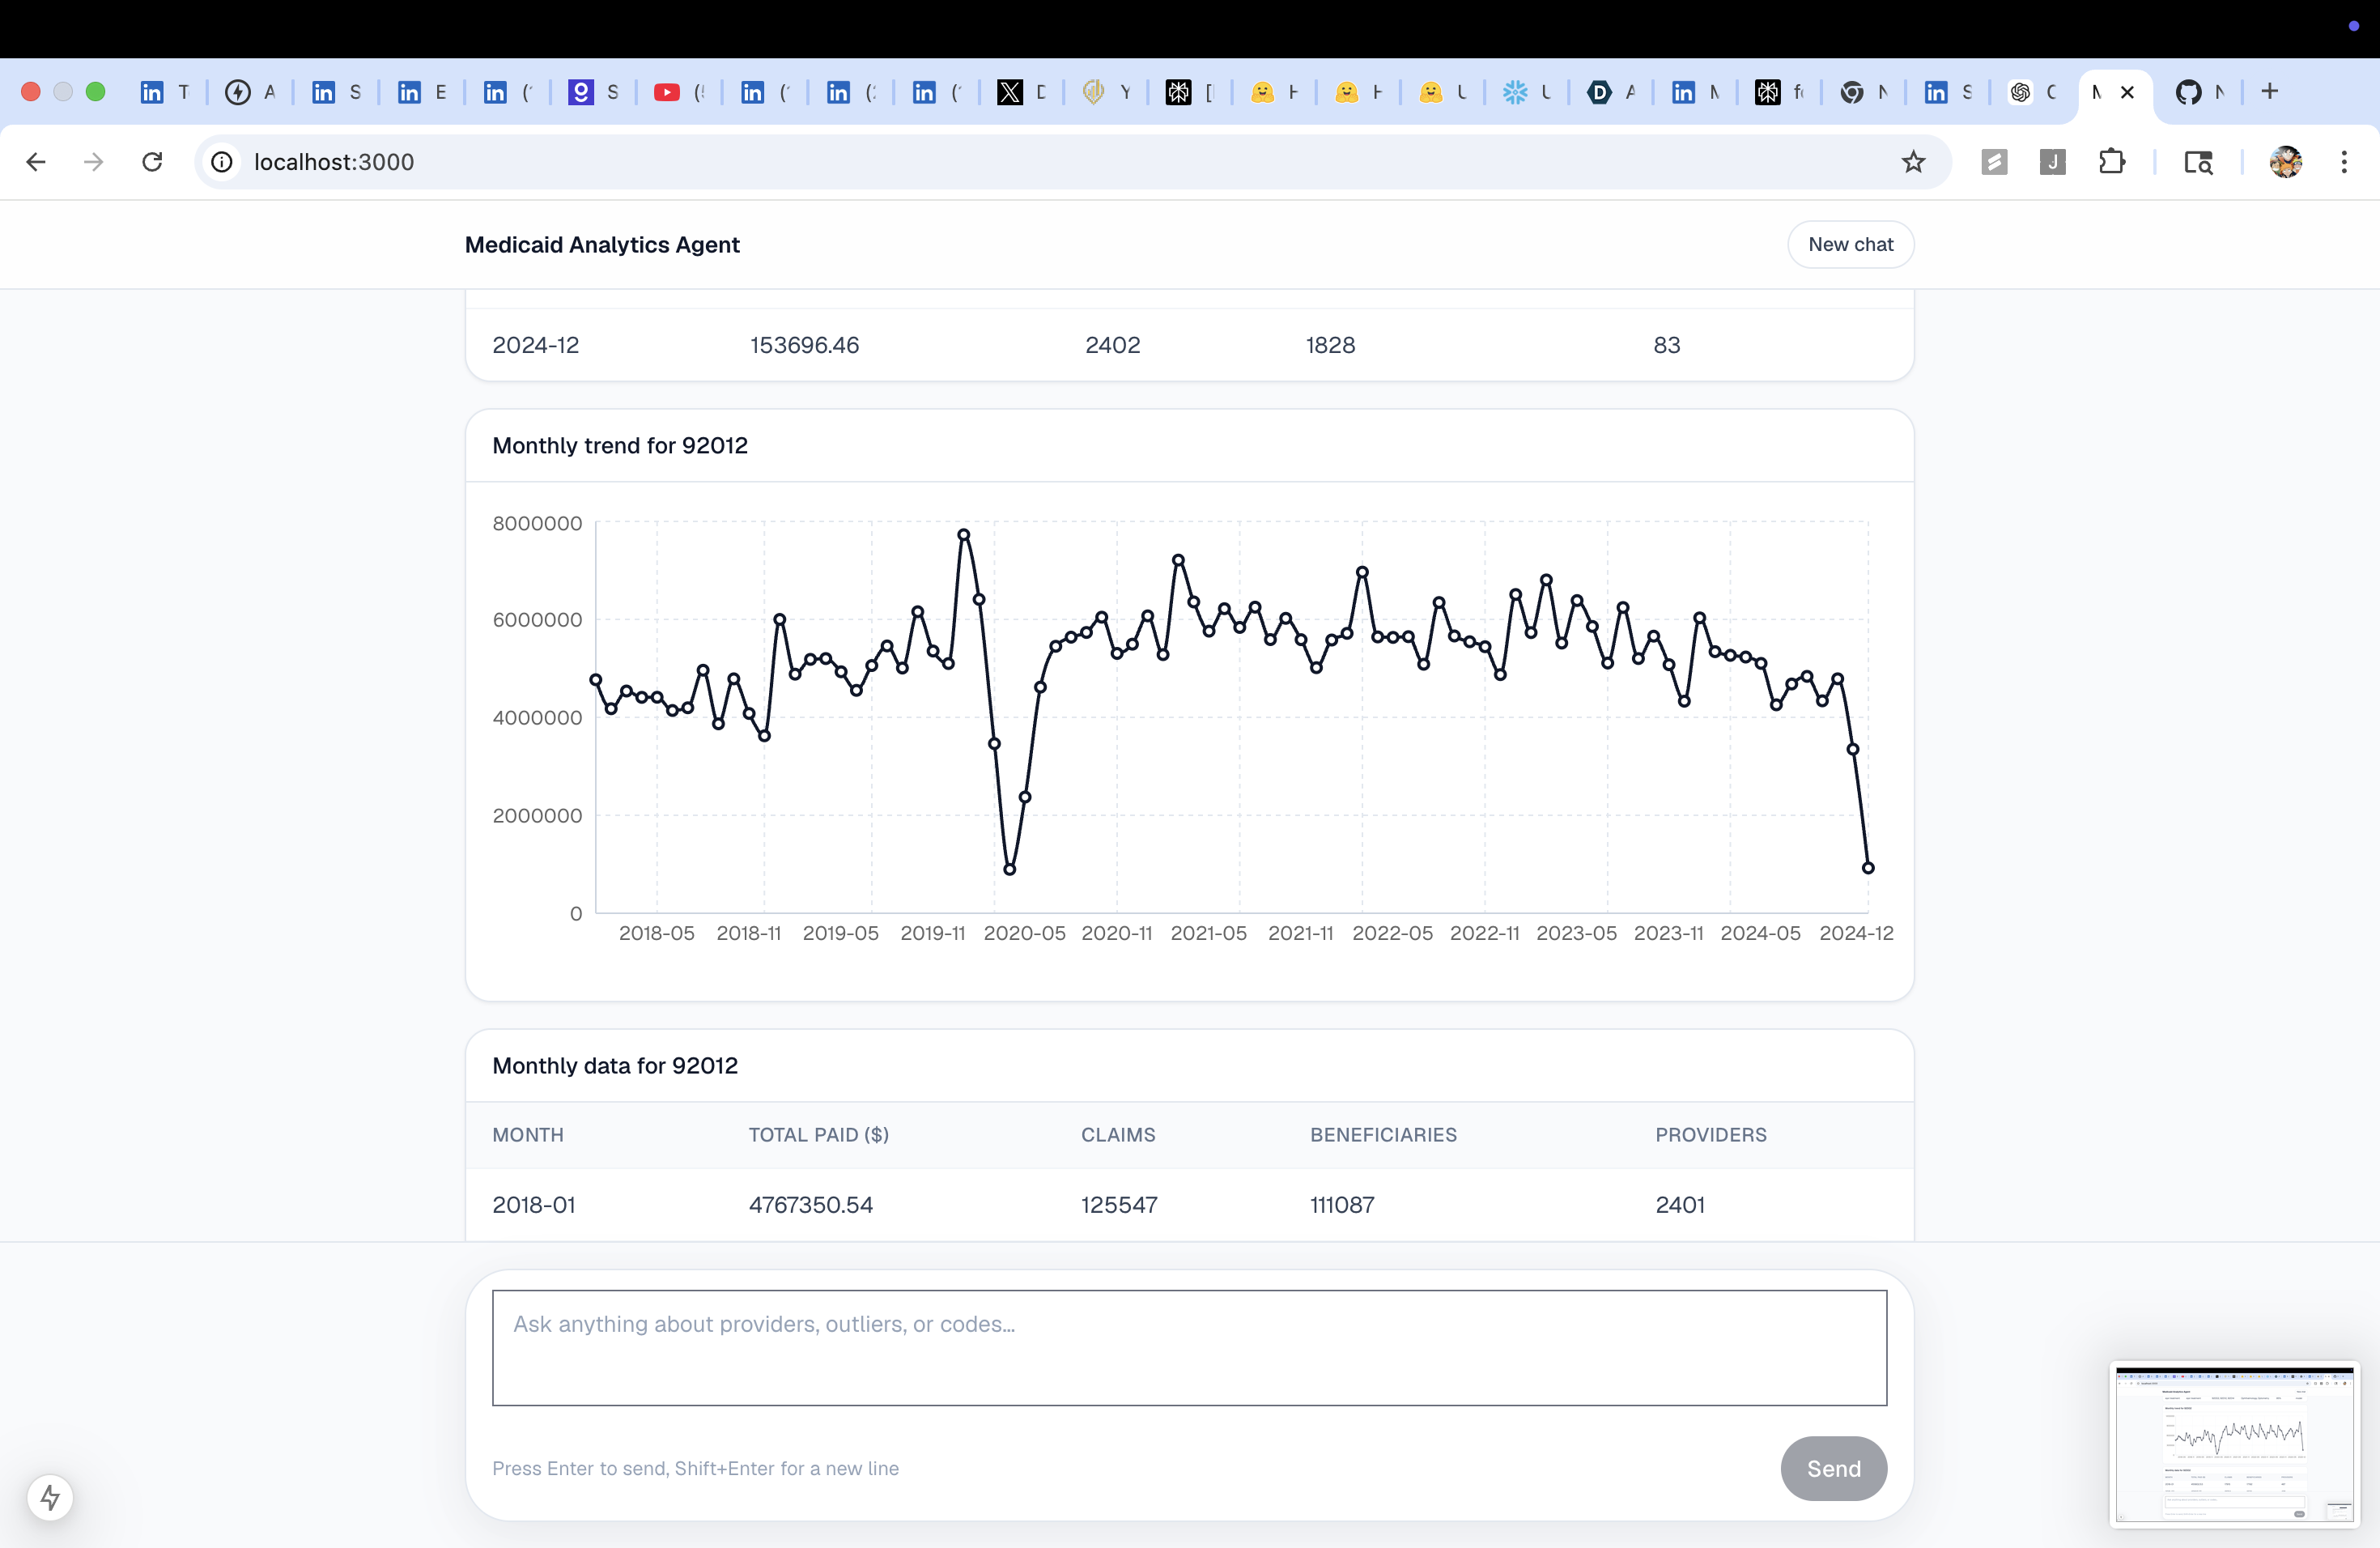
- "Show monthly trend for diabetes supply billing."
- "Compare provider 1073608998 to peers in the same state and taxonomy."
- "Which states have the highest concentration of DME providers?"
- "Which providers had the largest spike in home care billing last year?"
- "Compare therapy billing in Texas vs California."
It covers 8+ healthcare domains: home care, DME, diabetes supplies, ambulance, mental health, hospice, physical therapy, and ABA. Tested across 27 real public-conversation questions — 25 / 27 working.
It never makes legal or fraud claims. It surfaces anomalies and unusual billing patterns and lets the human investigator draw conclusions.
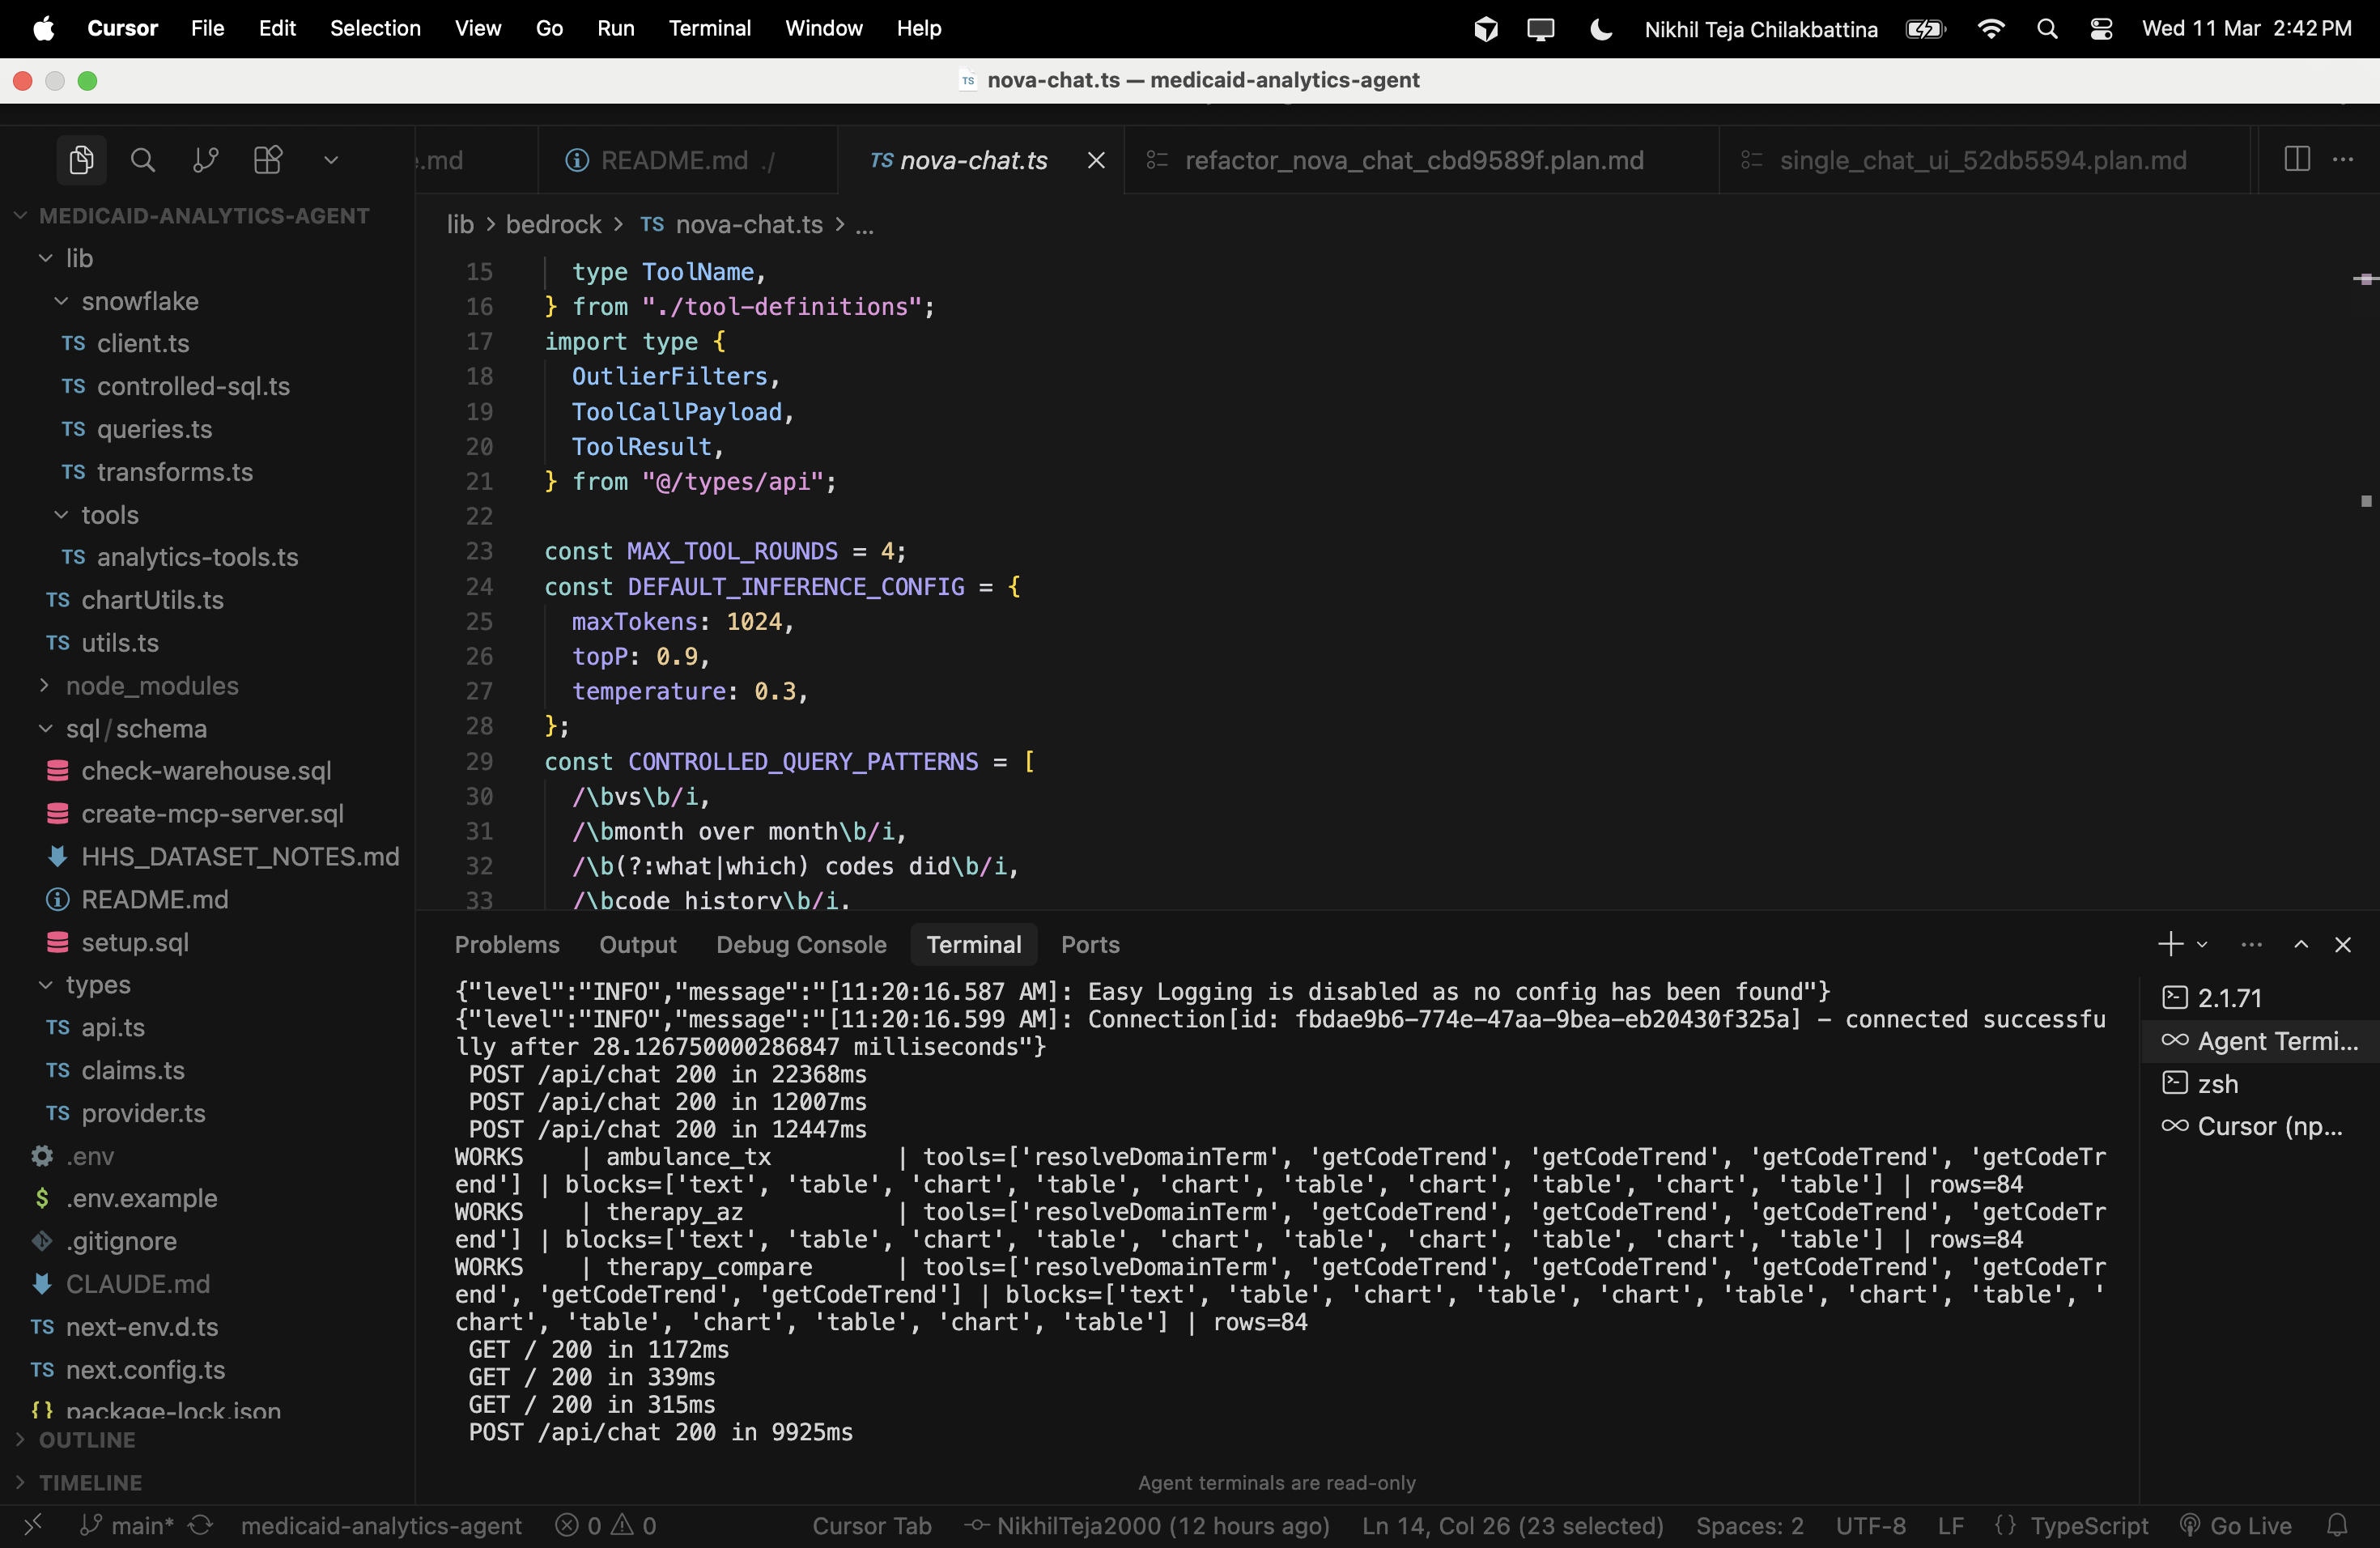
How we built it
Stack: Next.js 15 · React · TypeScript · Tailwind CSS · Snowflake · Amazon Bedrock (Nova 2 Lite)
Architecture — Bedrock-native tool-use loop:
User message
  → /api/chat
  → nova-chat.ts (orchestrator)
  → Bedrock Converse — Nova 2 Lite reads the question,
    picks tools, and plans the data retrieval
  → analytics-tools.ts dispatches the chosen tools
      → 12 curated Snowflake helpers (queries.ts)
      OR validated query plan compiler (controlled-sql.ts)
  → Snowflake returns real rows
  → tool results sent back to Nova
  → Nova writes a plain-English narrative over the data
  → transforms.ts assembles uiBlocks (text + table + chart)
  → Chat UI renders everything inline
Two-tier tool architecture:
12 curated tools — handcrafted, parameterised, schema-safe functions covering the most important analytics patterns: outlier detection, peer comparison, provider trend, aggregate code trend, geography hotspots, beneficiary spike detection, taxonomy breakdown, and domain-term resolution.
Controlled query-plan tool — for broader questions, Nova emits a structured
ControlledQueryPlanJSON (not raw SQL). The backend validates intent, tables, dimensions, and metrics against an allowlist, then compiles it into safe parameterised read-only SQL.
Nova never touches raw SQL. Every query is either pre-written or compiled from a validated plan.
Data:
HHS_MEDICAID_PROVIDER_SPENDING— provider × HCPCS code × claim monthDIM_PROVIDER_NPPES— provider name, taxonomy, entity type, state, city
Anomaly scoring is derived at query time from peer percentile, growth rate, and spend-per-beneficiary. No pre-baked fraud labels.
Tool table — what Nova can call:
| Tool | Purpose | Output |
|---|---|---|
resolveDomainTerm |
Translates plain-English concepts (ABA, hospice, DME…) into HCPCS billing codes | Resolved codes list |
findProvidersByResolvedCodes |
Top providers billing a set of codes, with optional state + date filters | Provider table |
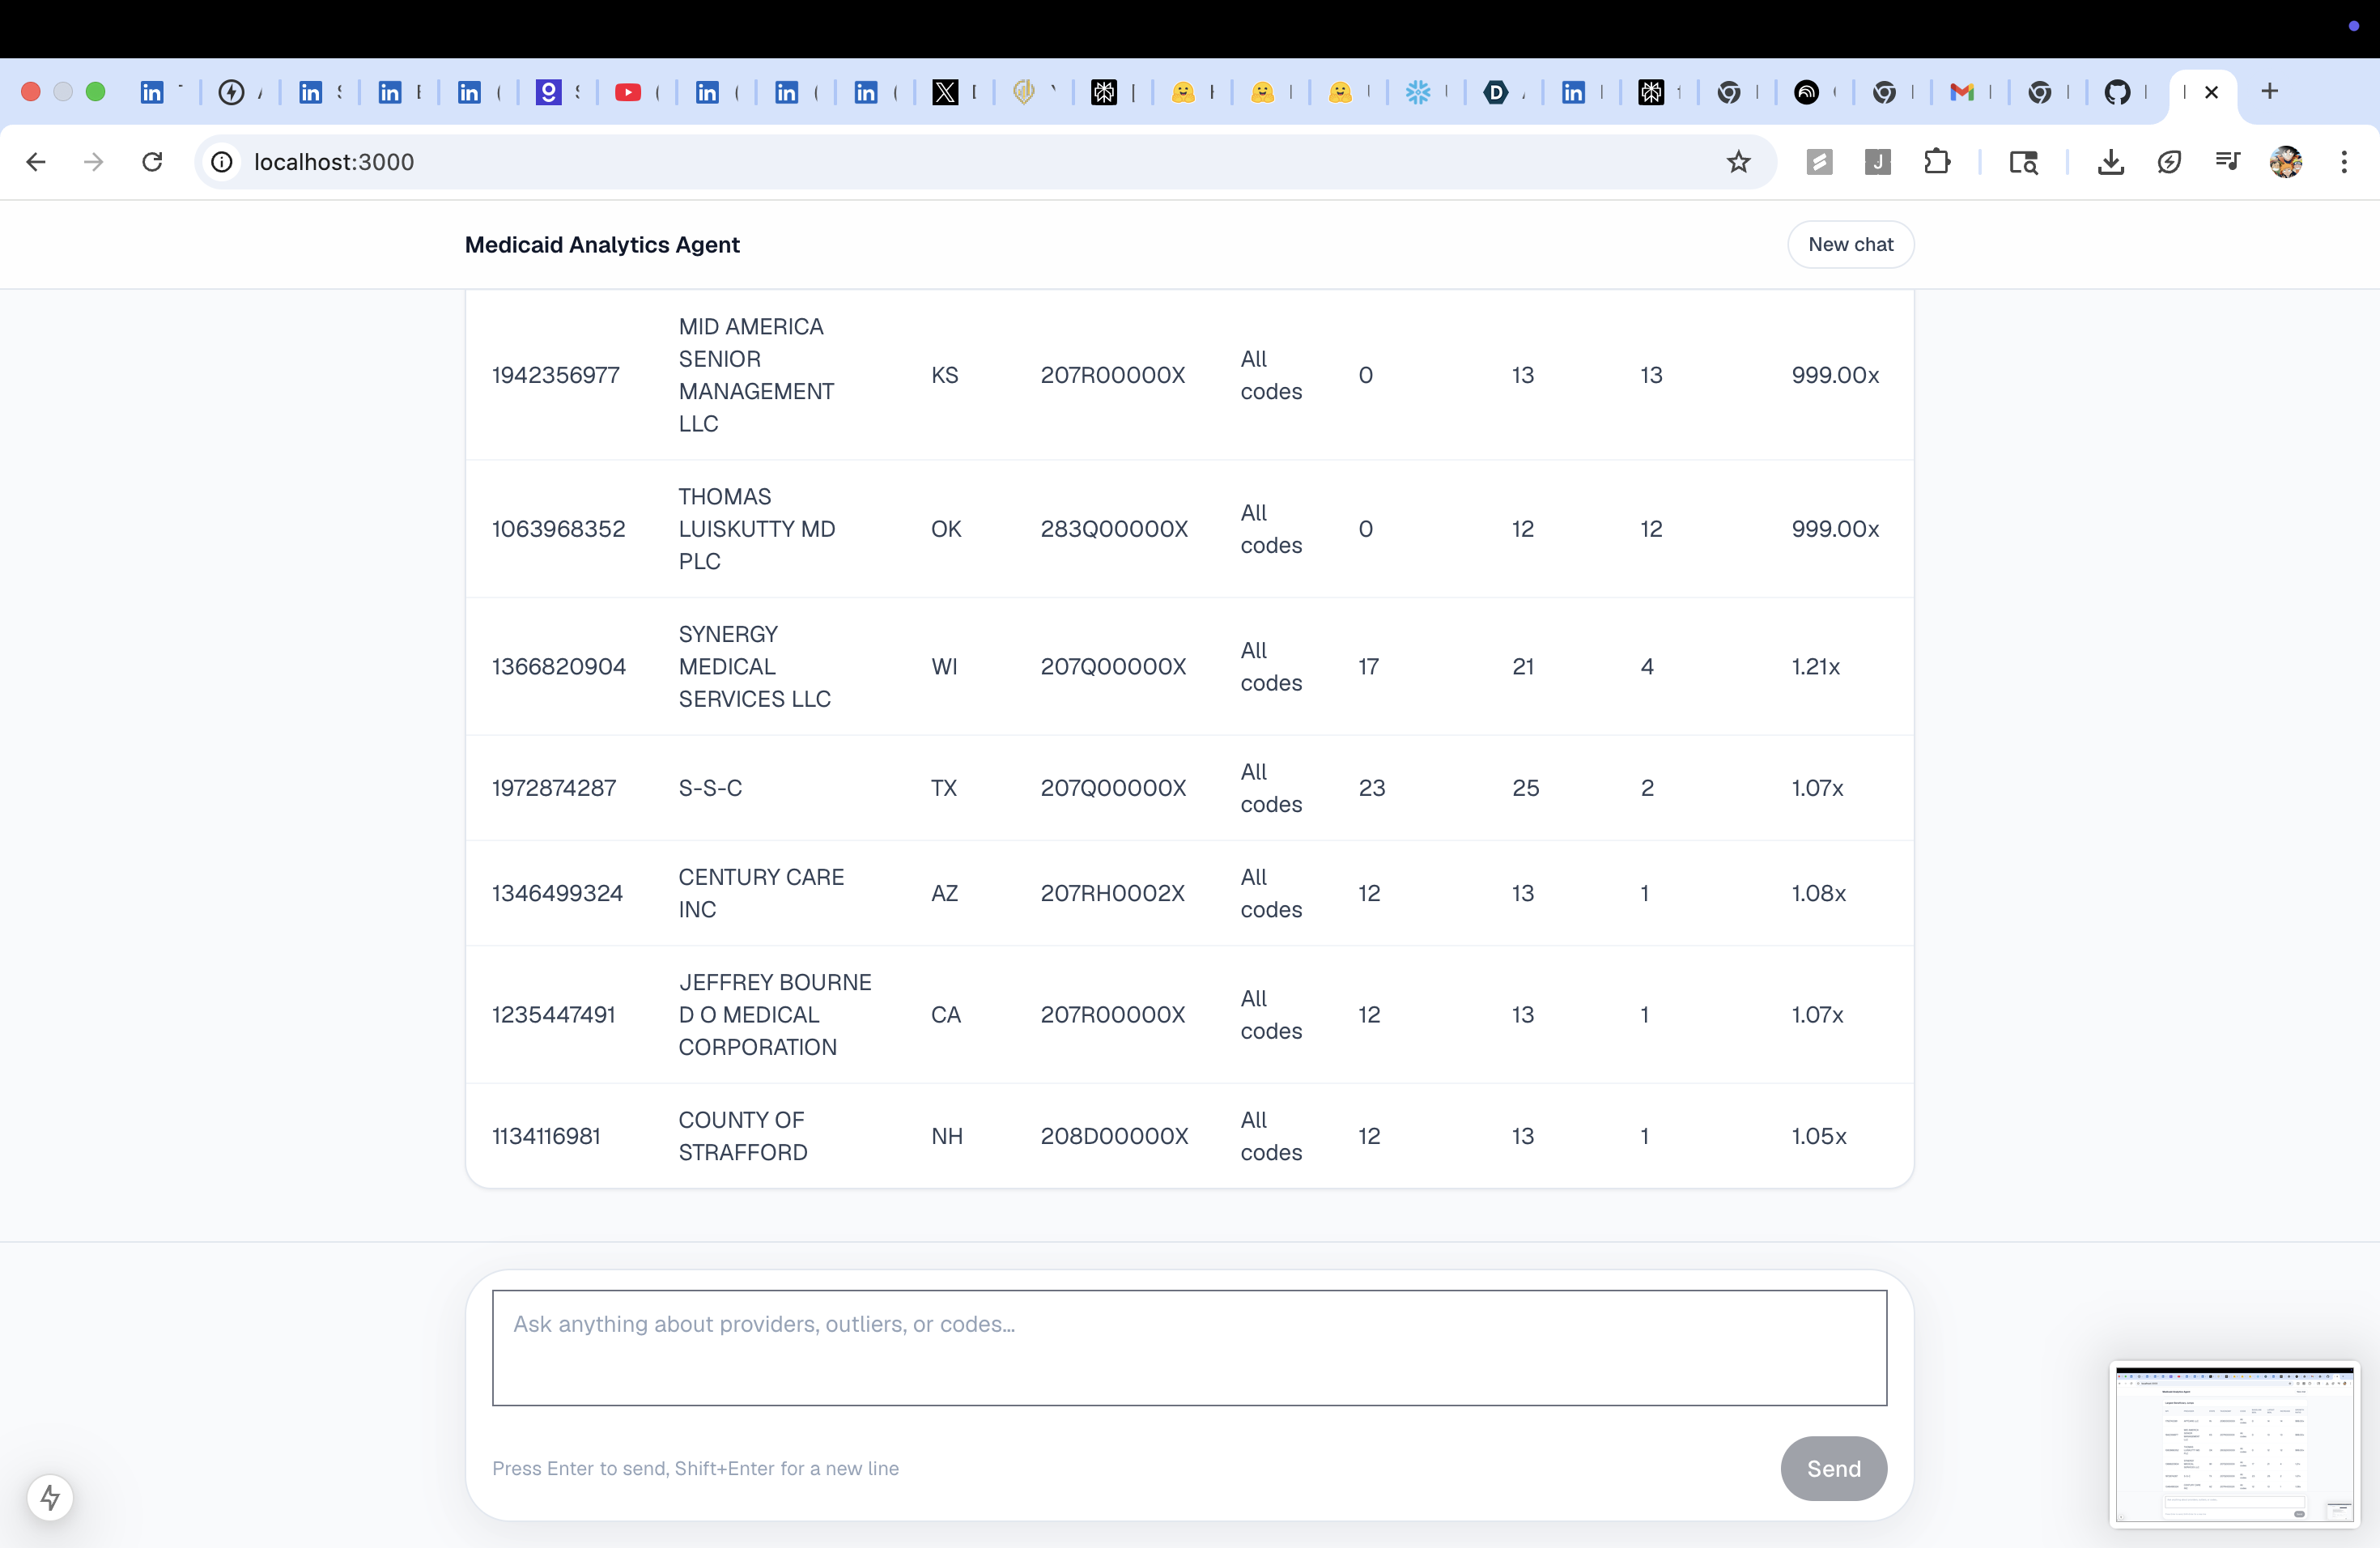
getTopOutliers |
Ranks providers by anomaly score (peer percentile × growth × spend-per-beneficiary) | Outlier table |
getProviderProfile |
Full profile for a single NPI | Provider card |
compareProviderToPeers |
Provider vs same-state, same-taxonomy peers | Percentile table |
getProviderTrend |
Monthly billing trend for a single NPI | Line chart |
getCodeTrend |
Aggregate monthly trend for a HCPCS code across all providers, with optional state filter | Line chart + table |
getTopTaxonomiesByCode |
Which provider types bill a code most heavily | Taxonomy table |
getGeographyHotspots |
States / cities with highest provider concentration or spend | State/city table |
getBeneficiarySpikes |
Providers with the largest sudden jumps in beneficiary counts | Spike table |
searchCodes |
HCPCS code lookup by keyword | Code results |
runGeneratedQuery |
Validates and executes a structured query plan for broader analytics | Table / chart |
Challenges we ran into
Snowflake returns uppercase column names. TypeScript mappings broke silently. Fixed with a
readValue()case-insensitive helper applied across every query function.Connection race conditions. Concurrent API requests each tried to open a new Snowflake connection, leaving stale objects. Fixed with a shared
connectionPromisesingleton in the Snowflake client.Guardrail language. The word "suspicious" in any response triggered Bedrock Guardrails and blocked the narrative text entirely. Fixed by instructing Nova in the system prompt to say "unusual billing patterns" instead — confirmed the guardrail no longer fires.
Nova routing ambiguity. For NPI peer-comparison questions, Nova sometimes routed to
runGeneratedQuerywith unsupported metric names, hitting validation errors and the tool-use limit. Fixed with explicit NPI and peer-comparison regex guards that force those questions onto thecompareProviderToPeerscurated path.Aggregate vs. provider trends.
getProviderTrendrequires an NPI. Questions about how a code trended across all providers had no path. BuiltgetCodeTrend— a new curated tool returning monthly aggregate totals for a code across all providers, no NPI needed.State filtering bug.
getCodeTrendusedBILLING_PROVIDER_STATE_CD, which doesn't exist in the claims table. State filtering must go through a JOIN toDIM_PROVIDER_NPPES. Fixed the JOIN — unblocked all state-scoped trend questions.Term resolution gaps. "ABA" resolves correctly to 97151–97158. "Autism-related billing" returns ICD-10 diagnostic codes instead of HCPCS billing codes — different framing, different model behaviour. An alias map in the resolver would close this fully.
Accomplishments that we're proud of
25 of 27 public-conversation test questions answered correctly, across 8 healthcare domains — outliers, trends, geography, peer comparison, spike detection, domain lookup, and cross-state comparison.
Nova never writes raw SQL. Every data access is either a pre-written parameterised query or a validated, compiled query plan. The controlled SQL layer enforces an allowlist of tables, joins, dimensions, and metrics before any query reaches Snowflake.
The whole UX is one chat window. No dashboards to navigate. The agent decides what to visualise, builds the blocks, and renders text, tables, and charts inline in the same message — the way a skilled analyst would explain findings.
Real data, real findings. The agent surfaces providers like Mr X with a 395× beneficiary growth ratio. These are findings from the live HHS dataset, not mock data.
Built and iterated entirely within a hackathon sprint — schema design, AI orchestration, SQL compilation, UI rendering, live verification, and three rounds of bug fixes driven by real questions from public conversation about the dataset.
What we learned
Bedrock Converse tool-use is powerful but prompt-sensitive. Small wording changes — "unusual patterns" vs "suspicious", "use one call with a codes list" vs leaving it implicit — have large effects on which tools Nova picks and how many rounds it takes.
Curated tools beat generated SQL for reliability. Every time we added a well-scoped curated tool (like
getCodeTrend), routing became cleaner and fewer rounds were needed. Generated query plans are valuable for the long tail, but curated tools are more predictable for common cases.Domain knowledge has to live in the prompt. The model doesn't know that ABA therapy maps to 97151–97158 in HCPCS unless you tell it. Grounding the system prompt with business rules and code mappings is as important as the data itself.
Anomaly detection without fraud claims is a UX challenge. Framing findings as "unusual billing patterns" rather than "suspicious activity" is both legally safer and, after working through the guardrail issue, factually more honest — the data shows outliers, not proof.
What's next for Medicaid Analytics Agent
Saved investigations — let users bookmark a finding, annotate it, and export it as a PDF or shareable link for handoff to journalists or oversight bodies.
Richer anomaly signals — upcoding detection (billing higher codes when peers bill lower), unbundling flags, and time-of-day/day-of-week outliers when more granular data is available.
Conversational memory — maintain context across turns so users can drill down ("Now filter that to California only") without re-stating the full question.
Expanded datasets — Medicare Part B, Part D, and state-level Medicaid supplemental data to enable cross-program comparison for the same provider.
Open the agent to oversight bodies — package it as a read-only web app that state Medicaid program integrity teams can use without any SQL or data engineering skills required.
Built With
- amazonbedrockconverseapi
- amazonbedrockguardrails
- amazonnova2lite
- eslint
- next.js
- react
- snowflake
- sql
- tailwindcss
- typescript

Log in or sign up for Devpost to join the conversation.