Inspiration
One day, while my wife and I were watching a video from USAFacts, she wondered aloud how the animated data visualizations in the video were created. I started explaining the usual process—acquiring and cleaning the data, processing it, and then building dashboards with the right dimensions, filters, and pivots. Halfway through the explanation, I realized it might be easier to just build an example application that shows her how they work.
That became Median Viz. I started with a few animated Plotly visualizations—a pie chart, a bar race, and a U.S. map—then turned them into a small web application, open-sourced it on GitHub, and deployed it on Vercel.
When the WebMCP Challenge was announced, my cofounder and I were also exploring how to analyze LinkedIn Ad Set demographics for client campaigns. The two ideas suddenly connected. Instead of asking an AI agent to infer what a visualization means from the page alone, what if the application could tell the agent exactly what data, analytical capabilities, constraints, and current state were available? That became the /studio experience in Median Viz: a workspace designed so that humans and agents can understand and work on the same analysis through WebMCP.
What it does
Data visualization tools are usually built as human-operated dashboards for exploring complex data across different dimensions. They can be powerful, but they are also difficult for AI agents to understand because the agent has to infer which filters, dimensions, metrics, and actions the application actually supports.
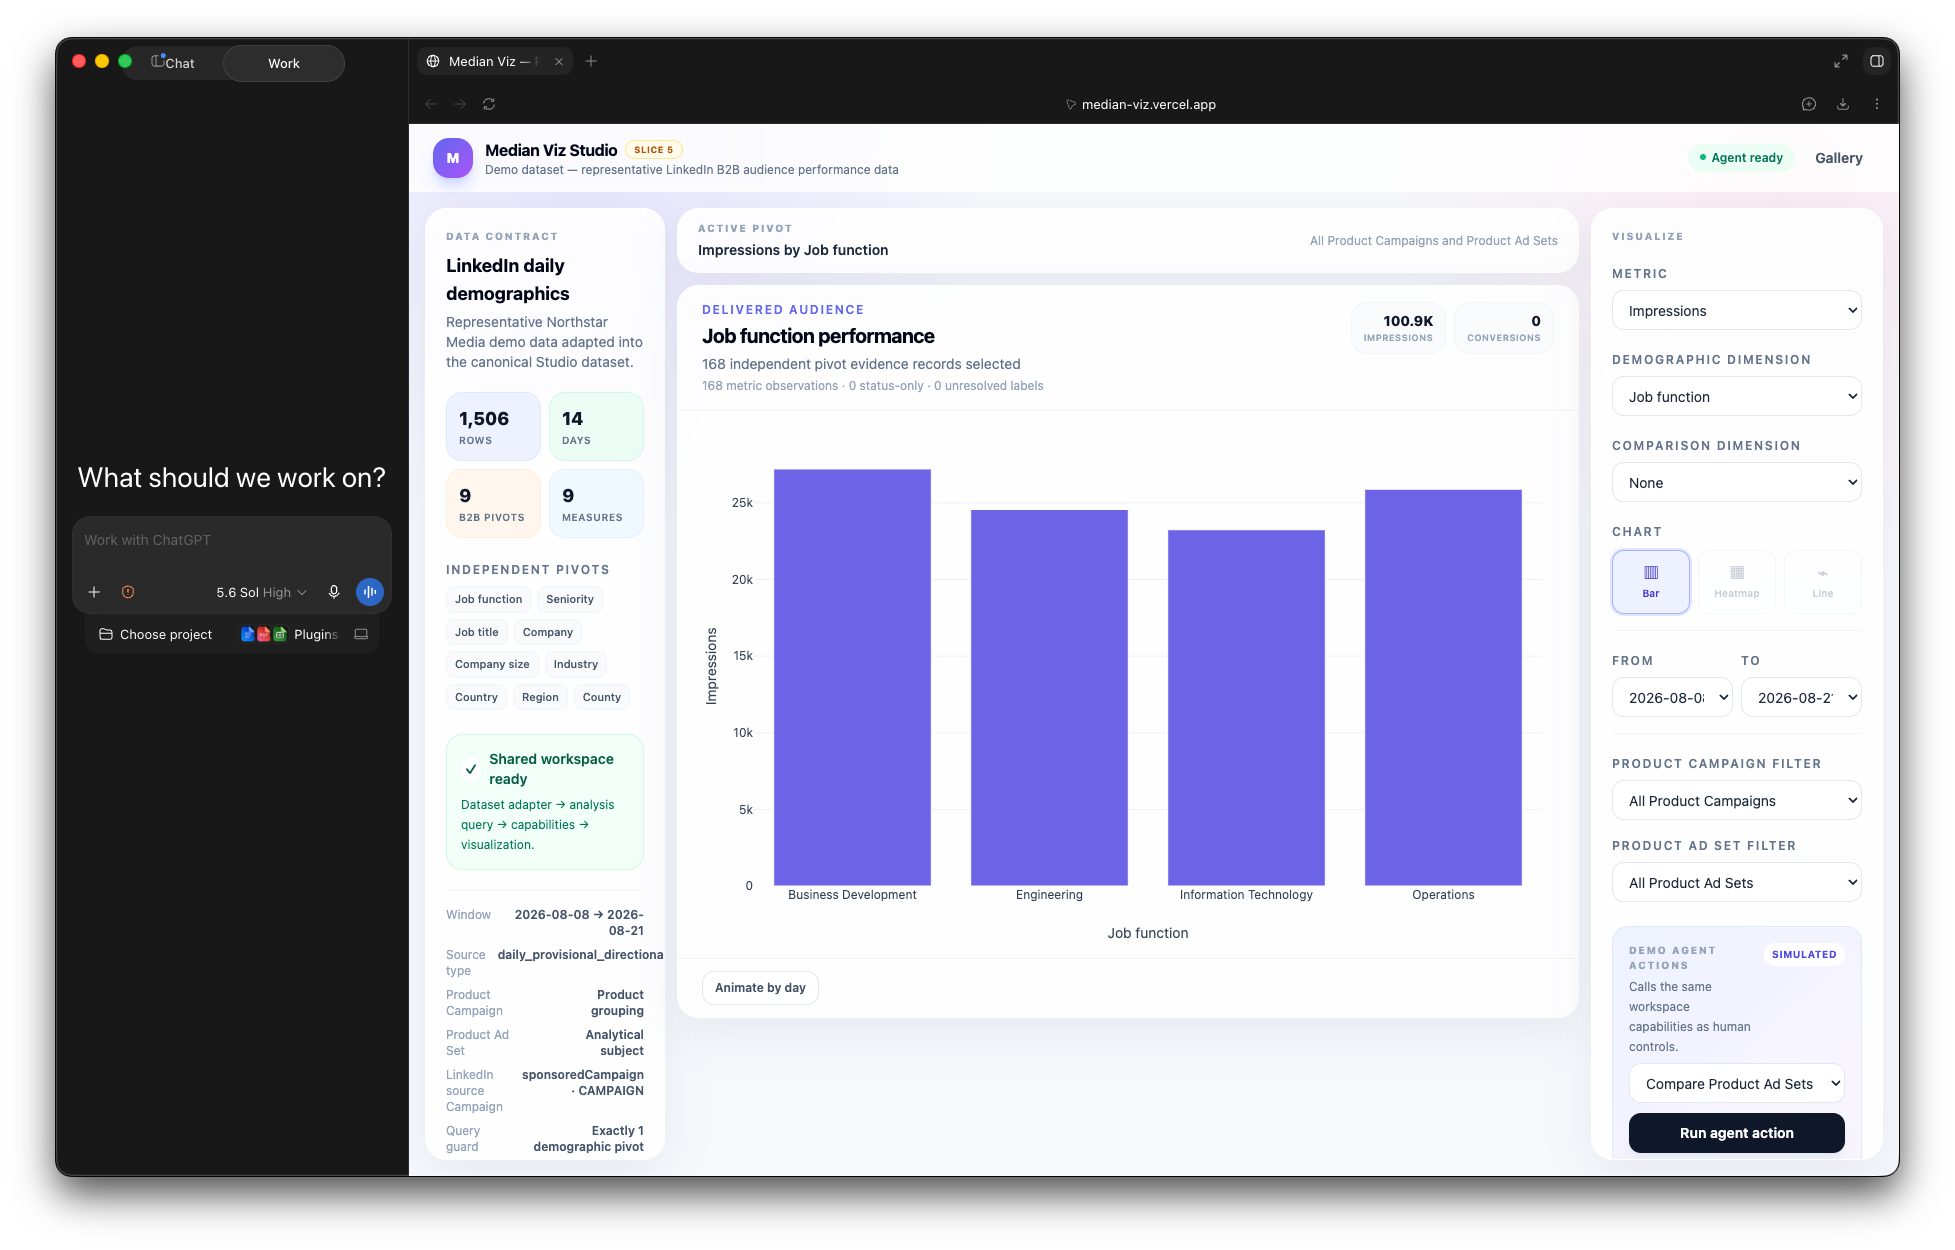
I built Median Viz Studio using LinkedIn Ad Set demographics as the example domain. Through WebMCP, the application exposes its analytical capabilities directly to ChatGPT. The agent can discover what dimensions are available, understand the current workspace, configure an analysis, apply filters, animate changes over time, and explain the results in plain language.
The key idea is that the human and the agent are not working in separate experiences. They operate on the same live workspace. A filter selected by the human immediately becomes context for the agent, while a WebMCP action taken by the agent is reflected in the same controls and visualization the human sees.
How we built it
Median Viz is a Next.js/React application using Plotly for interactive and animated visualizations. The /studio route models a LinkedIn-style B2B audience analysis workflow using the supported demographic dimensions, including Job Function, Seniority, Industry, Company, Company Size, Region, and others. For the public demo, I use representative LinkedIn B2B audience-performance data for a fictional company, Northstar Media, with metrics such as CPC, CTR, impressions, spend, and conversions.
The Studio exposes seven semantic tools through WebMCP: three read-only tools that let the agent inspect the dataset, workspace, and current result, and four guarded mutation tools that let it configure an analysis, apply filters, control animation, or reset the view. These tools operate on the same underlying workspace capabilities used by the human interface rather than manipulating Plotly or DOM elements directly.
The application also preserves domain rules. For example, LinkedIn demographic dimensions are reported independently, so the system will reject an invalid request such as comparing Job Function directly with Seniority rather than inventing an unsupported intersection. Time-series animation is represented as shared workspace state, and the Agent Activity panel makes WebMCP-driven changes visible to the user.
Challenges we ran into
One of the main challenges came directly from a problem we were already thinking about in our startup: how do you keep human and agent actions in sync when both can change the same workspace? I wanted a filter or view selected by the user to immediately become context for the agent, while also making sure an agent action did not overwrite a newer human change.
There were also important domain constraints to preserve. LinkedIn demographic dimensions are reported independently, so an analysis such as Job Function × Seniority is not valid. I wanted Median Viz to reject requests the underlying data cannot support rather than letting the agent invent an answer. Similarly, derived metrics such as CPC and CTR need to be calculated from aggregated values rather than by averaging row-level ratios.
Finally, because this is a public demo based on a problem we encounter with real customer campaigns, privacy was a hard requirement. The public Studio uses representative demo data and fictional identities, so no real customer information is exposed.
Accomplishments that we're proud of
The accomplishment I’m most proud of is getting to a working experience where a human and an agent can genuinely collaborate in the same analytical workspace. A user can change a filter manually, ChatGPT can immediately understand that new state, and an agent action is reflected back in the same visualization and controls.
This also gave my cofounder and me a concrete model for how we could use WebMCP in our own analytics products: expose the capabilities and constraints of the application directly to agents instead of asking them to infer everything from the interface.
I was also happy with the way animation evolved. The human gets a visual, time-based experience, while the agent gets structured state it can reason over. Taking the project from an experiment, through WebMCP integration, to a deployed application and a working public demo was especially rewarding.
What we learned
- Start with the problem, not the protocol. WebMCP became useful once I focused on the human-agent collaboration problem rather than trying to find places to add tools.
- Designing good WebMCP tools feels more like designing a product capability API than exposing UI controls.
- An agent works better with structured state and evidence than when it has to infer meaning from a screenshot or DOM.
- Domain constraints are a feature. Giving an agent explicit boundaries can make it both safer and more useful.
- Shared state matters more than tool count. The most interesting interactions happened when a human action became immediate context for the agent, and vice versa.
What's next for Median Viz
- Explore additional multidimensional datasets beyond advertising, with examples from domains such as travel, retail, and other areas where interactive visual exploration is useful.
- Add richer annotations and storytelling, especially around animated and filtered views, so the application can help explain why a change matters rather than only showing that it happened.
- Explore better ways to analyze and compare independently reported demographic dimensions without violating the underlying data semantics—for example through side-by-side views, sequential filtering, or coordinated comparisons rather than unsupported intersections.
- Extend the human-agent collaboration model beyond the demo, including longer analytical workflows where humans and agents progressively refine the same workspace.

Log in or sign up for Devpost to join the conversation.