-
Otly Mediadata Visualizer
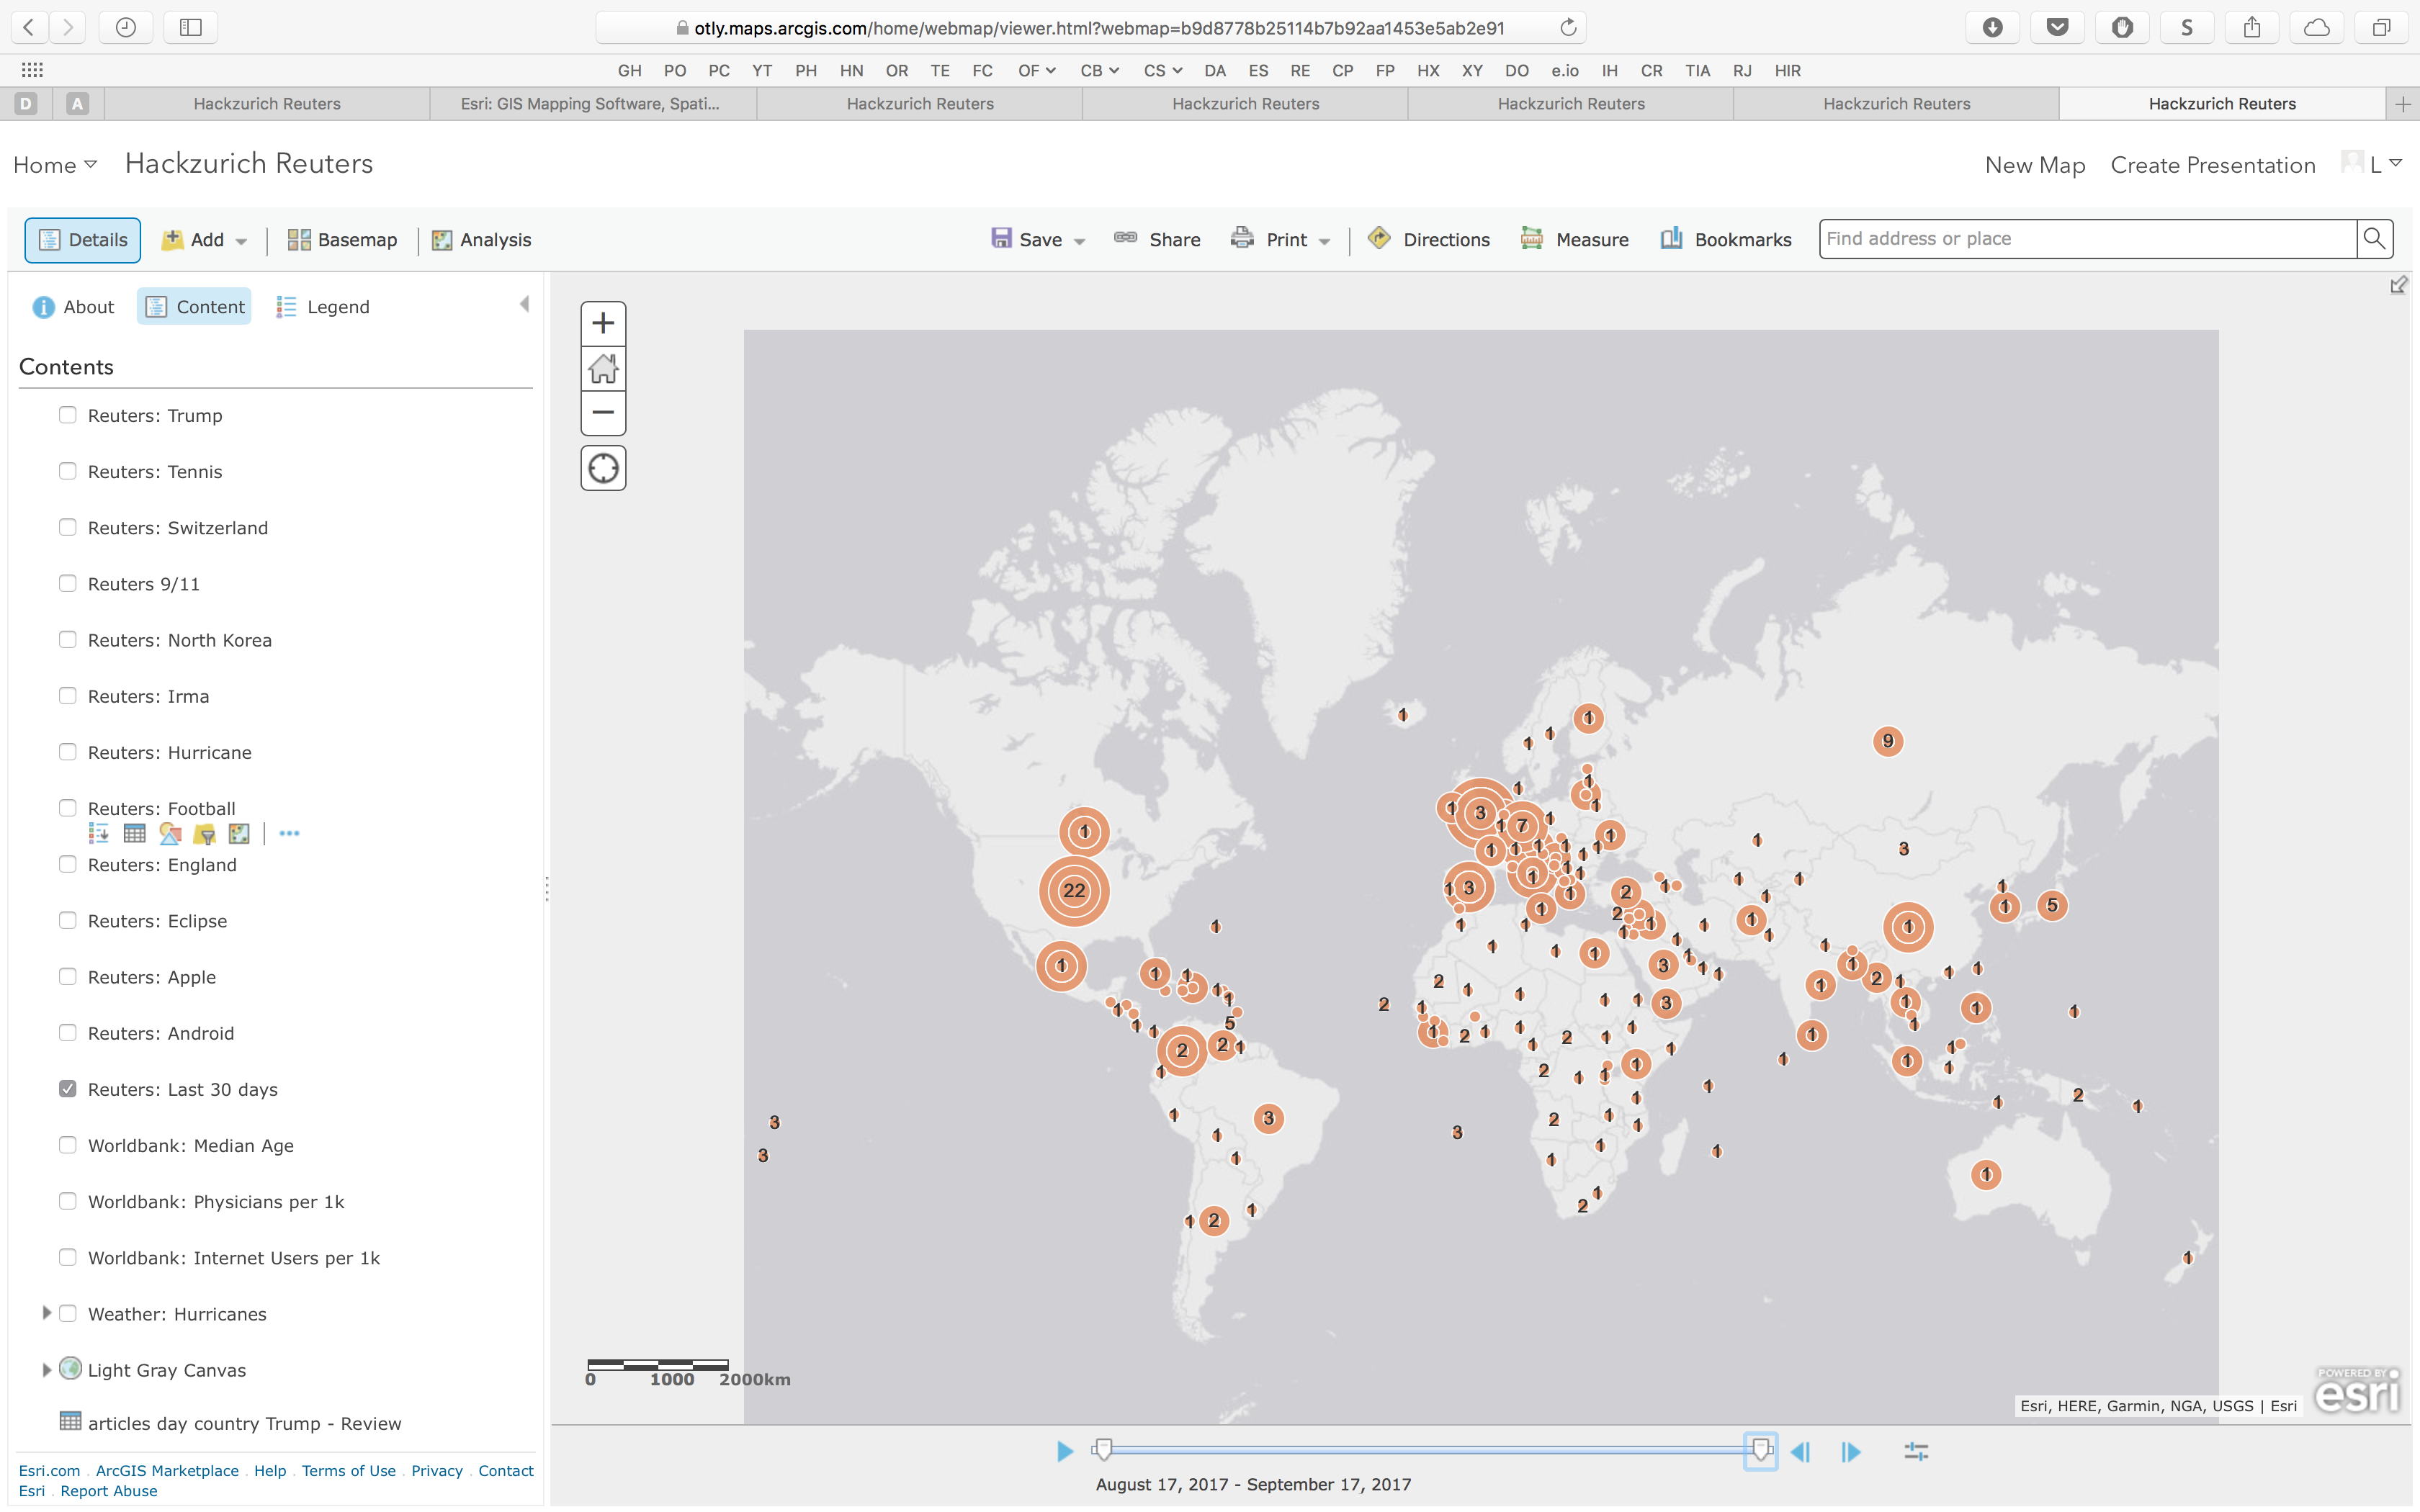
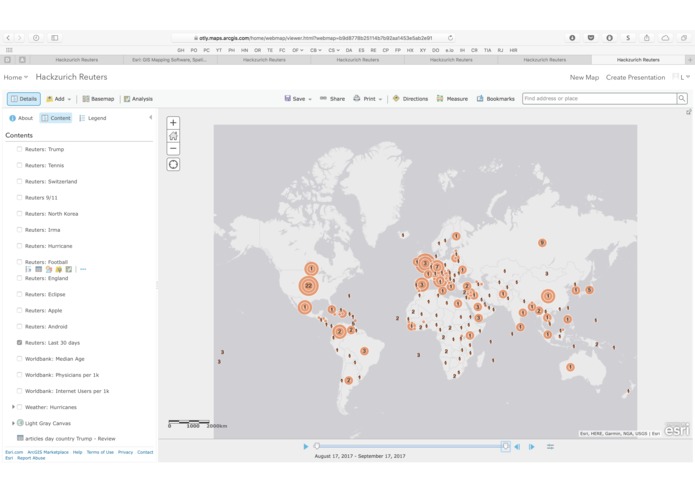
Since Reuters handles a vast feed of news from all around the world, we asked ourselves how international this information really is. Starting from this observation, we had the idea to present this comprehensive stream of information in an intuitive and visual way for the news consumer. Here is born the OTLY Mediadata Visualizer.
Based on the Reuters data resources, the OTLY displays on the world map the international news coverage and gives insights into the latest news trends per country and per day. Different layers allow the user to filter several topics of interest covered by news articles and intuitively compare them with other sources of information (eg. GDP, ...).
The first challenging part consisted of understanding the different resources and selecting the most appropriate ones for our purpose. We could then split our efforts according to our strengths and focus on the data analytics and visualization. We are particularly proud of our collaboration in order to build a working prototype within such a limited time frame.
OTLY Mediadata Visualizer is looking forward to getting access to more news data and to learning by himself the future trends in the world of news!


Log in or sign up for Devpost to join the conversation.