-
MecSimCalc Math Plotter
Inspiration
In math 31, having the ability to graph a function, its derivative and integral was always useful. I have always wanted to plot all of the simultaneously but never found an app to do some that was easy to access.
What it does
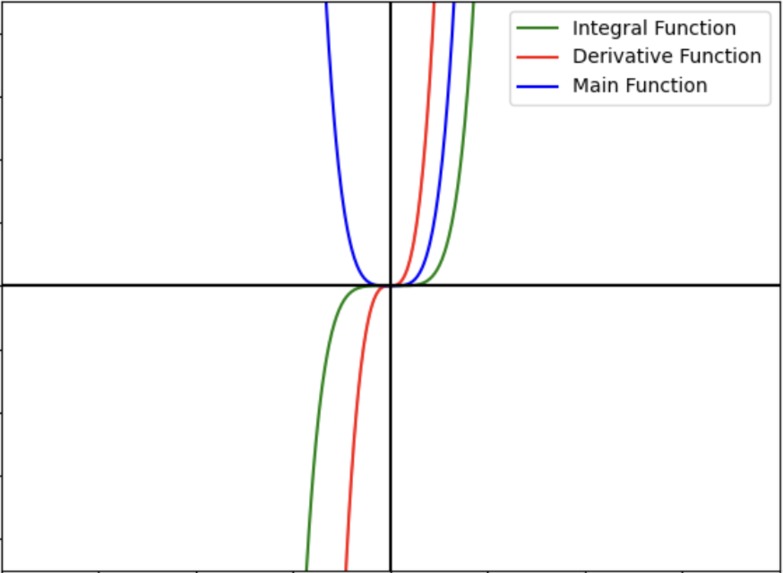
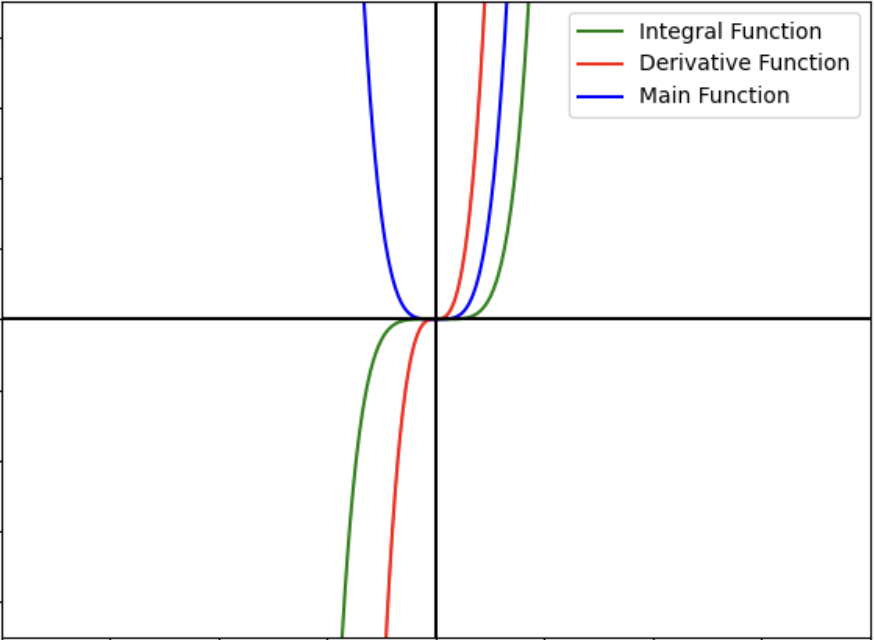
Our math plotter can plot the original function, its derivative and integral all at once. It can even plot using given domain and range inputs.
How we built it
We built it using python and the matplotlib, sympy, numpy, mecsimcalc libraries.
Challenges we ran into
Our main challenges arrived from using MecSimCalc as it was our first time using this app to create an app/python program, once we got the hang of it, which took only about an hour, we were able to finish both our sudoku solver and the math plotter.
Accomplishments that we're proud of
We are happy that we were able to complete these projects within the deadline because as stated above, just learned mecsimcalc ate up some of our time since it was our first times.
SIDE NOTE:
Please read the side notes in the apps documentation.
What we learned
We learned how to use MecSimCalc and certain error debugging strategies.
What's next for MecSimCalc math plotter.
In the future, adding an (INTENDED) 3d plot would be nice. Visually seeing the area under the original curve as the integral as an other option would also be nice. Some bugs and input validations still may need fixing but in general it works fine. We may also need to include optimization as the site can run slow at time, so any optimizing would make a better app.

Log in or sign up for Devpost to join the conversation.