-
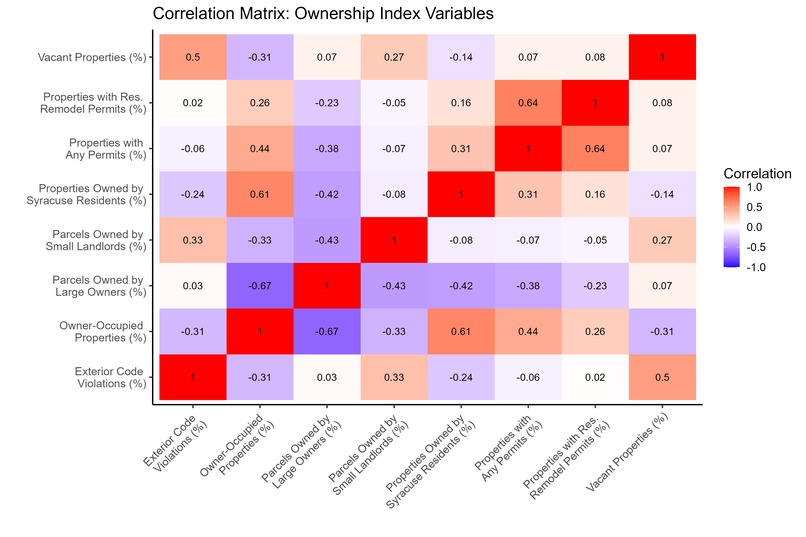
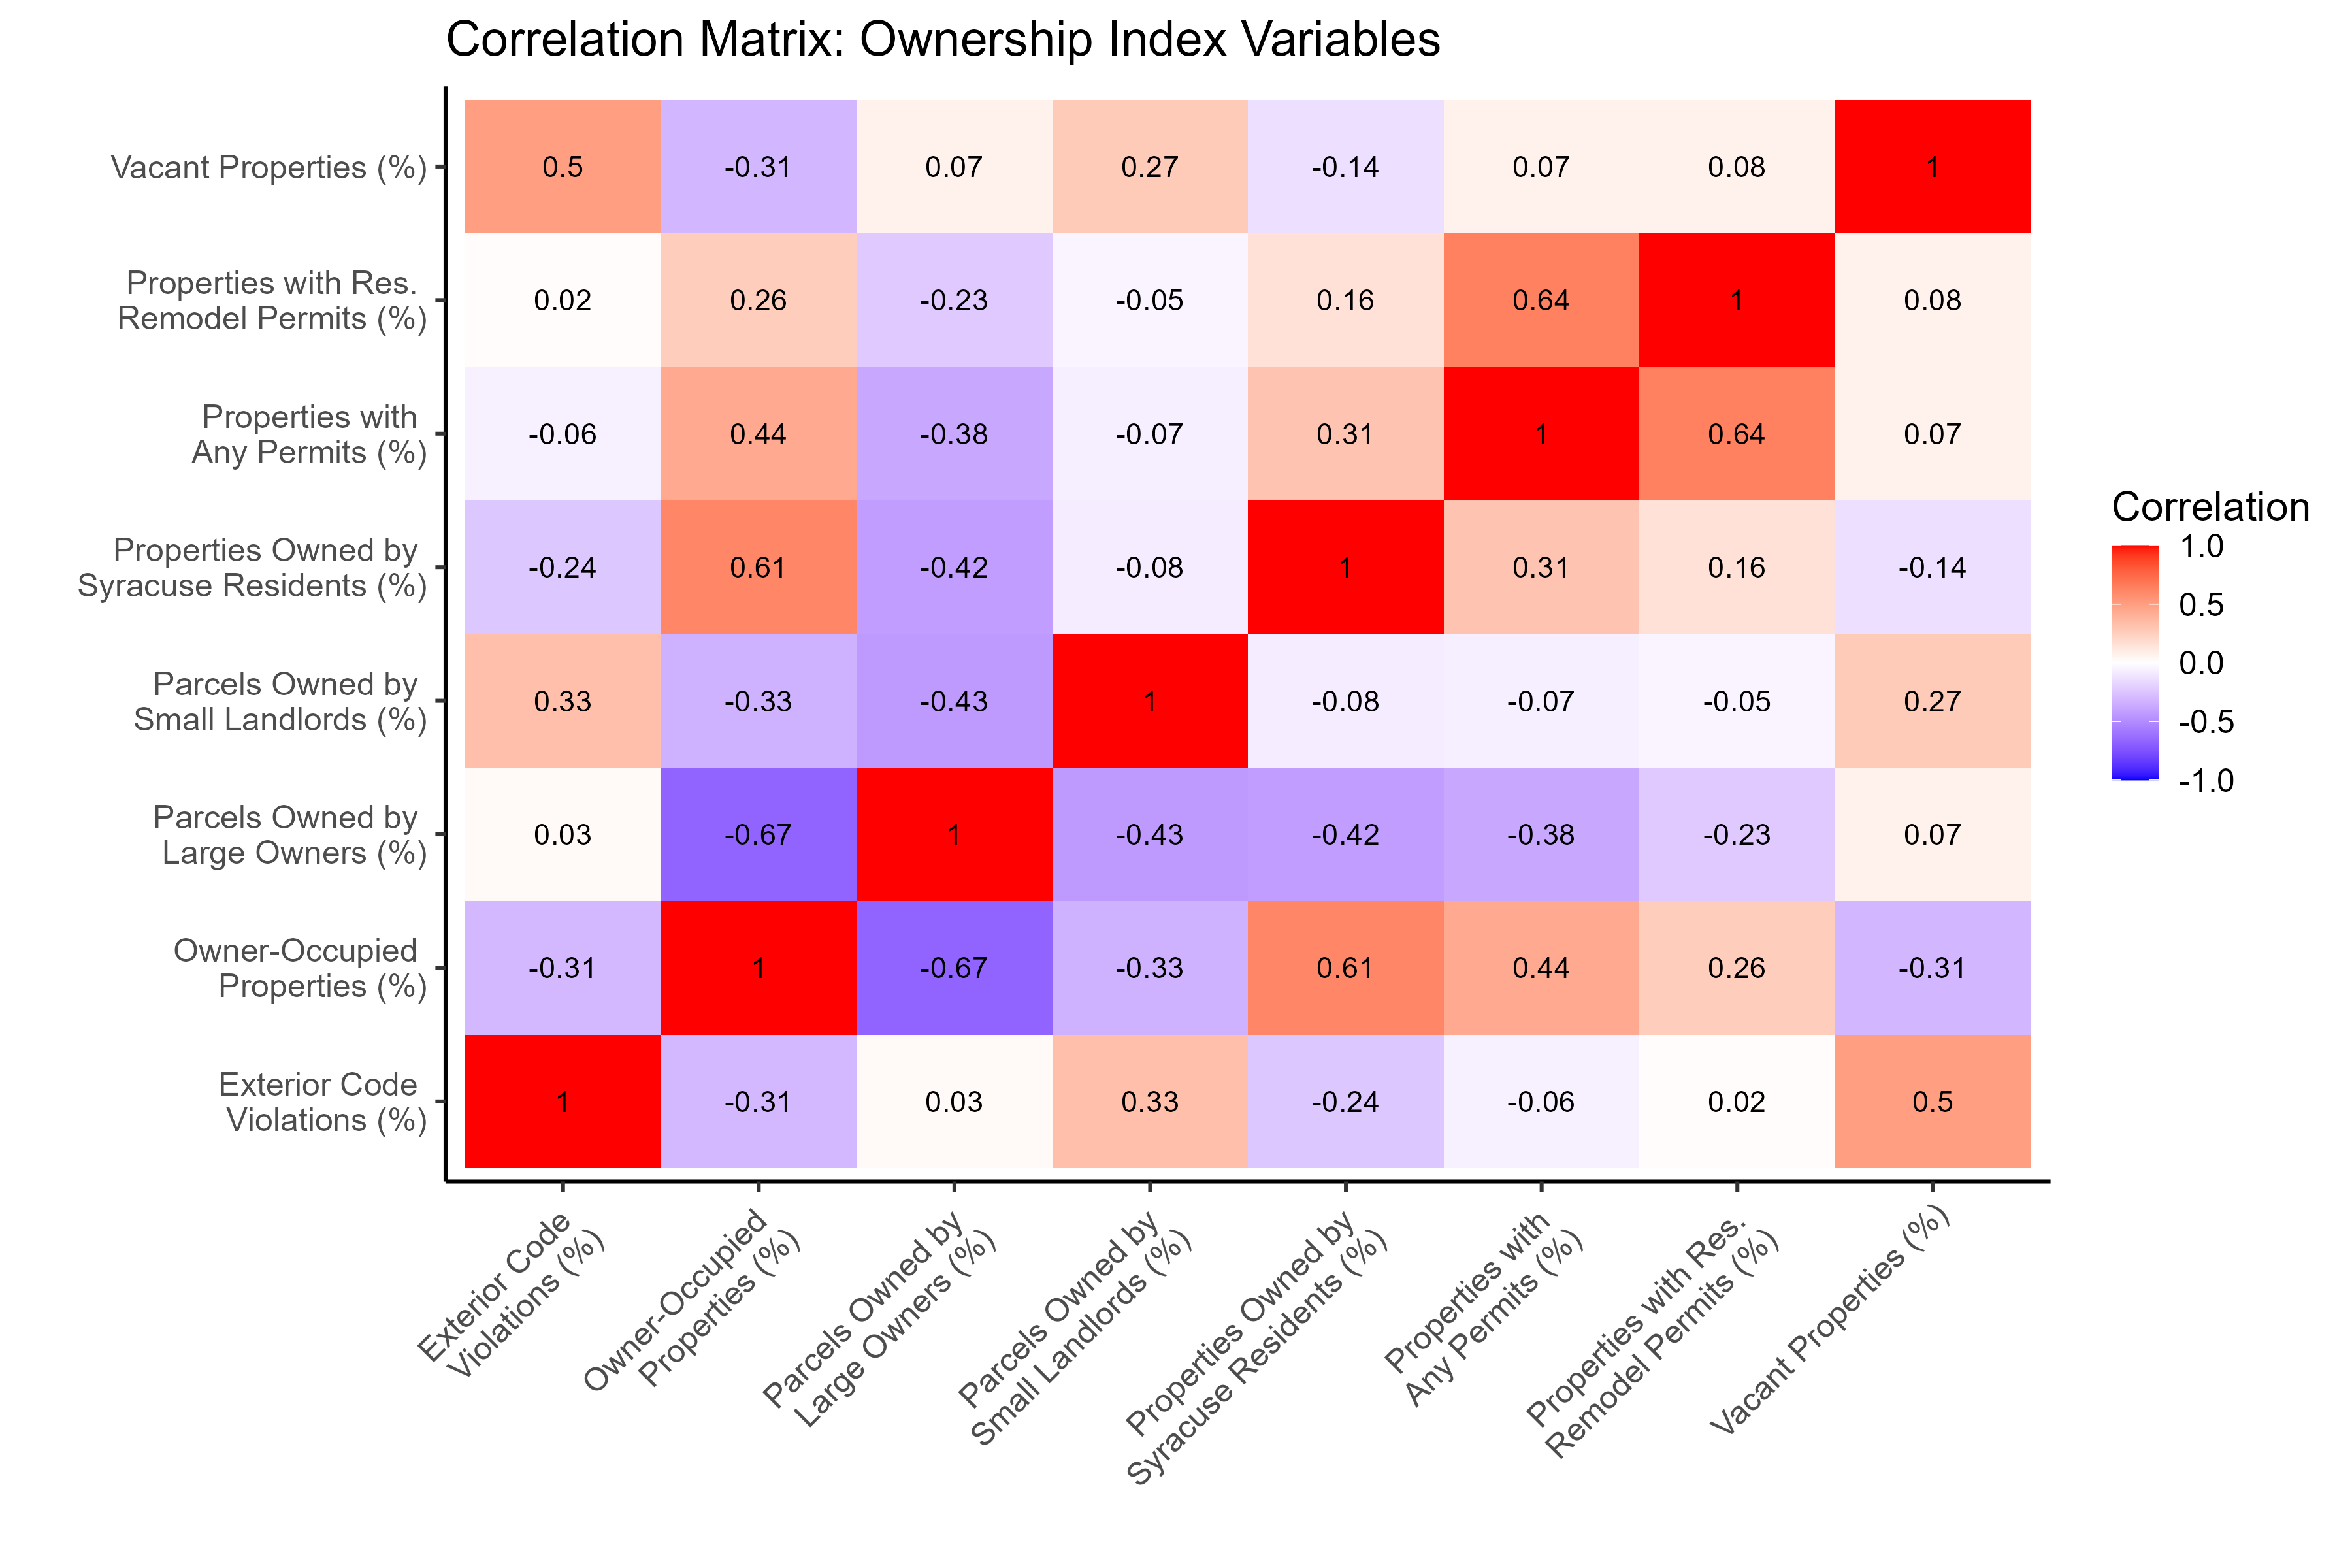
This plot is a heatmap of correlations between the variables used to generate the property guardianship indices.
-

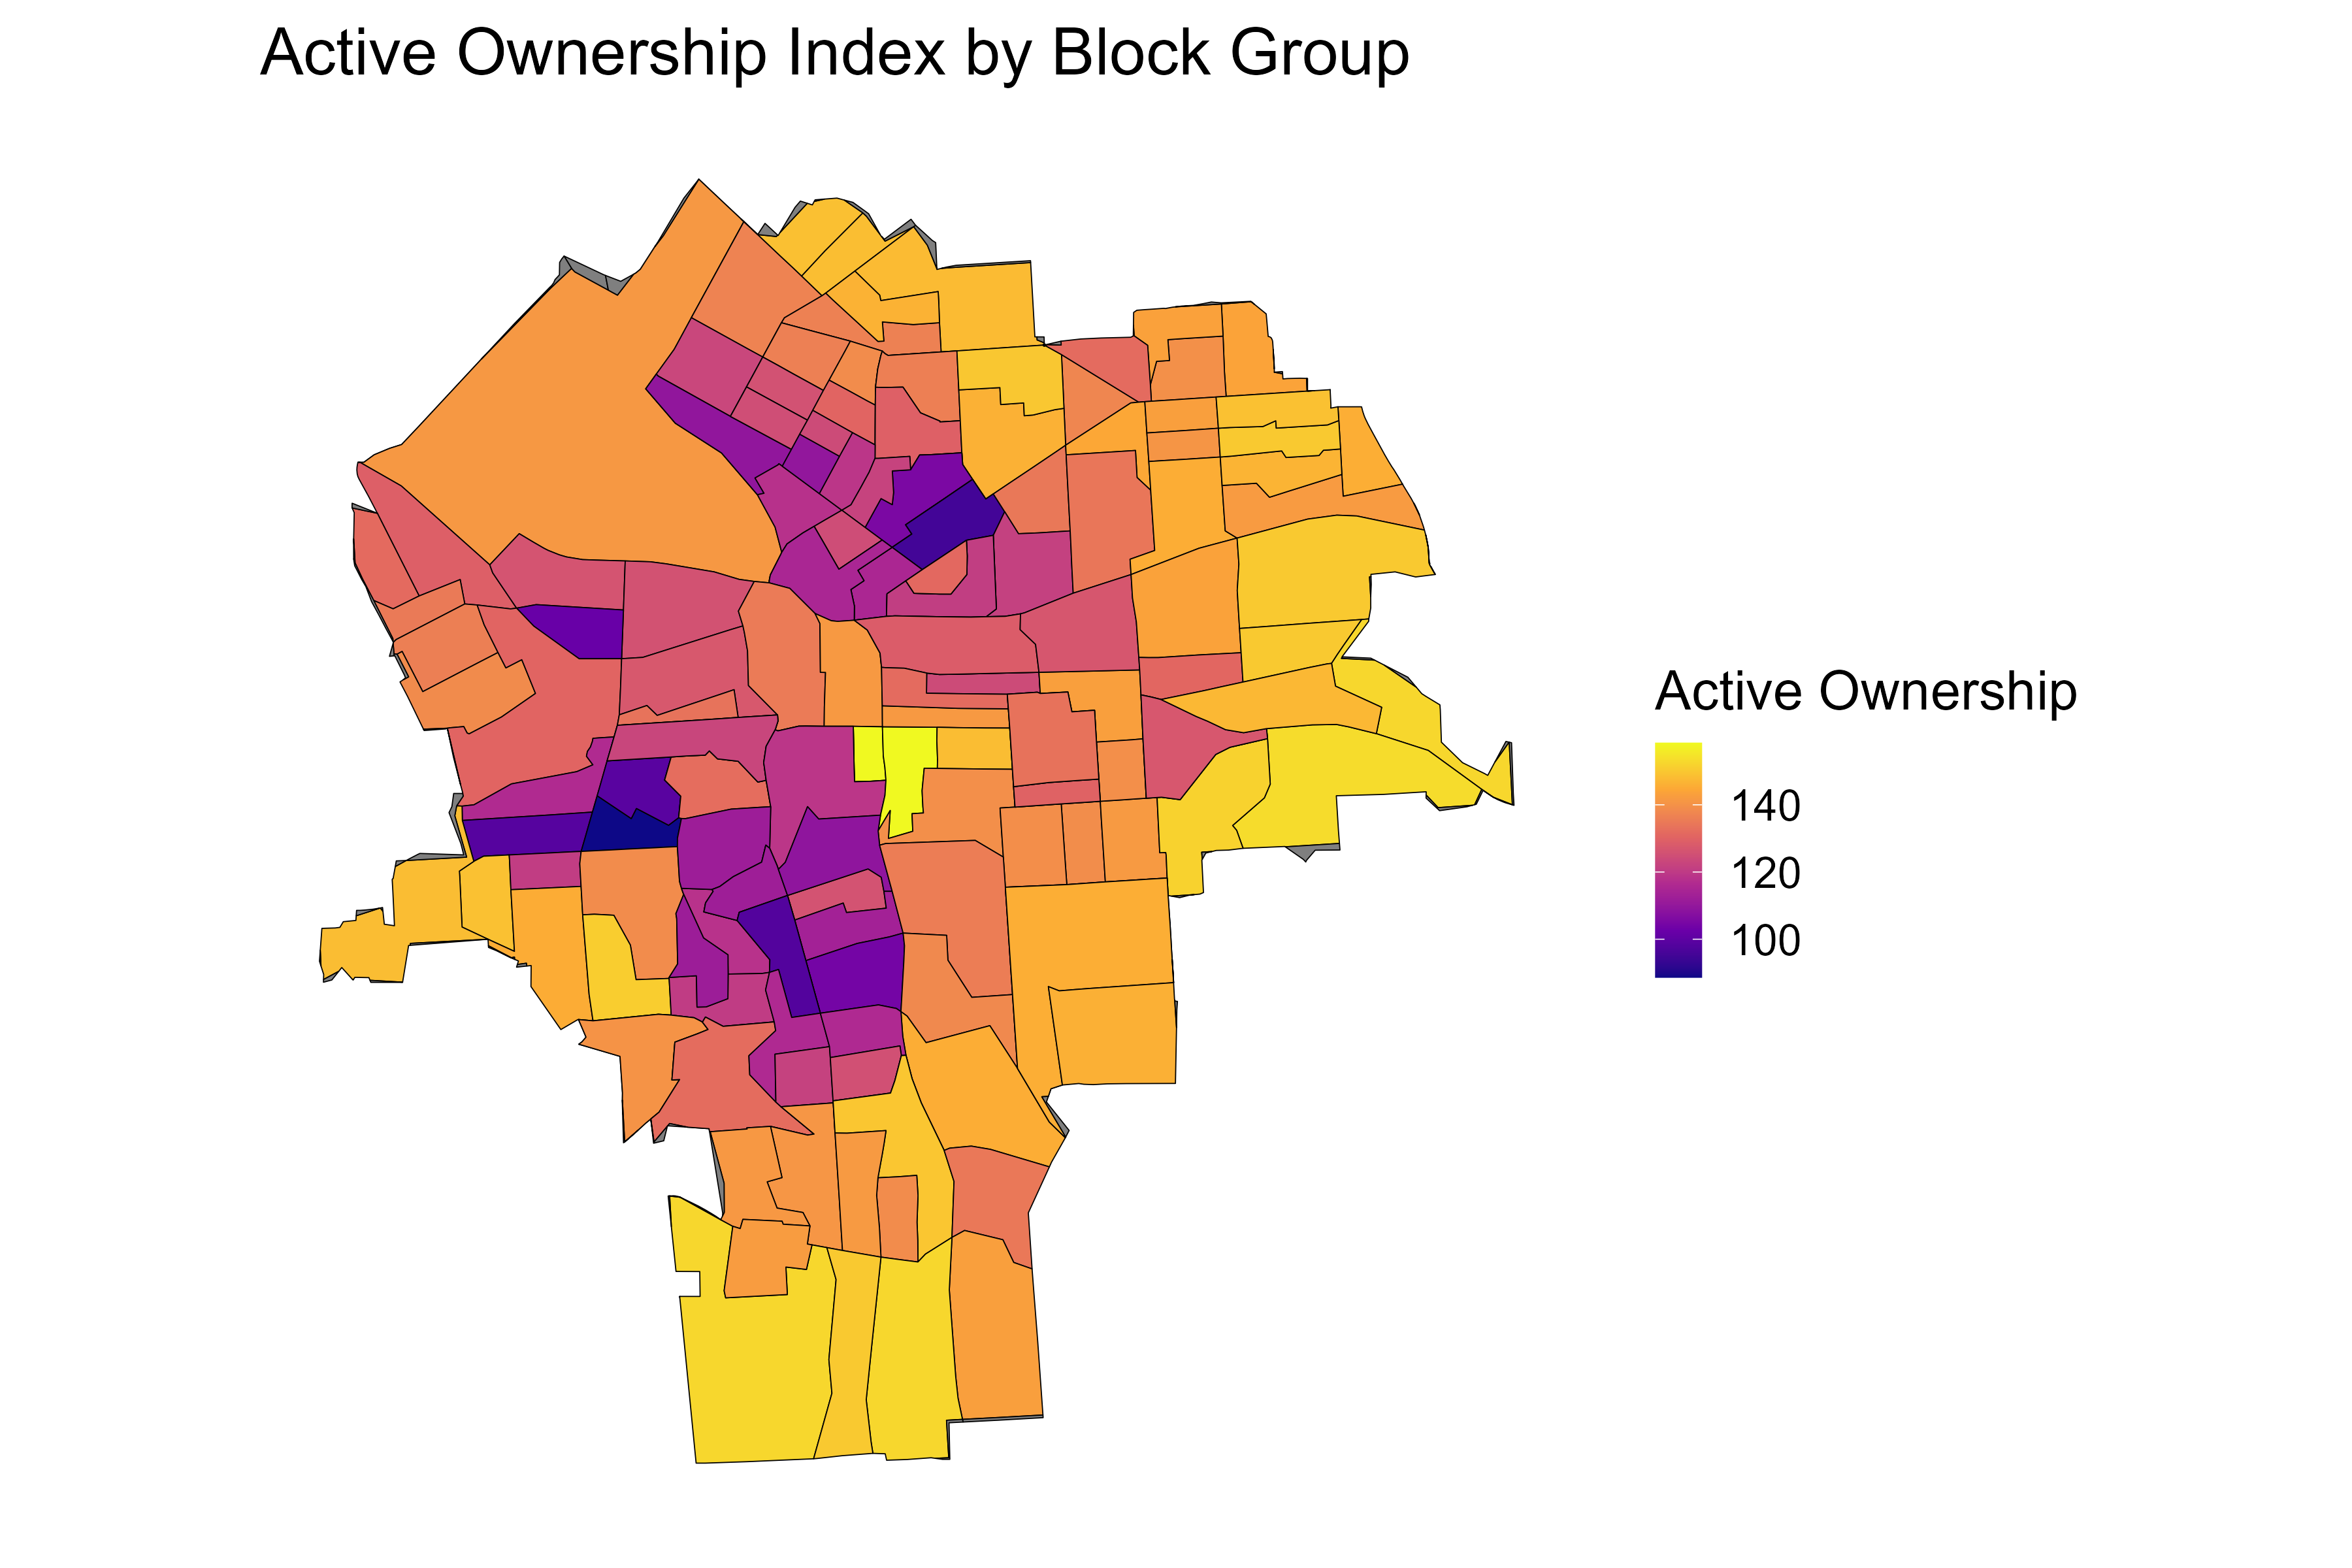
Map of the Active Ownership Index (combined) by Census Block Group
-
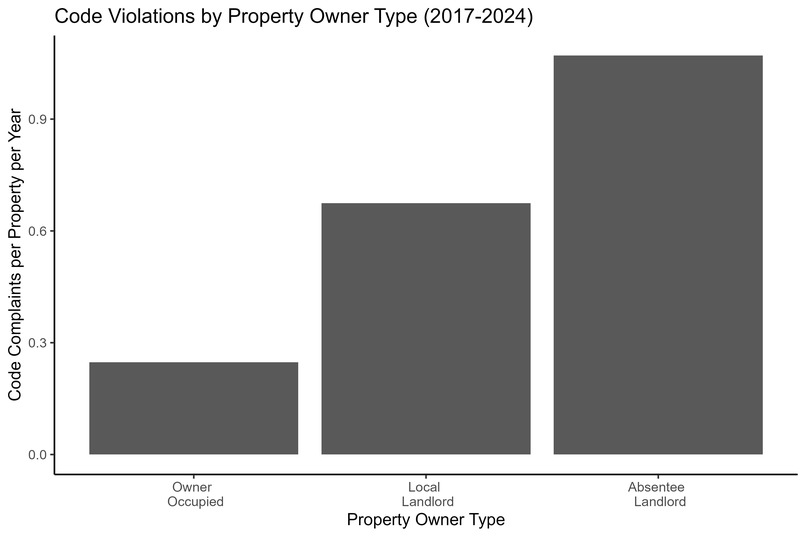
This plot shows, by property owner type, the average number of unique code violation complaints per property.
-
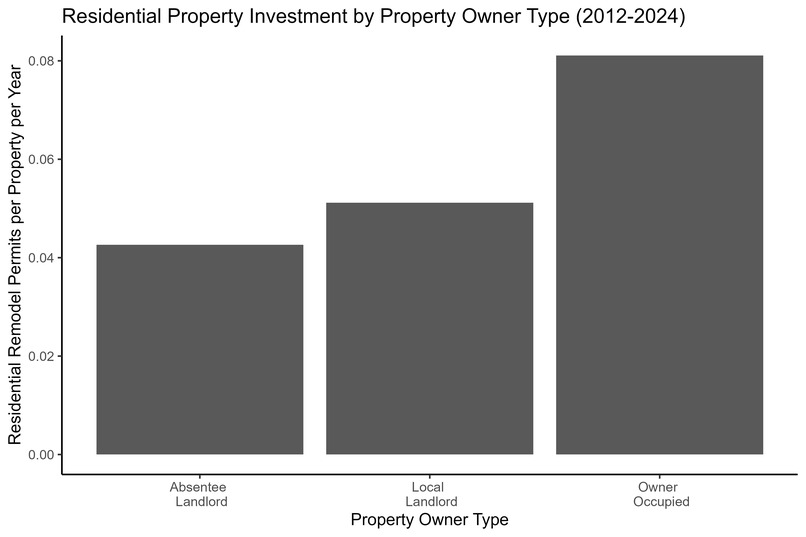
This plot shows, by property owner type, the average number of residential remodeling permits per property.
-
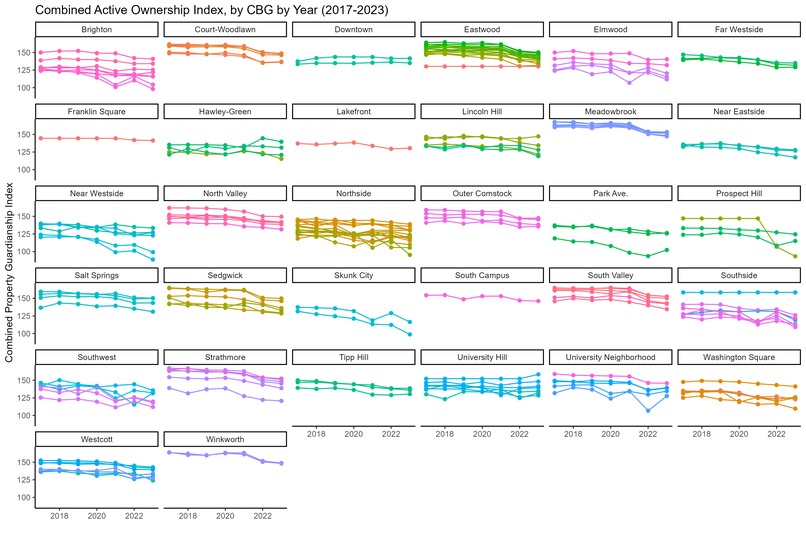
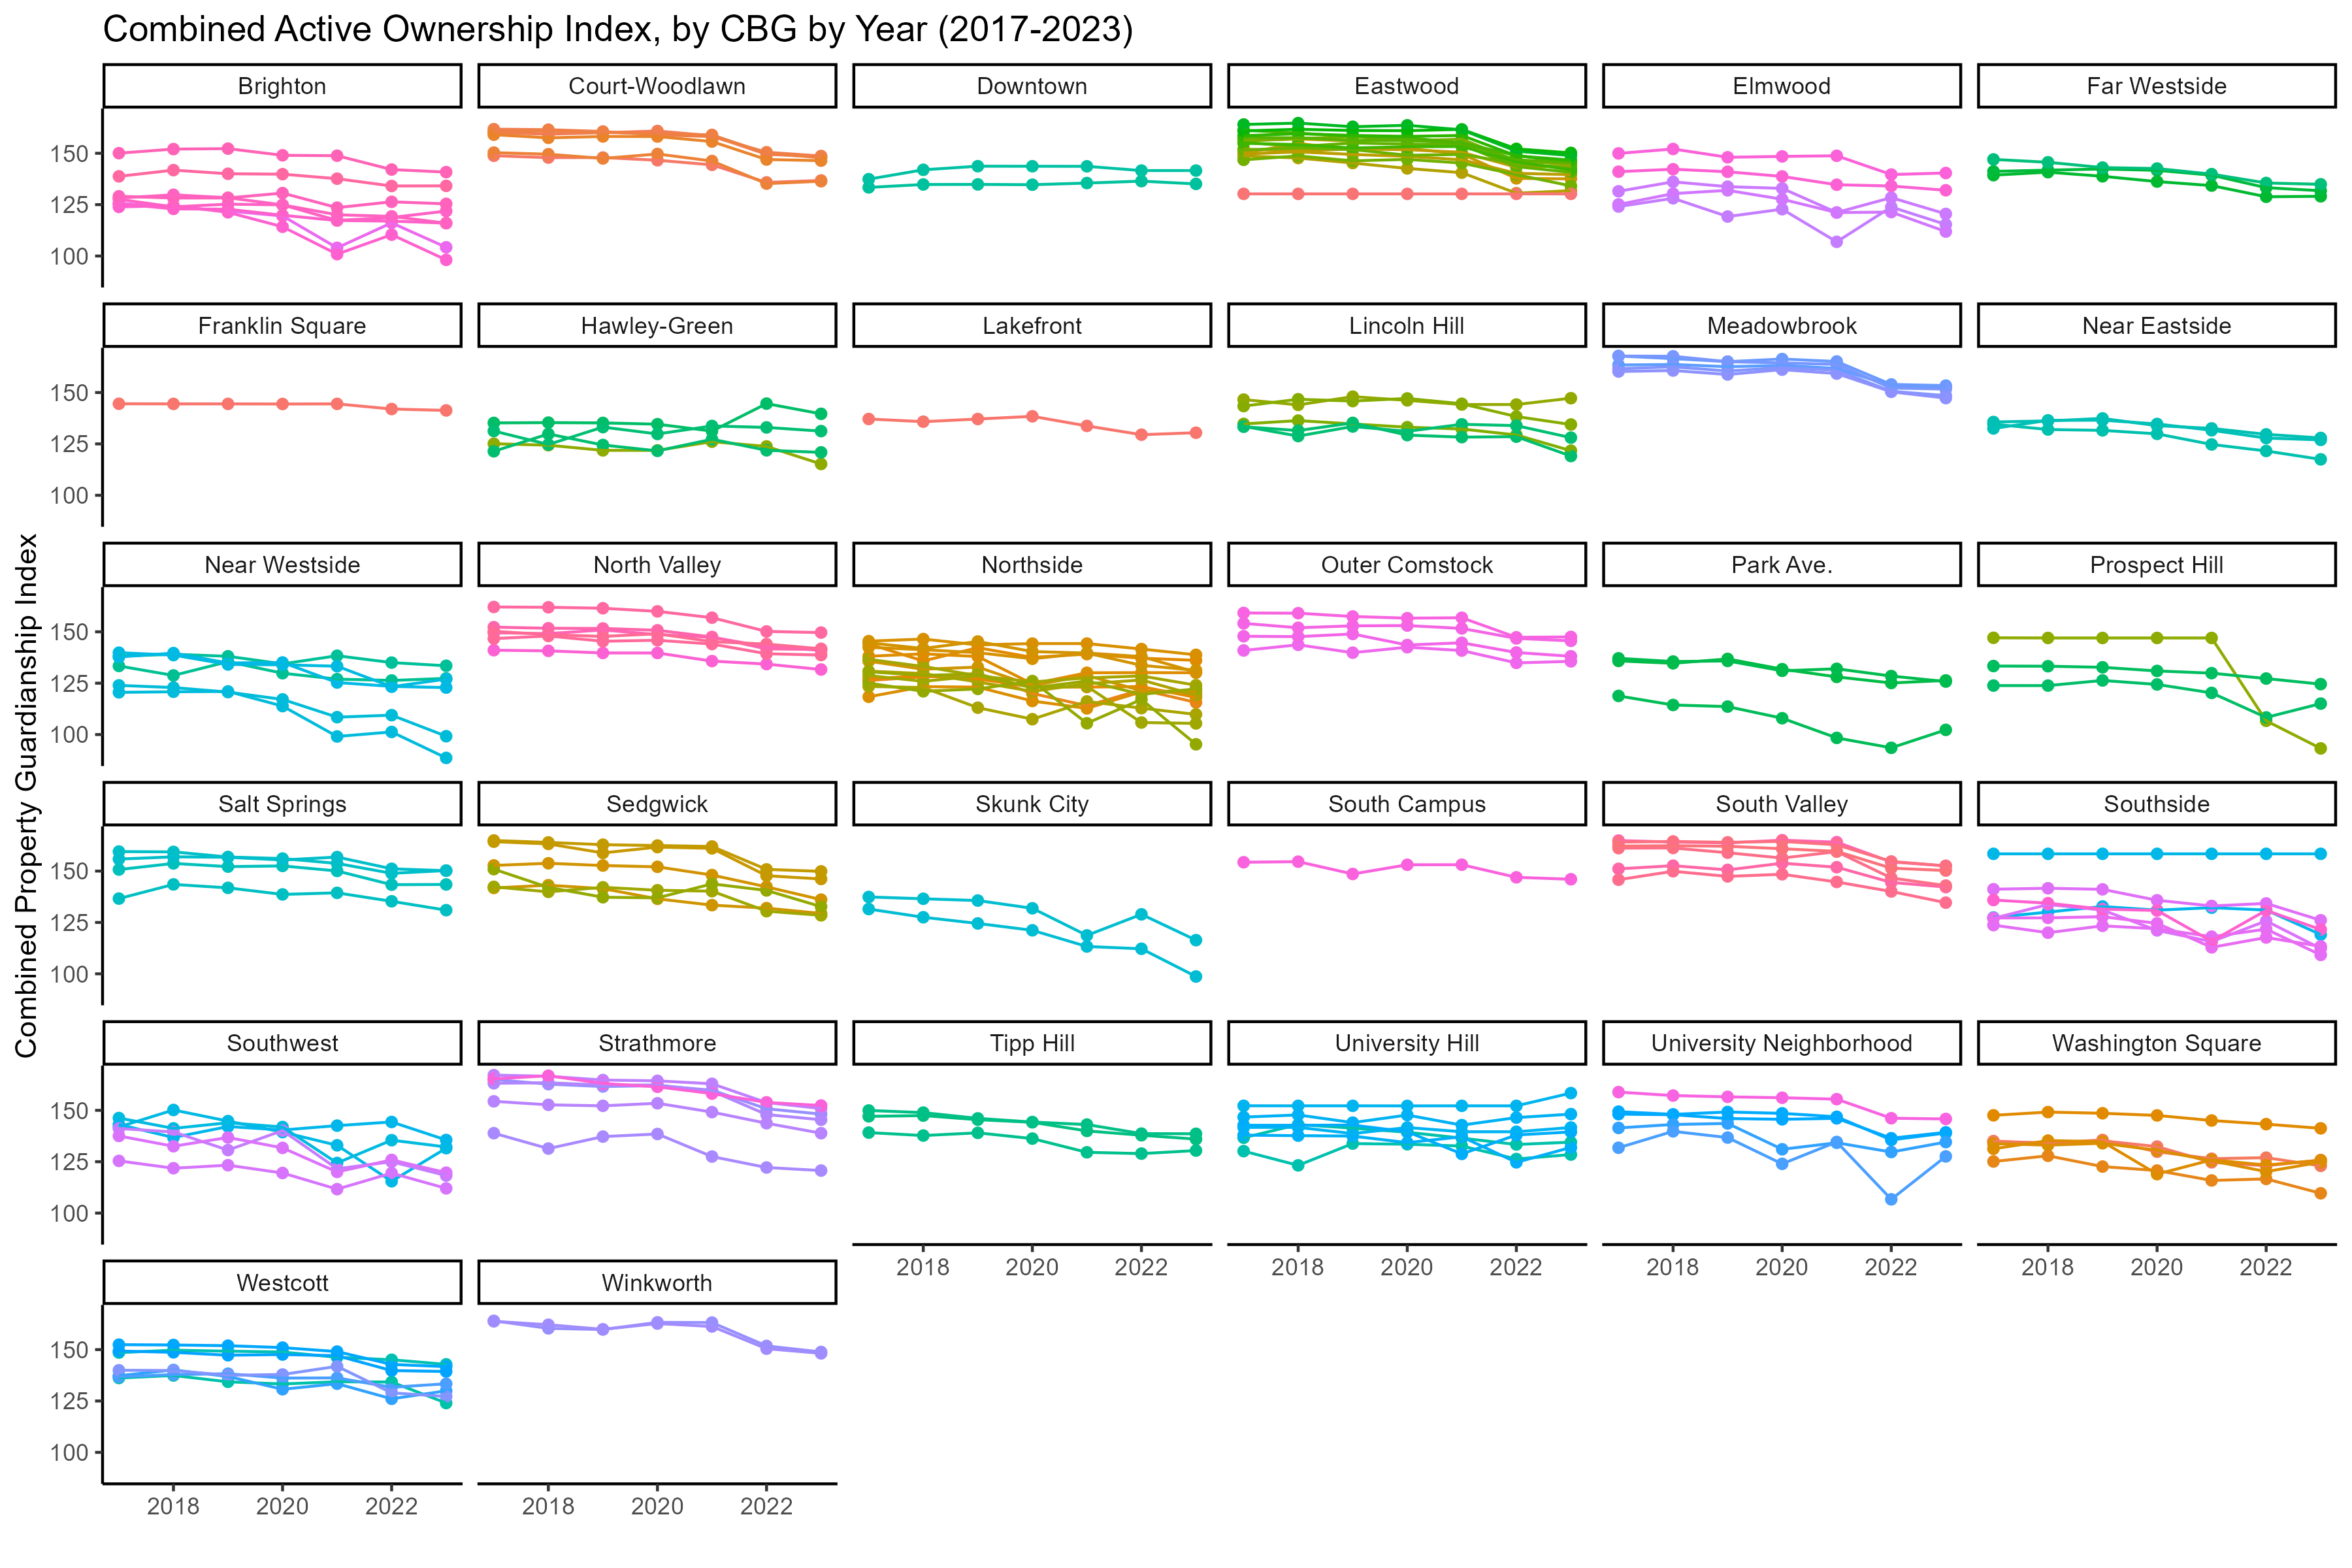
Plots the combined "Active Ownership" annual index by Census Block Group by neighborhood over the 2017-2023 period.
-
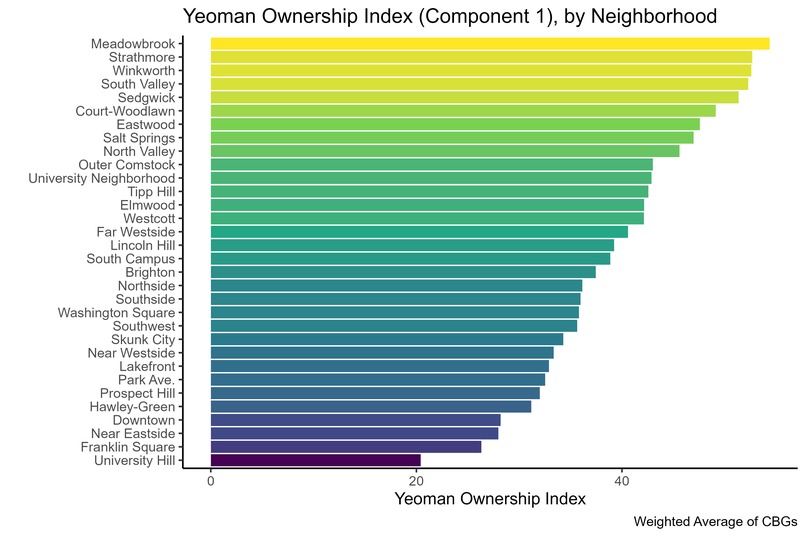
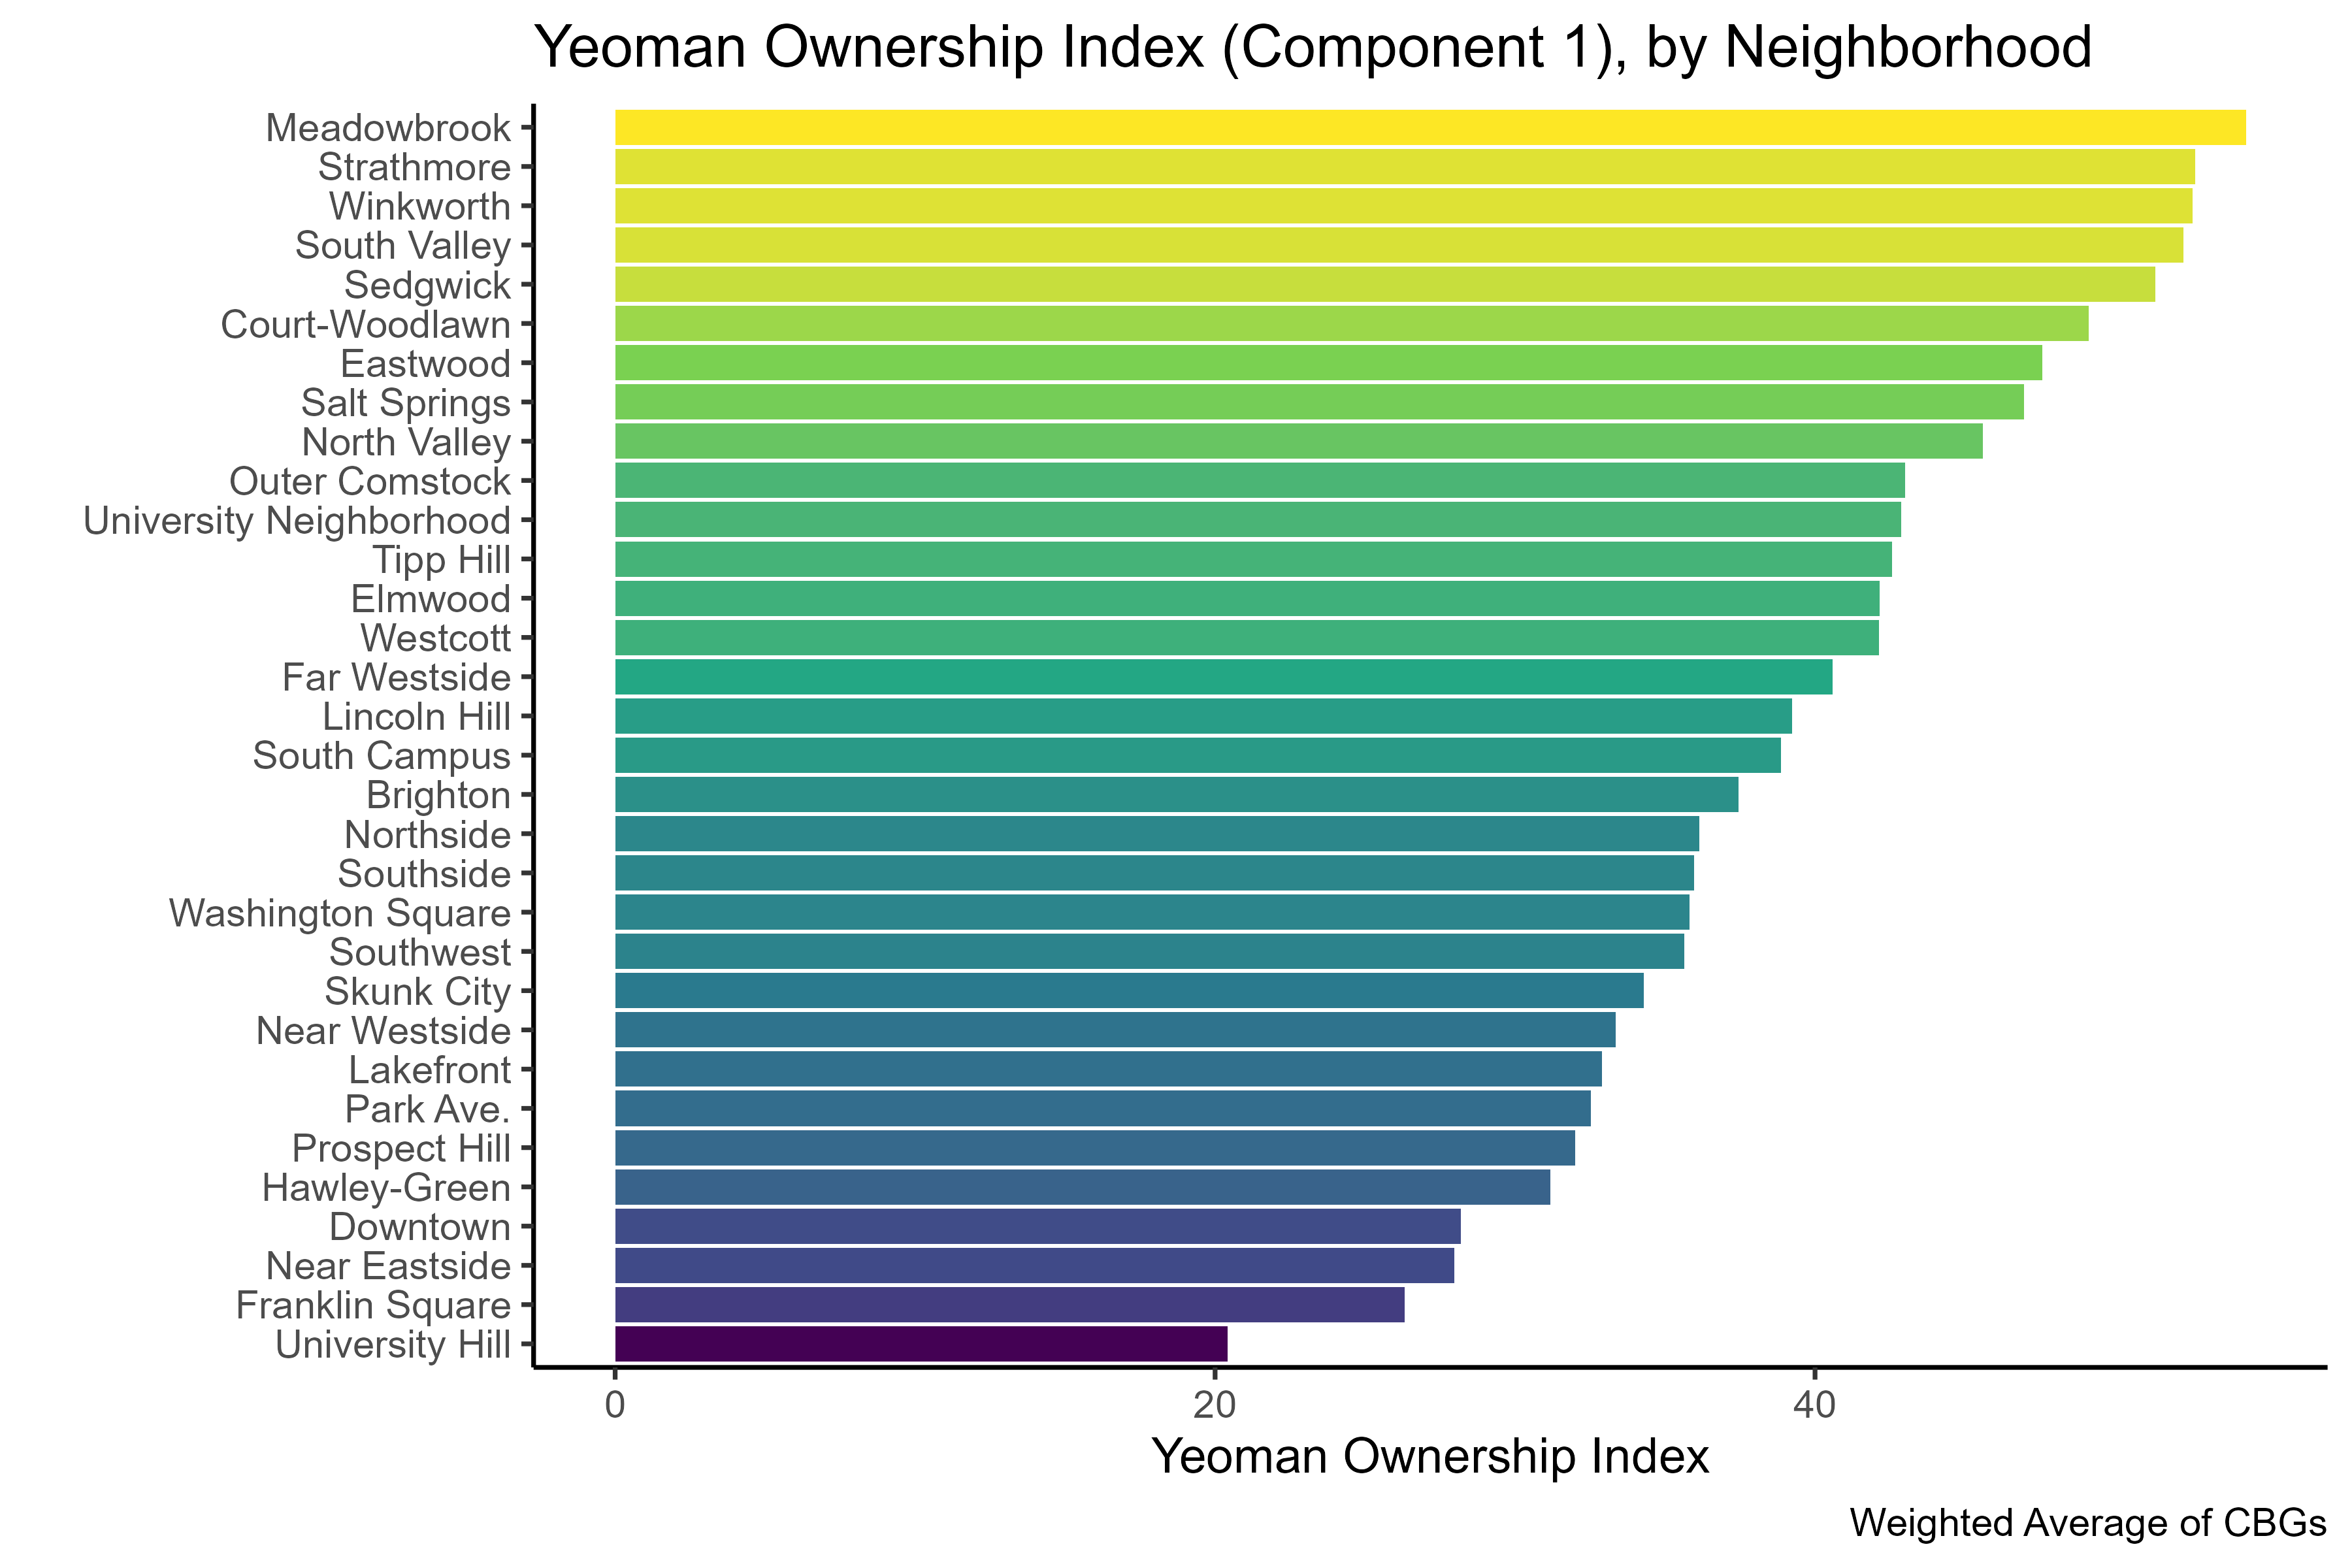
Yeoman Homeownership index by neighborhood, an average (weighted by the number of residential parcels) of Block Group scores.
-
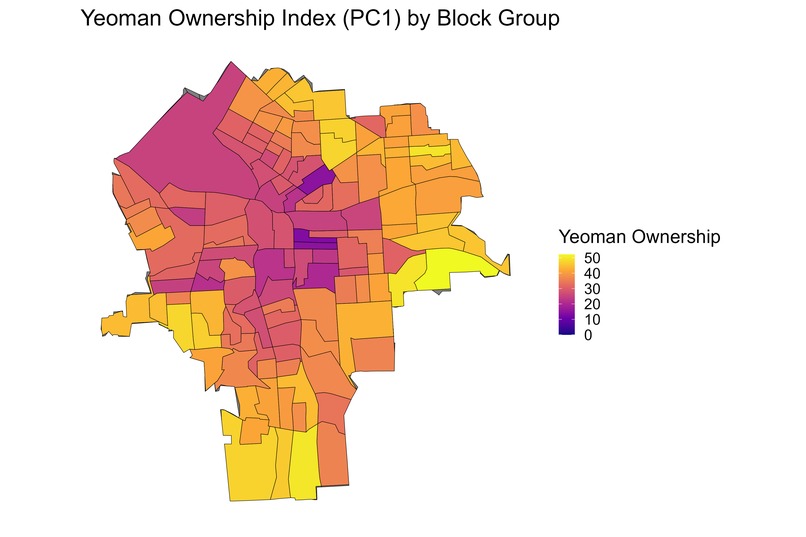
Map of the Yeoman Ownership Index (PC1) by Census Block Group
-
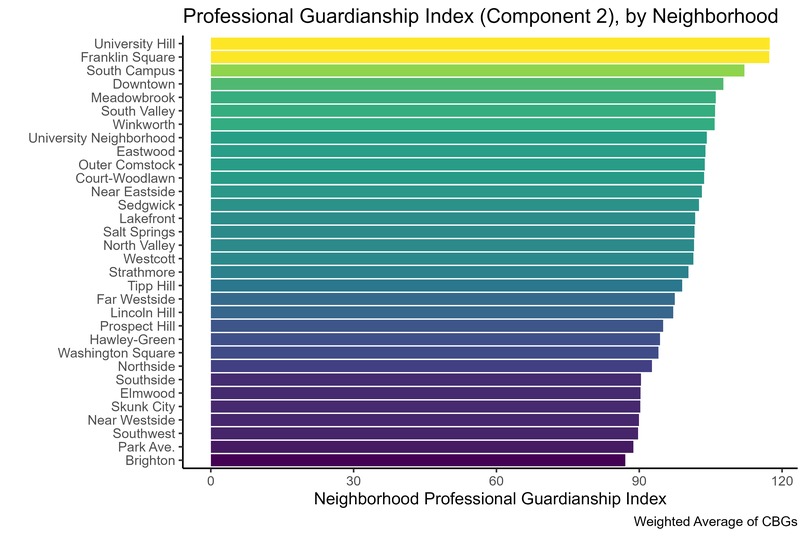
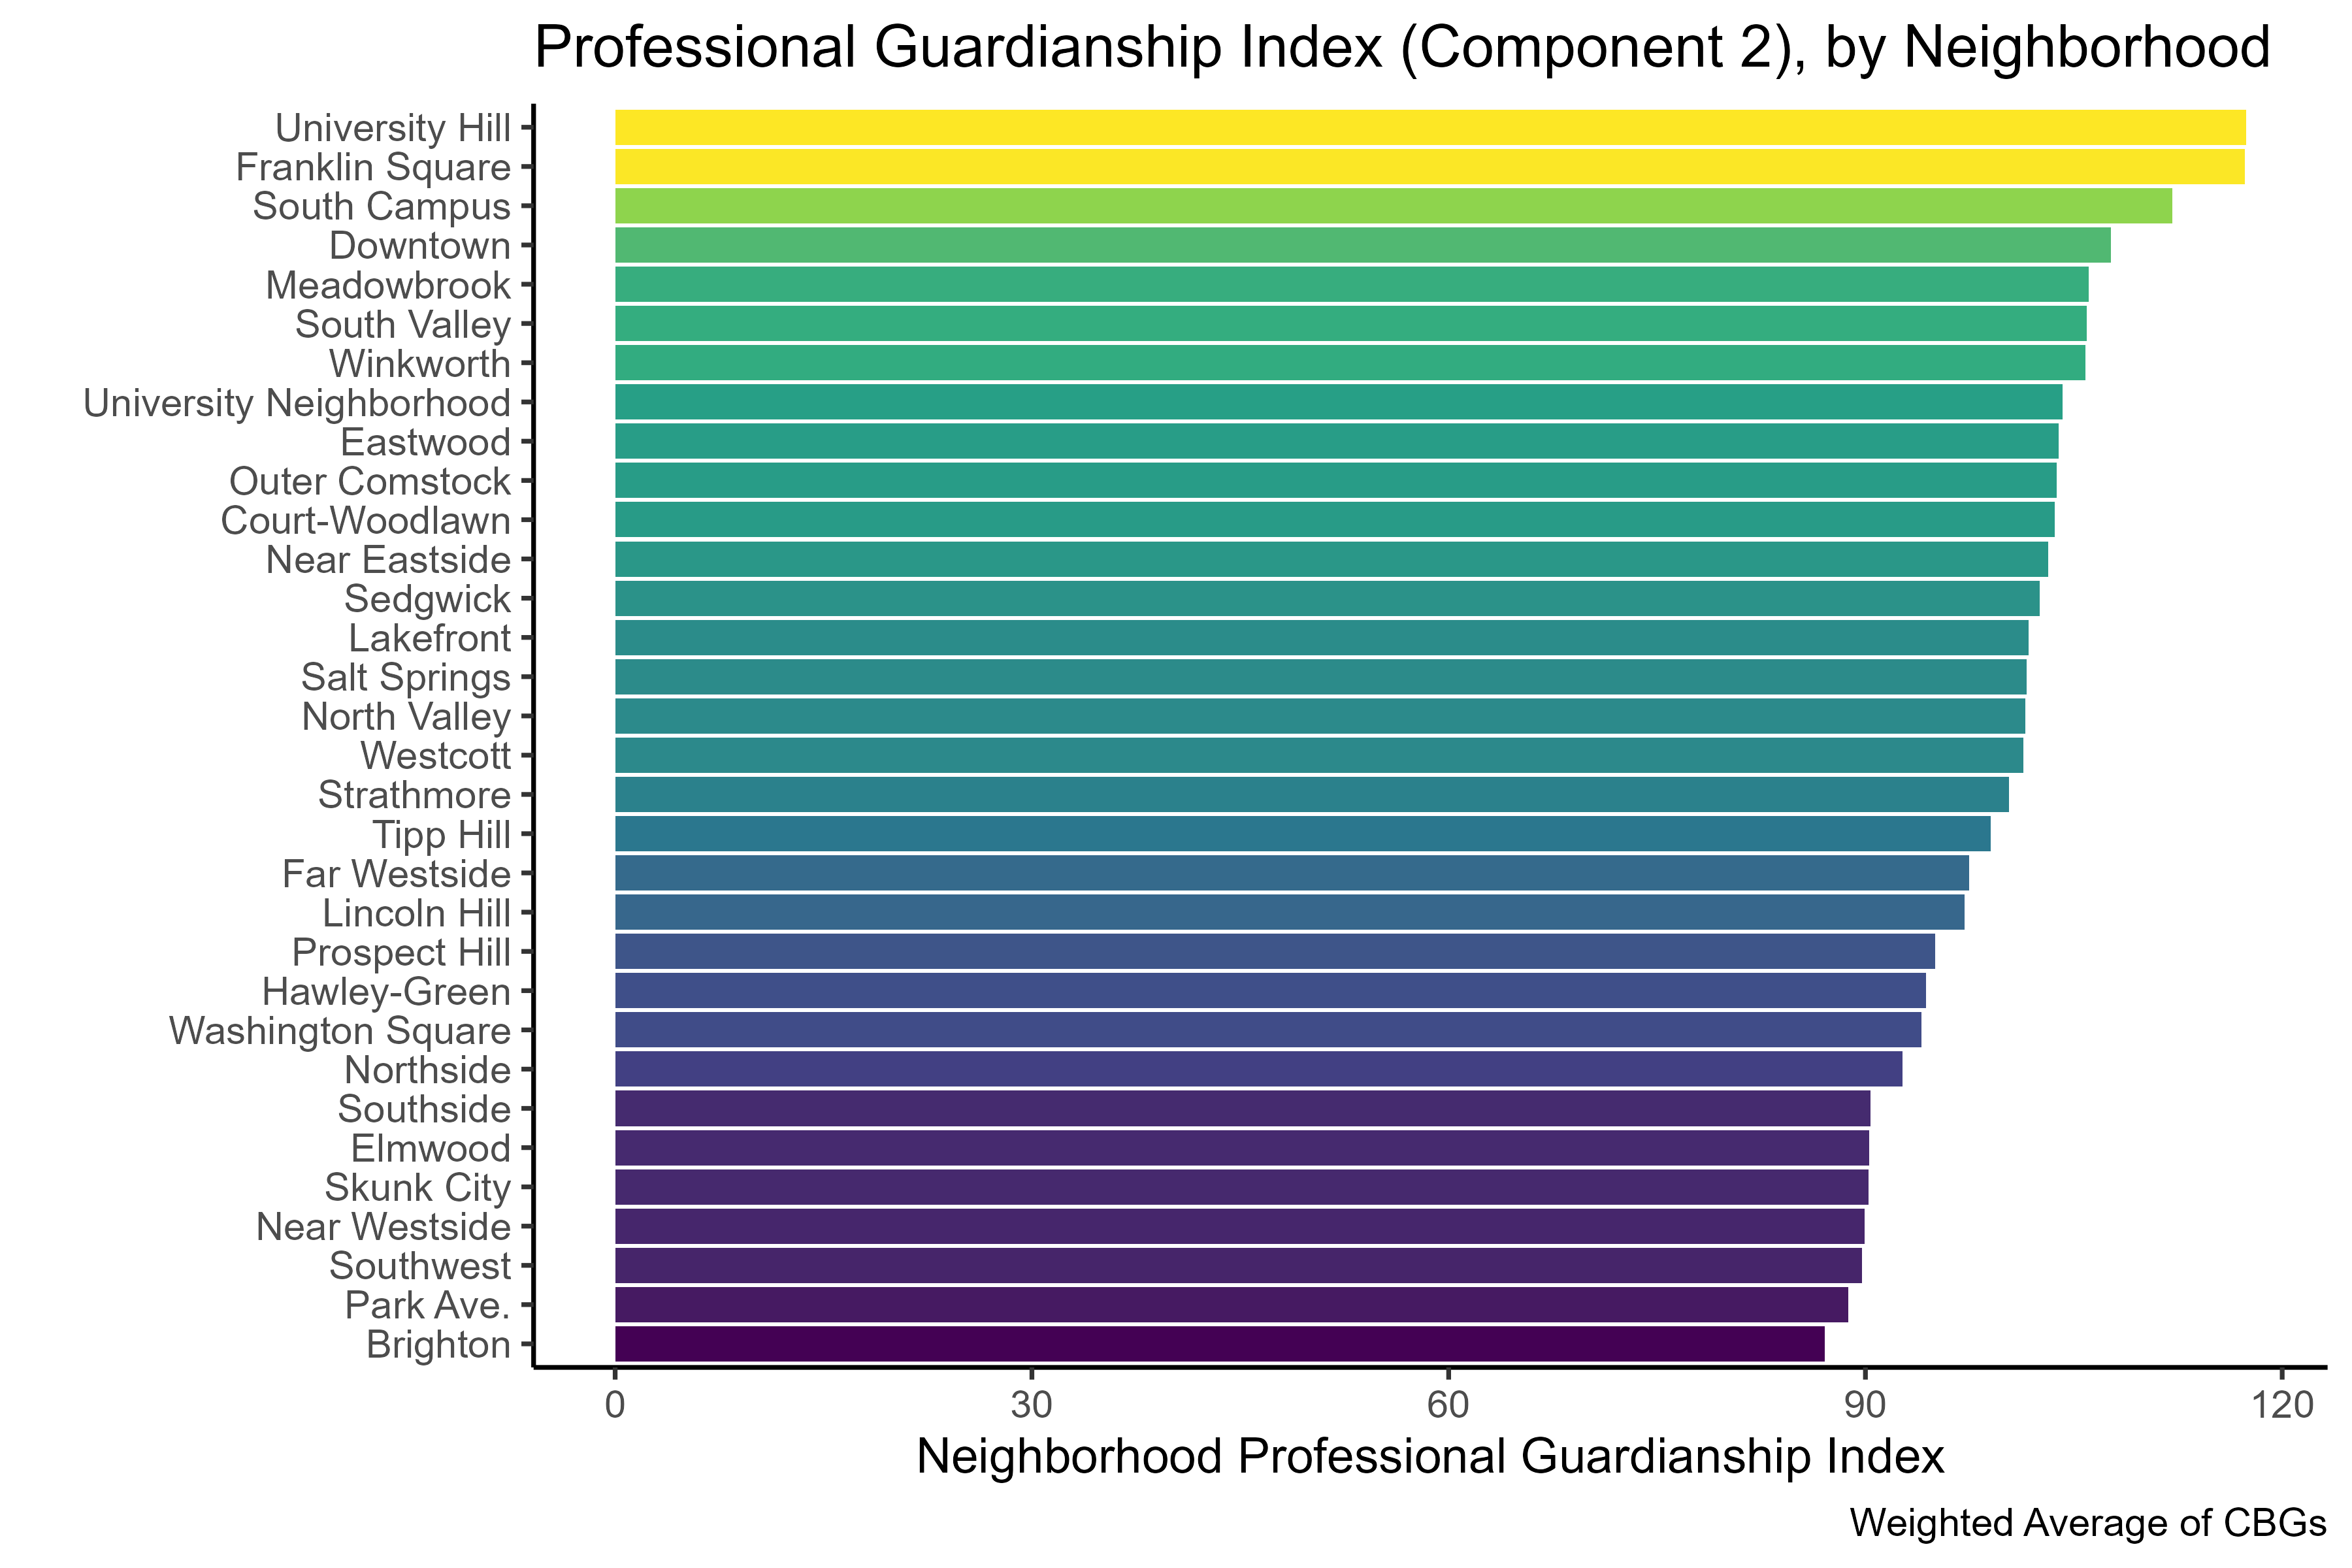
Professional Guardianship index by neighborhood, an average (weighted by the number of residential parcels) of Block Group scores.
-

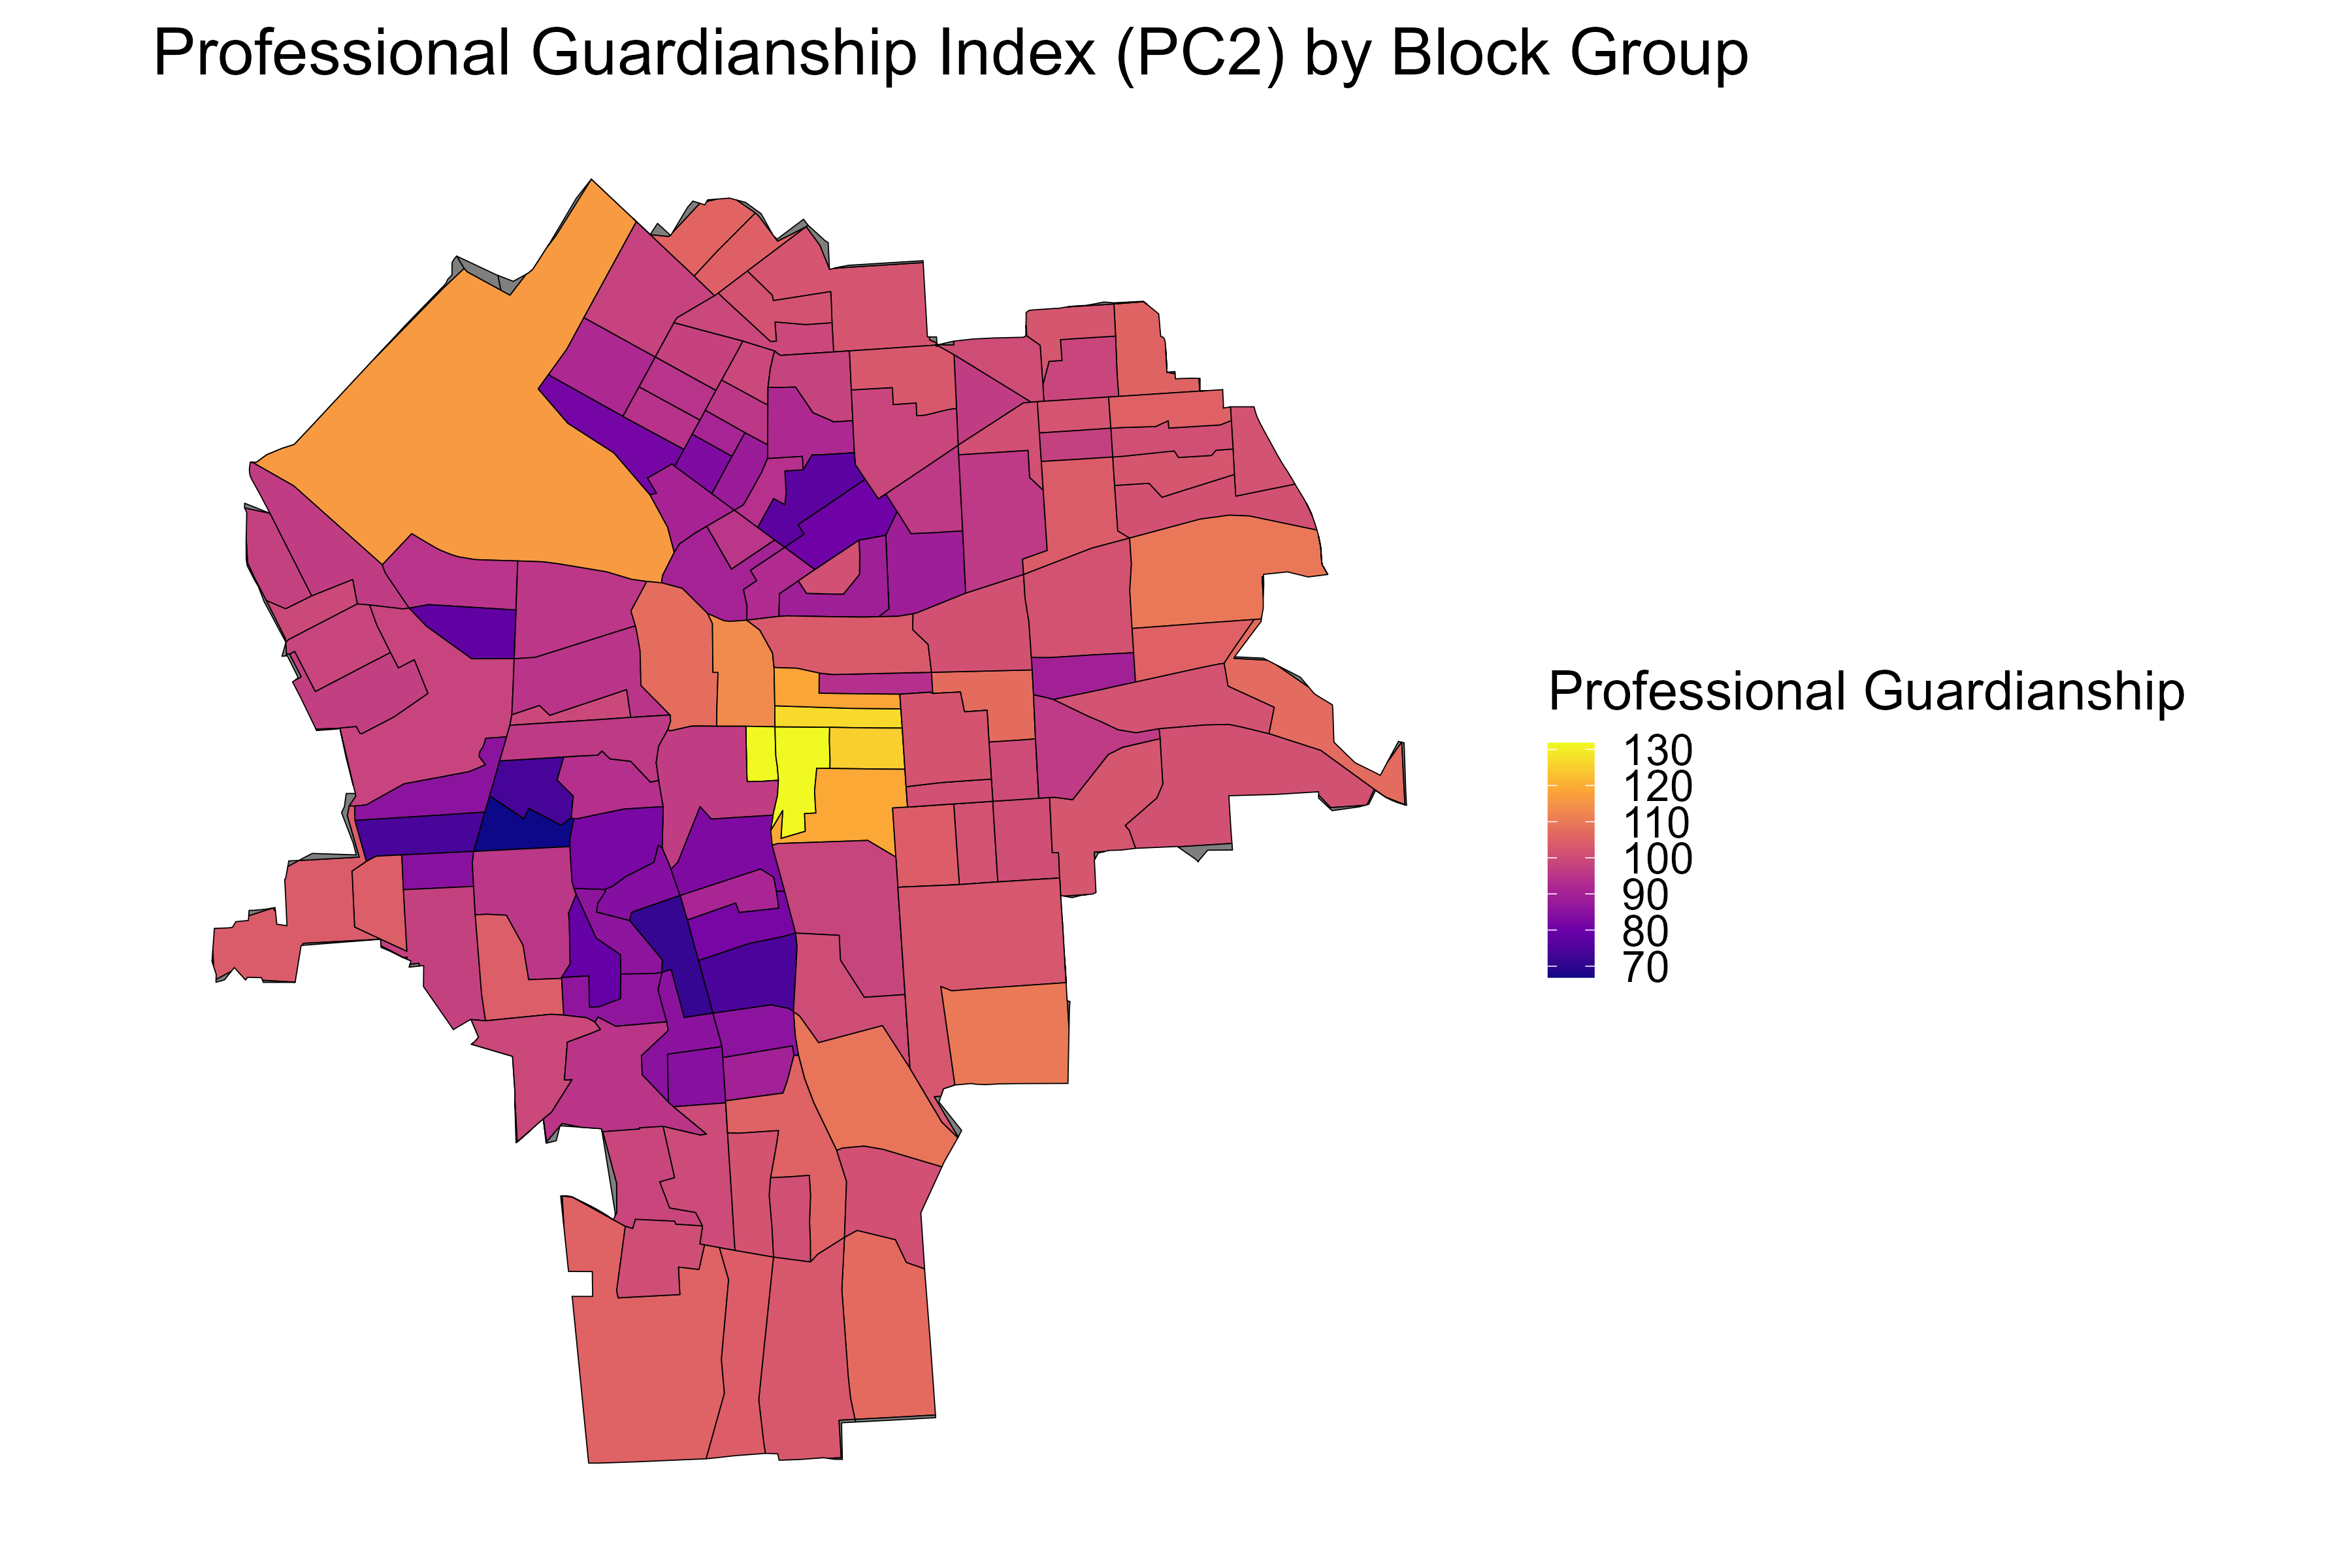
Map of the Professional Guardianship Index (PC2) by Census Block Group
-

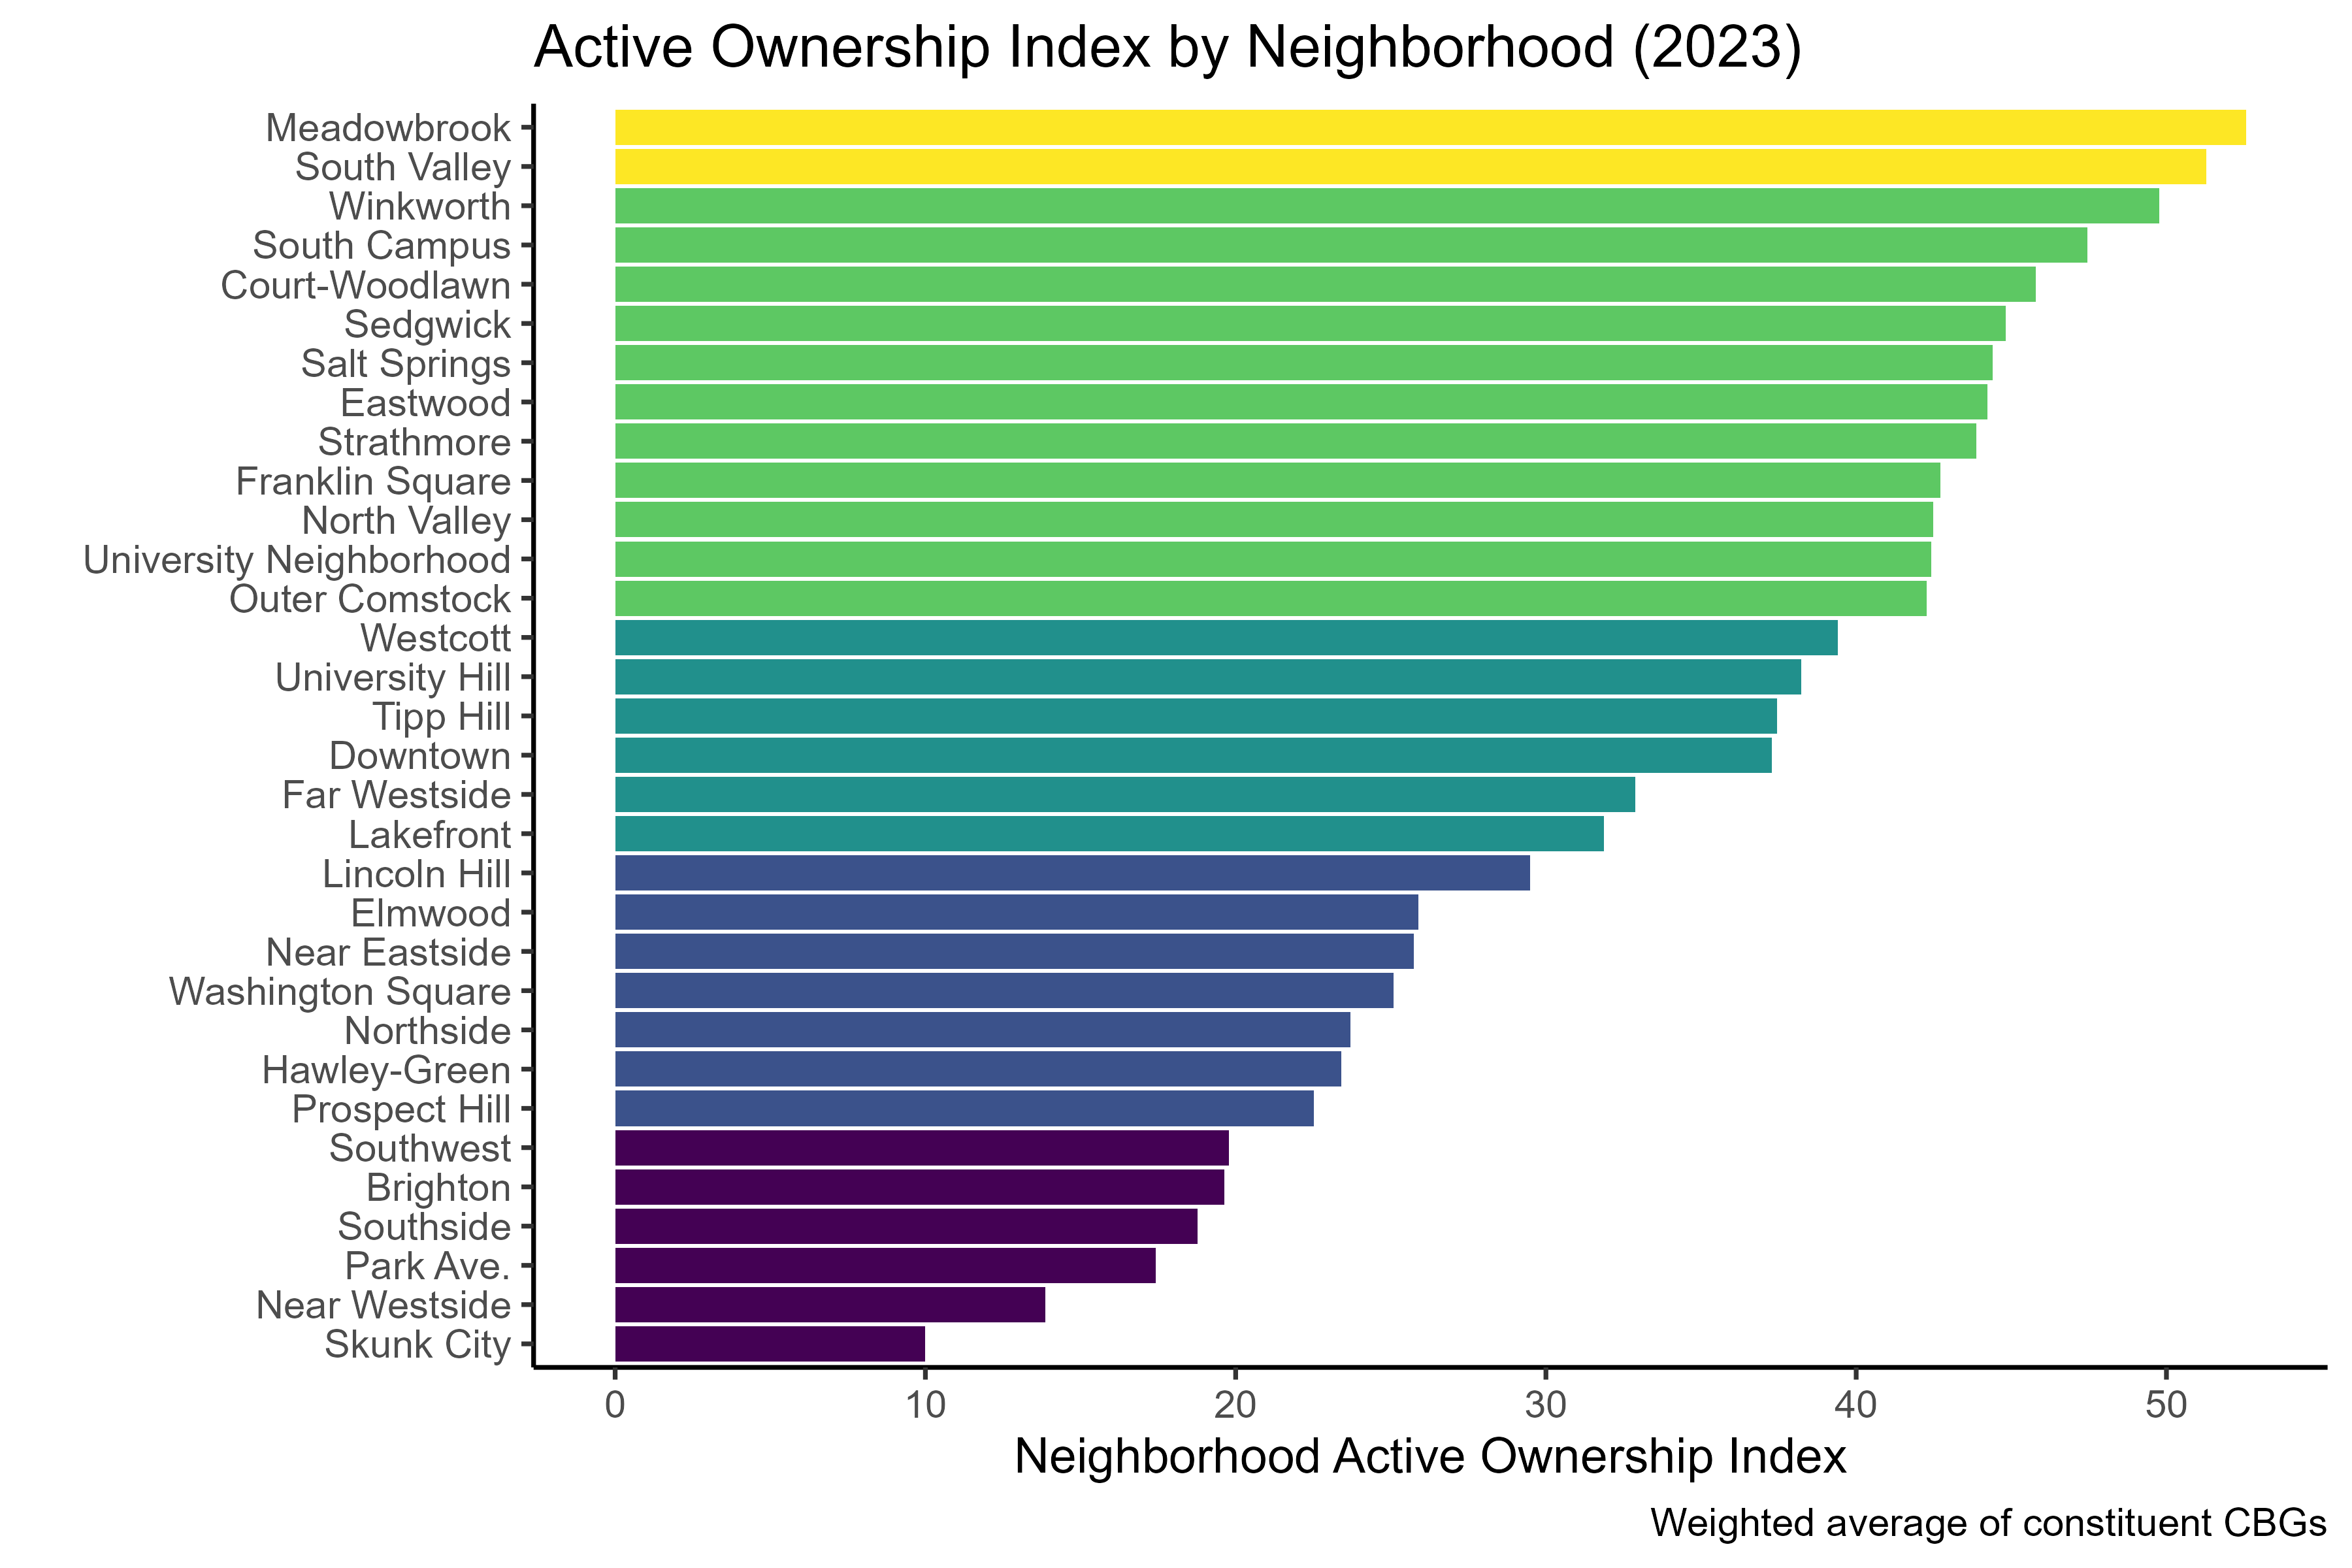
Combined Active Ownership index by neighborhood, an average (weighted by the number of residential parcels) of Block Group scores.
-
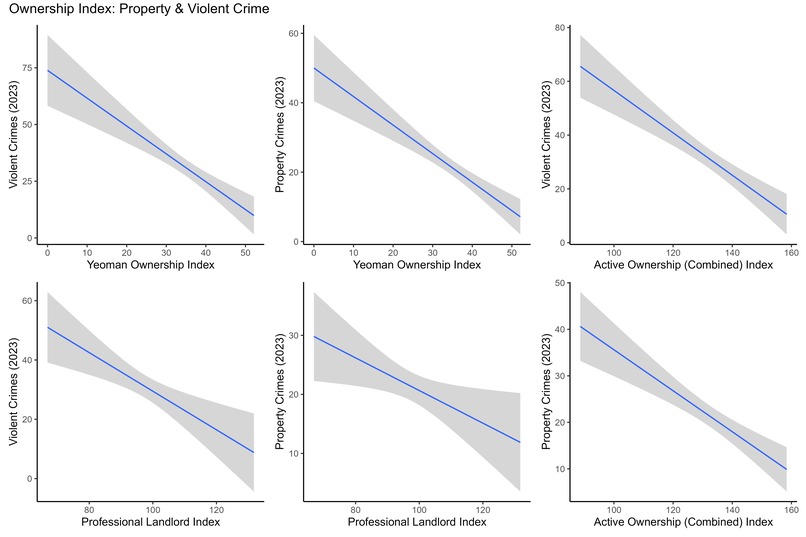
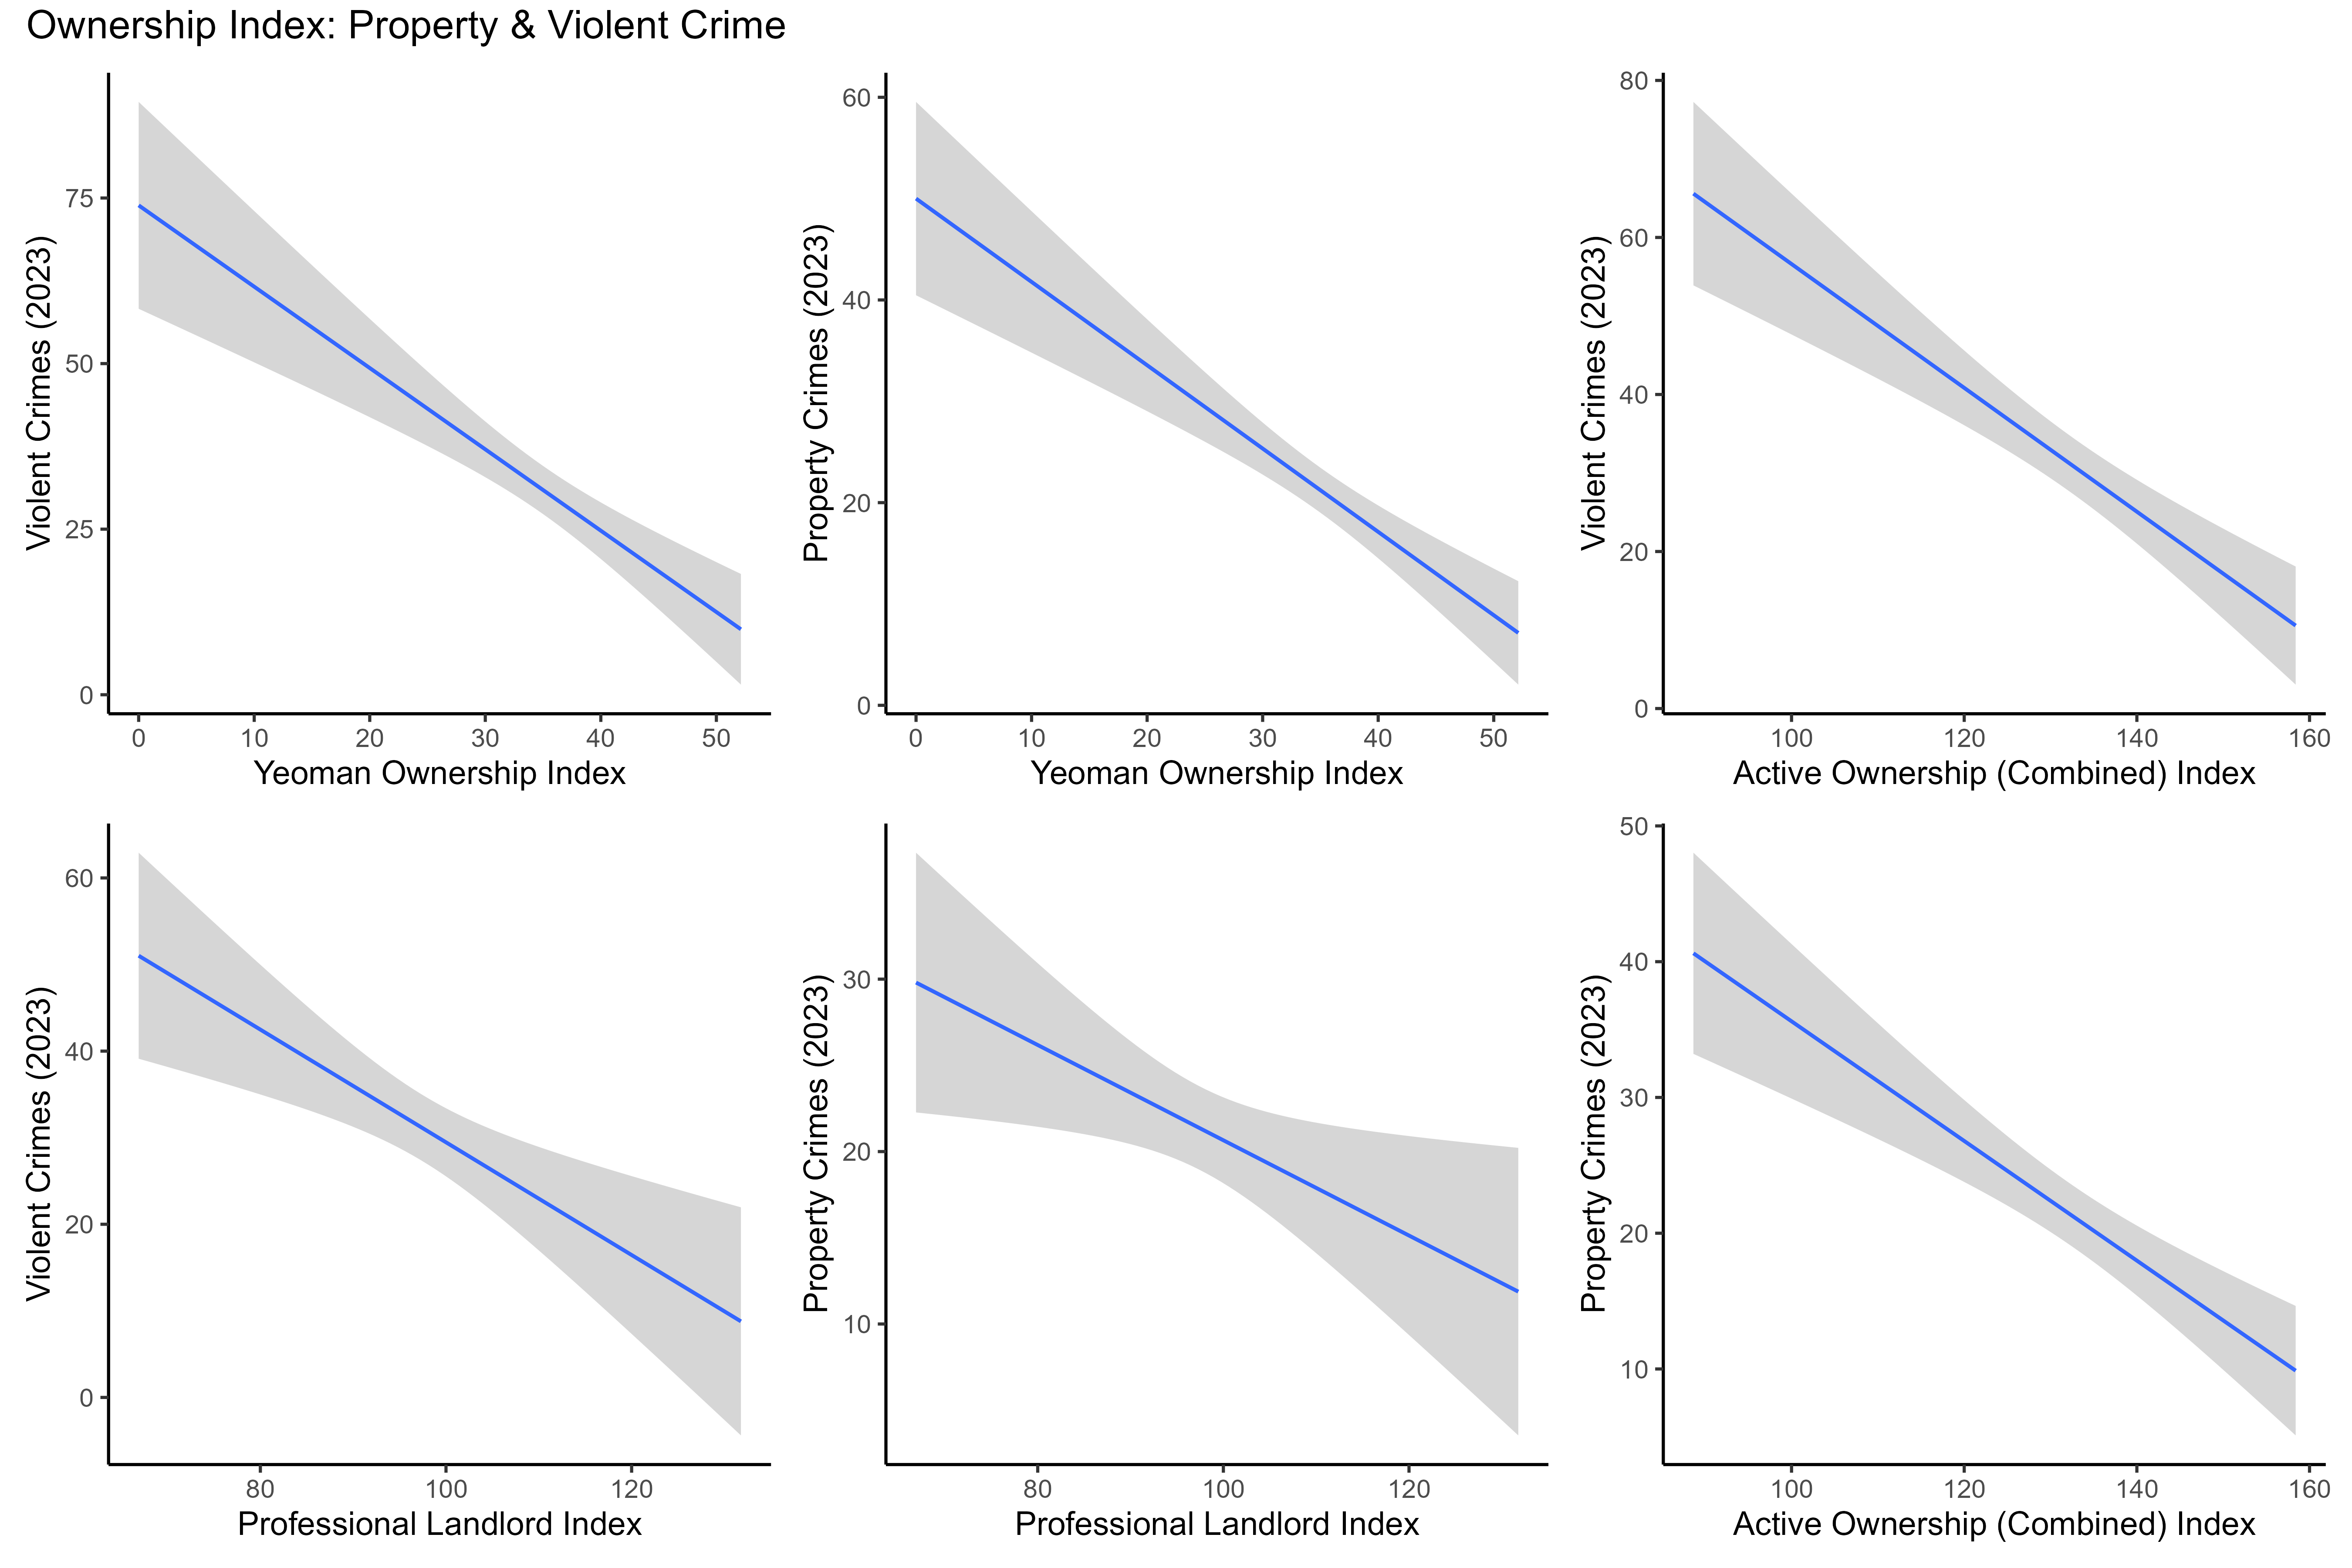
Plots showing how the Yeoman Ownership, Professional Guardianship, and Combined Active Ownership index each predict lower crime.
-
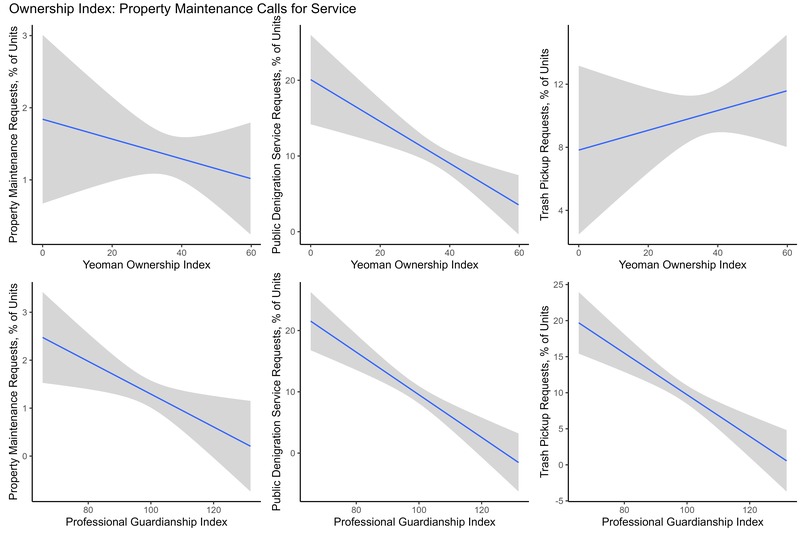
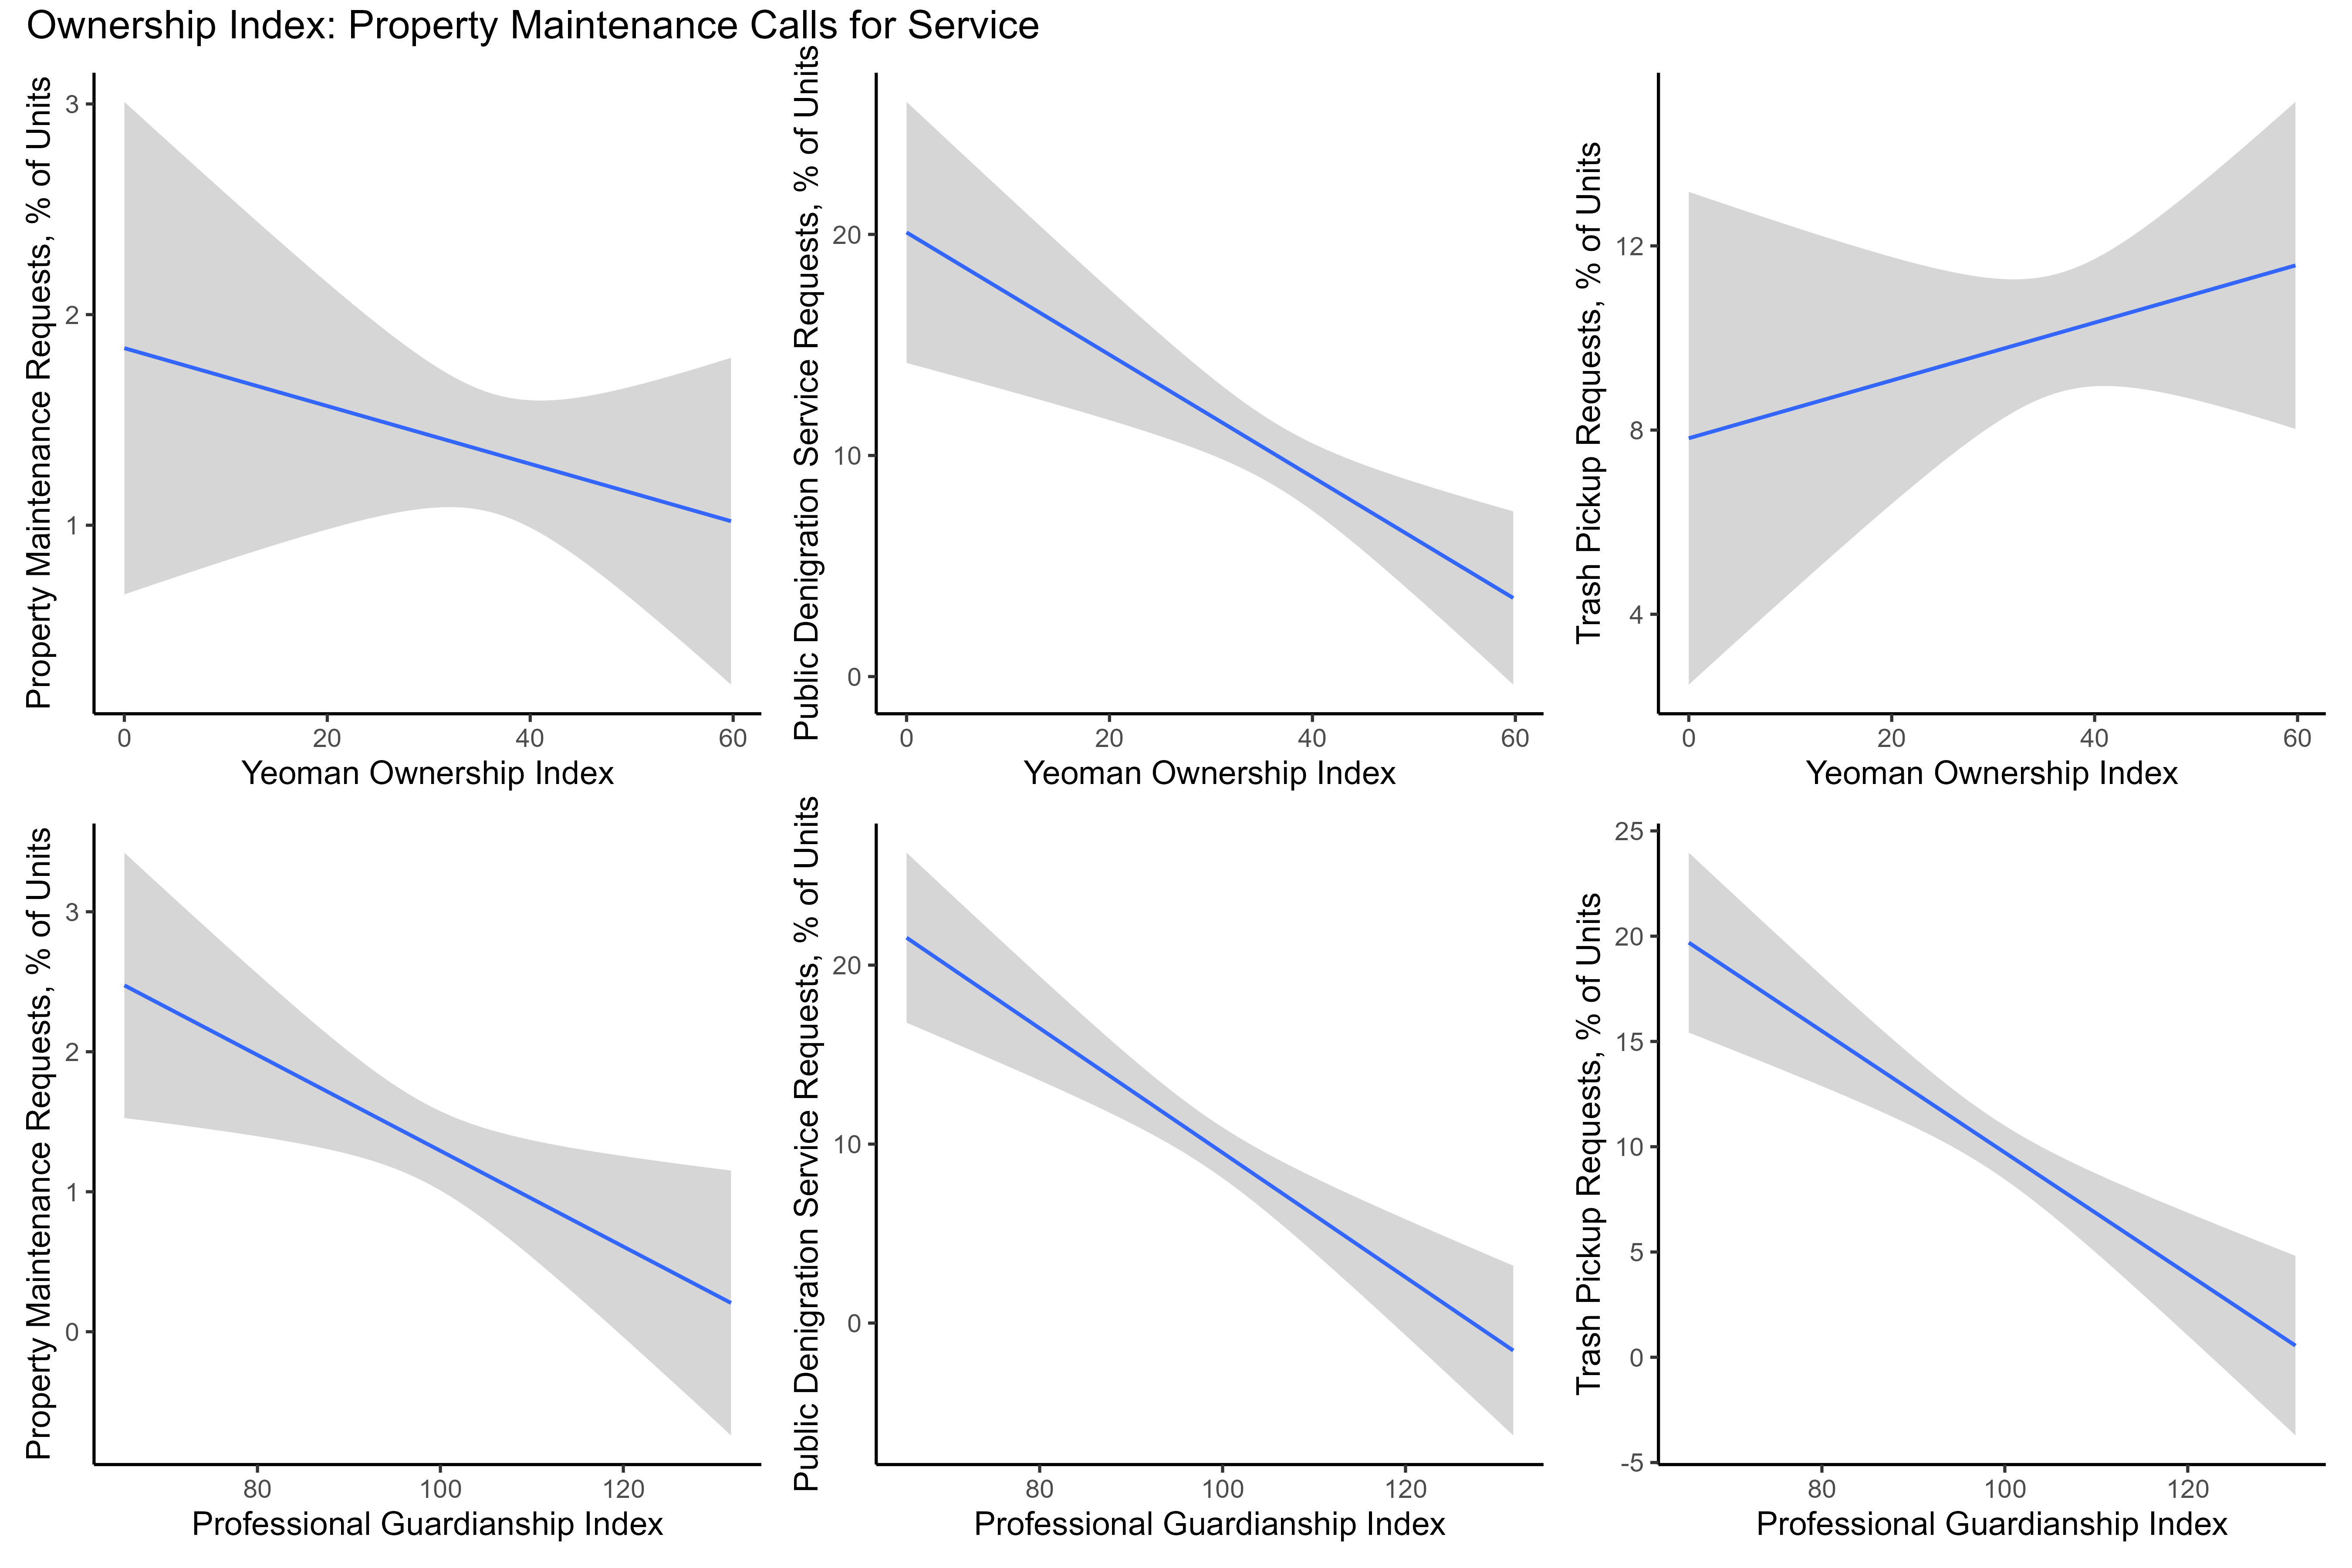
Plots showing how the Yeoman Ownership, Professional Guardianshipeach predict property-related service requests through Cityline.


Inspiration
As identified in the Syracuse Housing Study and Strategy, one component of safe, quality Healthy Housing is active ownership and maintenance in the housing stock. I attempted to translate this fuzzy concept into a concrete, quantitative metric—taking heed of the Syracuse Housing Study's principle to look beyond individual properties and "use blocks or groups of blocks as the core units of implementation."
What it does
To help measure progress towards Syracuse Housing Strategy Outcome 3 ("The share of residential properties that show evidence of active ownership and investment"), I used Open Data to generate an annual Active Ownership index in each Census Block Group. This index is a composite of 2 component indices: a Yeoman Ownership index and a Professional Guardianship index.
How we built it
First, I read the Housing Study and Housing Strategy documents, as well as an abundance of press reports, about Housing in Syracuse, to build intuitions about the housing problems the city is facing.
Next, I played with the data. I created a panel of properties in Syracuse using the annual assessment data and merged these data with property-level code violations and building permits. I conducted exploratory data analyses investigating the relationships between individual property characteristics and indicators of guardianship or lack of guardianship including building permits and code violations indicative of property maintenance issues.
Then, I spatially joined all datasets and aggregated to the Census Block Group Level, and combined this with ServiceLine requests and Crime data aggregated to the Census Block Group Level. Finally, I used Principal Component Analysis to generate 2 components that explained most of the variation in these indicators of active ownership and investment in residential property.
I used R (including several packages/APIs, especially sf and tidycensus) to conduct the data wrangling, analysis, and visualization. Code to organize data and reproduce analyses/Figures are included in the Dropbox repository linked below.
Challenges we ran into
As usual, the data is messy! The years of data is not consistent for all variables (assessments data has a long history. Permits data is from 2012; code violations from 2017; service requests from 2021. Crime data mostly lacks spatial information prior to 2023. Spatial information for condominium parcels is missing. Spatial information was not always as granular as I had hoped (e.g., crime data, although it contains an address and geographic coordinates, is clearly aggregated to the block level, though I couldn't see that documented).
Property ownership data is always a little tricky, since the same landlord might conceal their ownership using multiple, different LLCs.
In press reports, tax delinquency was a common feature of negligent landlords. Unfortunately, this data was not available in the Open Datasets. I sunk some time into seeing how I might get it from other sources, like the County website but was unsuccessful. I'd love to incorporate it!
Accomplishments that we're proud of
I synthesized several different datasets together into a useful panel dataset that others might use too. I used these data to generate an index that uncovered new insights into property guardianship in Syracuse.
And the index passes the sniff test - it correlates well with "related concepts" that were not used to generate it, such as crime and Syracuse Cityline Requests related to unmaintained properties.
What we learned
Active ownership in a group of census blocks can be modeled well as two underlying components that are generated using data from building permits, code violations, and property ownership information.
Component 1: Yeoman Homeownership
The first component maps to owner-occupants who care for an invest in their properties -- we can call this first component *yeoman homeownership -- it maps most heavily onto claiming an owner-occupancy tax exemption and an owner residing in Syracuse. It is also correlated with pulling more building permits (including residential remodeling permits) and negatively with vacancies, code violations for exterior building maintenance issues, and ownership by landlords (small or large). Aggregating to the neighborhood level, the neighborhoods scoring highest on Professional Guardianship are Meadowbrook, Strathmore, and Winkworth -- places characterized by high owner occupancy rates, a predominance of single-family homes, and well-maintained properties.
Component 2: Professional Guardianship
The second component maps to large landowners who professionally care for their properties (on the one hand) and small, less professional landowners (slumlords) who tend to neglect their properties (not pull permits, receive code violations for property issues). Aggregating to the neighborhood level, the neighborhoods scoring highest on Professional Guardianship are University Hill, Franklin Square, and South Campus -- places characterized by large, professional landlords catering to student renters.
Validating the metrics with external datasets
These indices I generated explain a meaningful amount of variation in other outcomes associated with safe, quality housing. I looked at their relationship between these metrics at the census block group level and (1) assessment values per residential unit (2017-2023) (2) service requests for residential maintenance issues (over 2021-2023) and (3) violent and property crime (in 2023). Both Yeoman Homeownership and Professional Guardianship were positive and significant predictors of higher assessed values and were negative/significant predictors of service requests and crime.
Broadly speaking, the combined index at the neighborhood level is also highly correlated with the 2022 Syracuse Housing Study's windshield survey of housing conditions ("Share of Healthy and Unhealthy Properties in Syracuse Neighborhoods"). The neighborhoods scoring high (and low) on the index I generated are similar as those with many (or few) properties in good condition.
What's next for Measuring Active Ownership and Investment
One insight from my project is that "professionalization" of landlords is a meaningful component of property investment across neighborhoods. I conceptualize landlord professionalization based on the share of "large" (owning 20+ residential units) and "small" (owning more than 1 but less than 10 residential units) landlords operating in each Census Block Group, using property ownership as recorded in Syracuse Assessment records and the number of residential units per property as recorded in Parcel Data. This limits the analysis to property ownership within Syracuse. It's possible that the extent to which property owners own properties elsewhere adds additional information here. I hope to use the RealEstate.com API to better measure large and small landlords (and property ownership more generally).
I would also love to identify additional data sources (e.g. tax delinquency, fires, calls for service; cash buyers) that can identify problem properties. Finally, American Community Survey Block Group demographics seems like an additional untapped data source.
It would be interesting to explore how actions taken by the city of Syracuse -- such as Land Bank acquisition and turnover of properties lacking effective guardianship -- impacts the metrics I generated.
Built With
- censusapi
- gis
- r

Log in or sign up for Devpost to join the conversation.