Inspiration
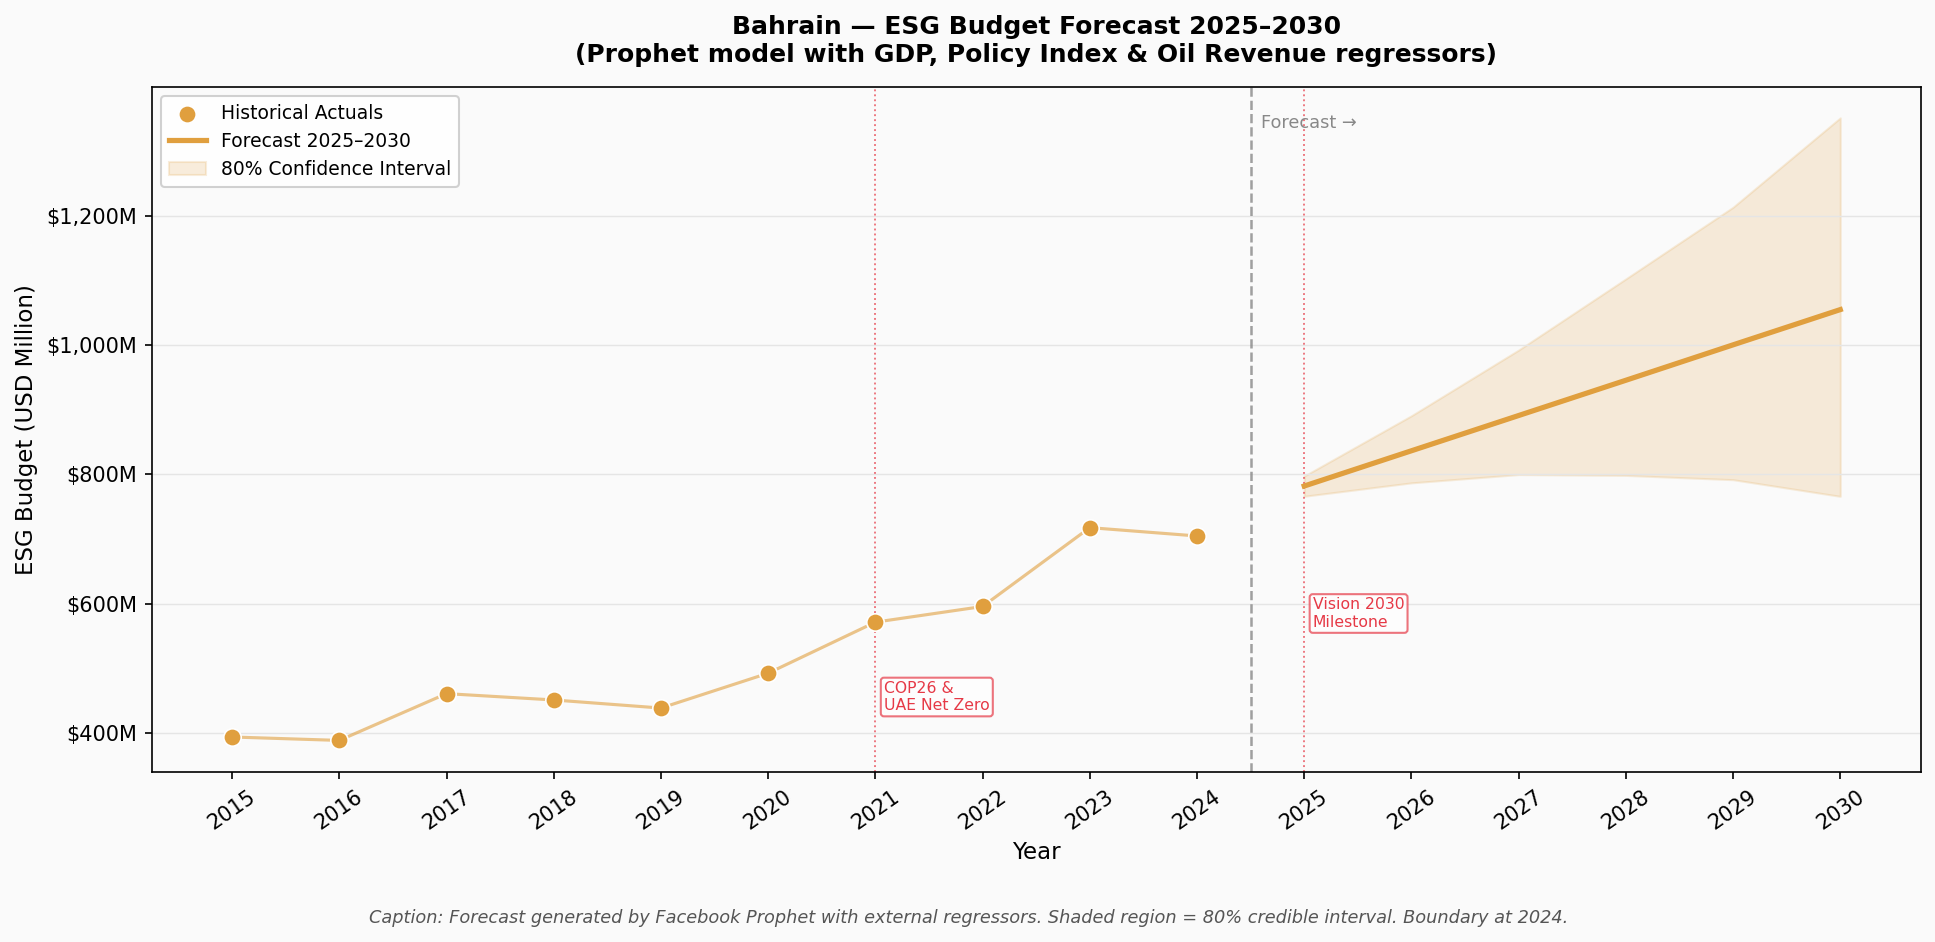
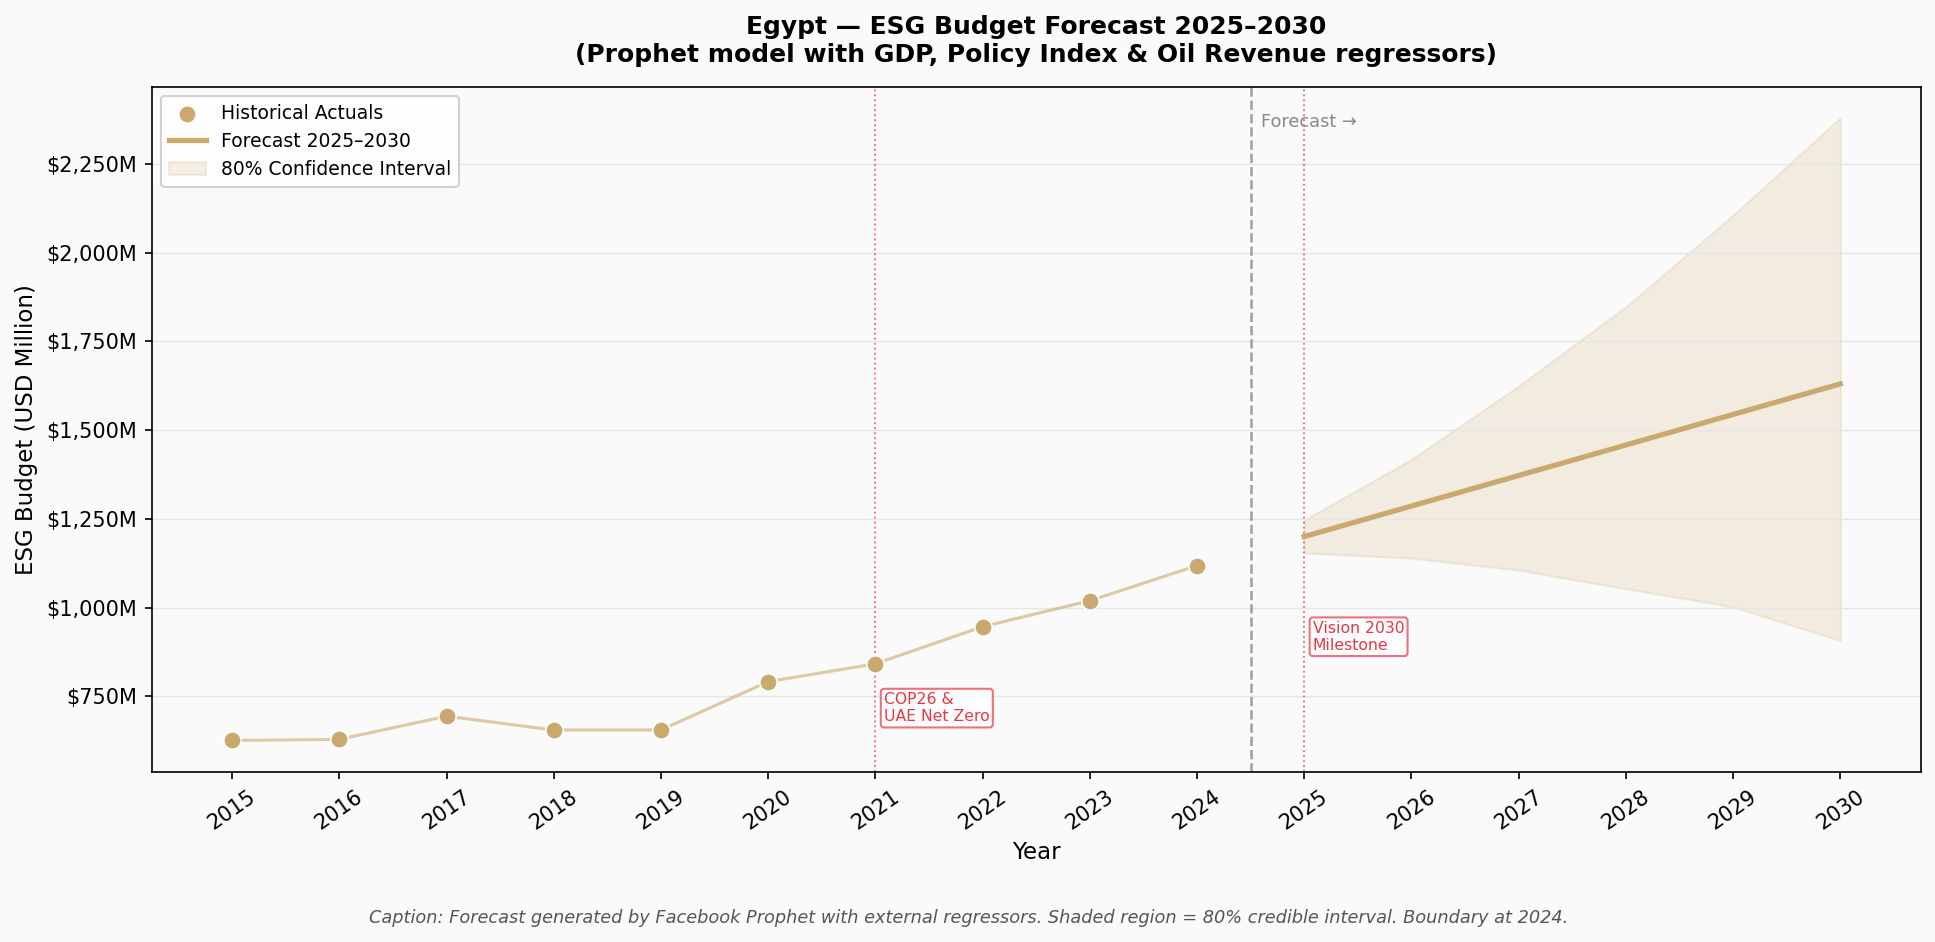
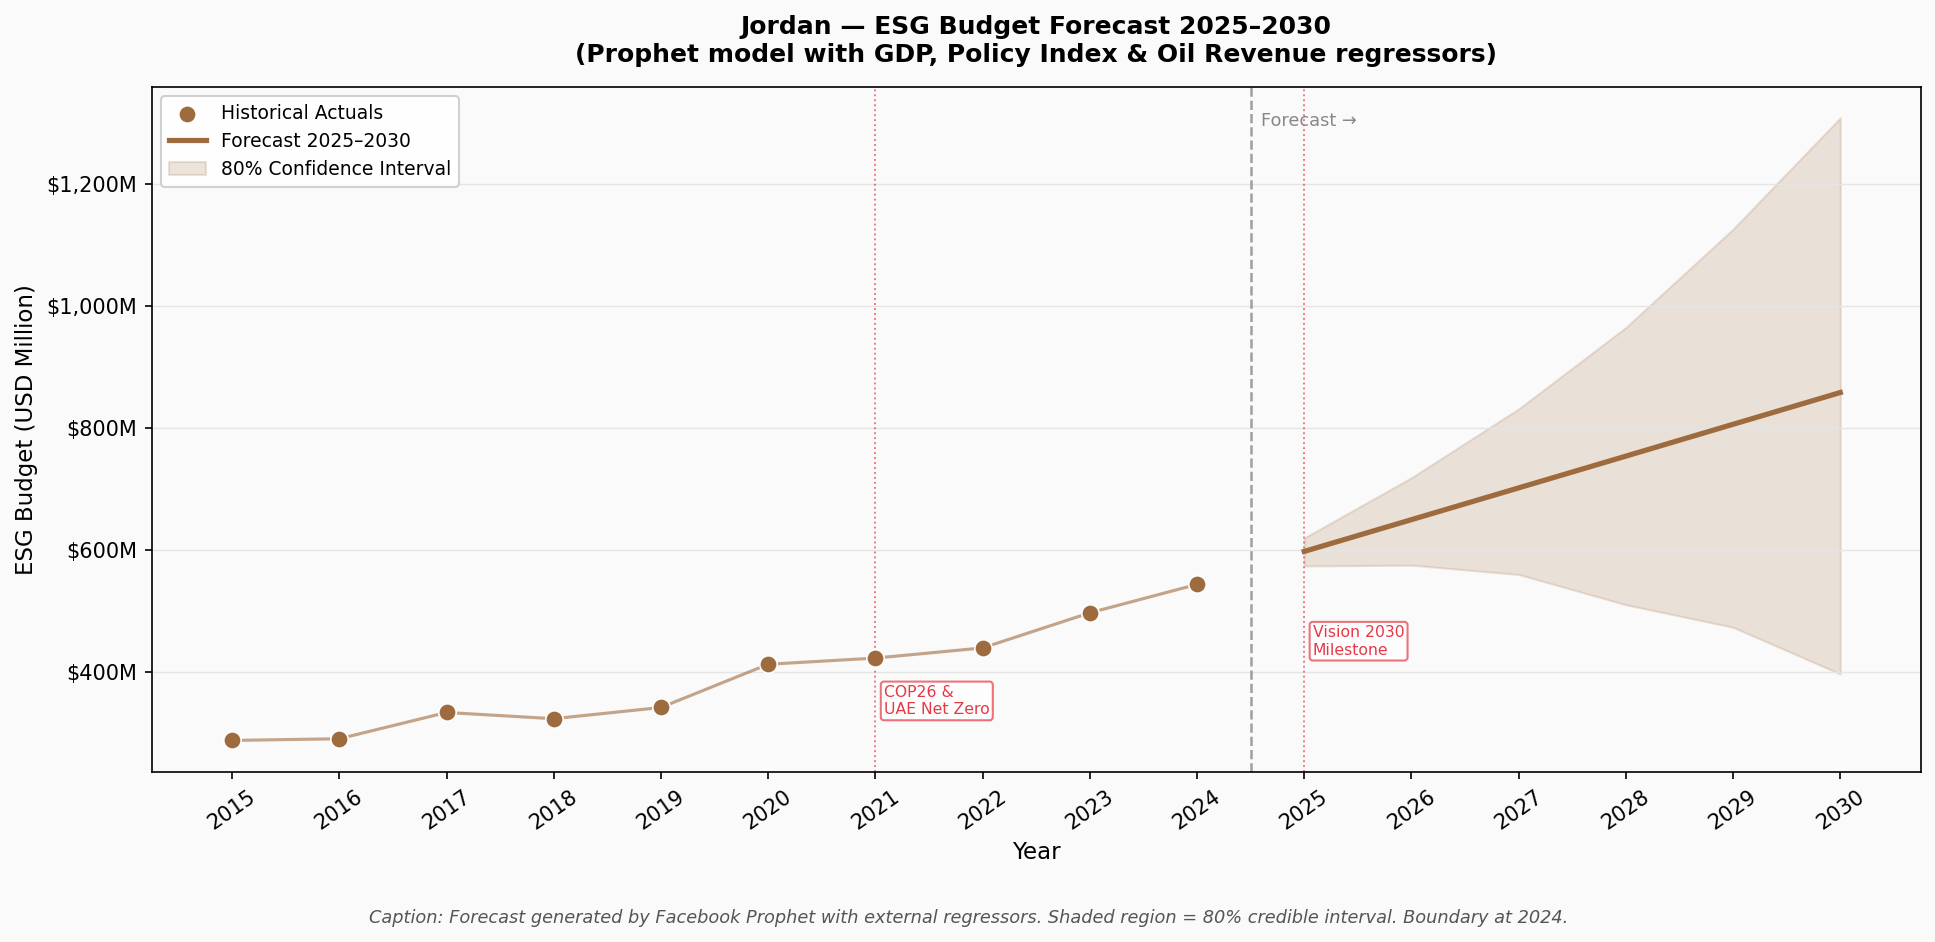
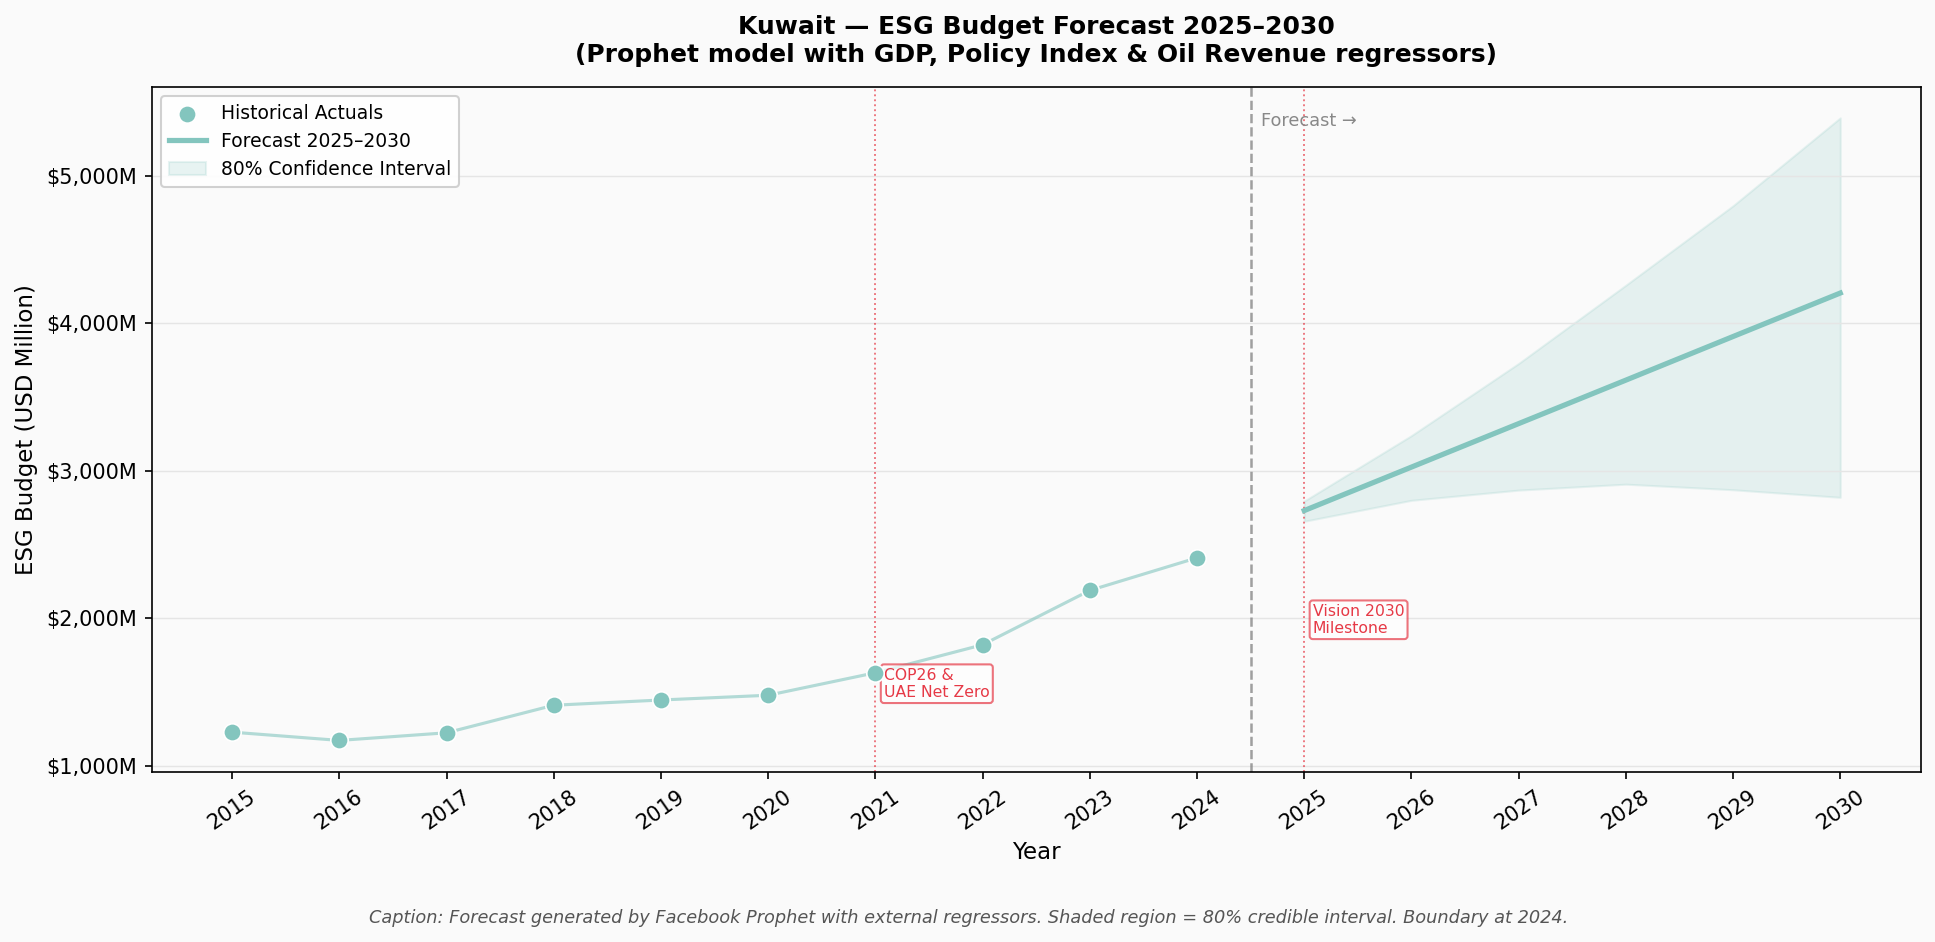
The Middle East is the world's largest hydrocarbon exporter but also one of the regions most exposed to climate change. Saudi Vision 2030, UAE Net Zero 2050, and Qatar National Vision 2030 have committed hundreds of billions to clean energy transition. I wanted to stop reading about it and actually track it with data — country by country, sector by sector, year by year.
What it does
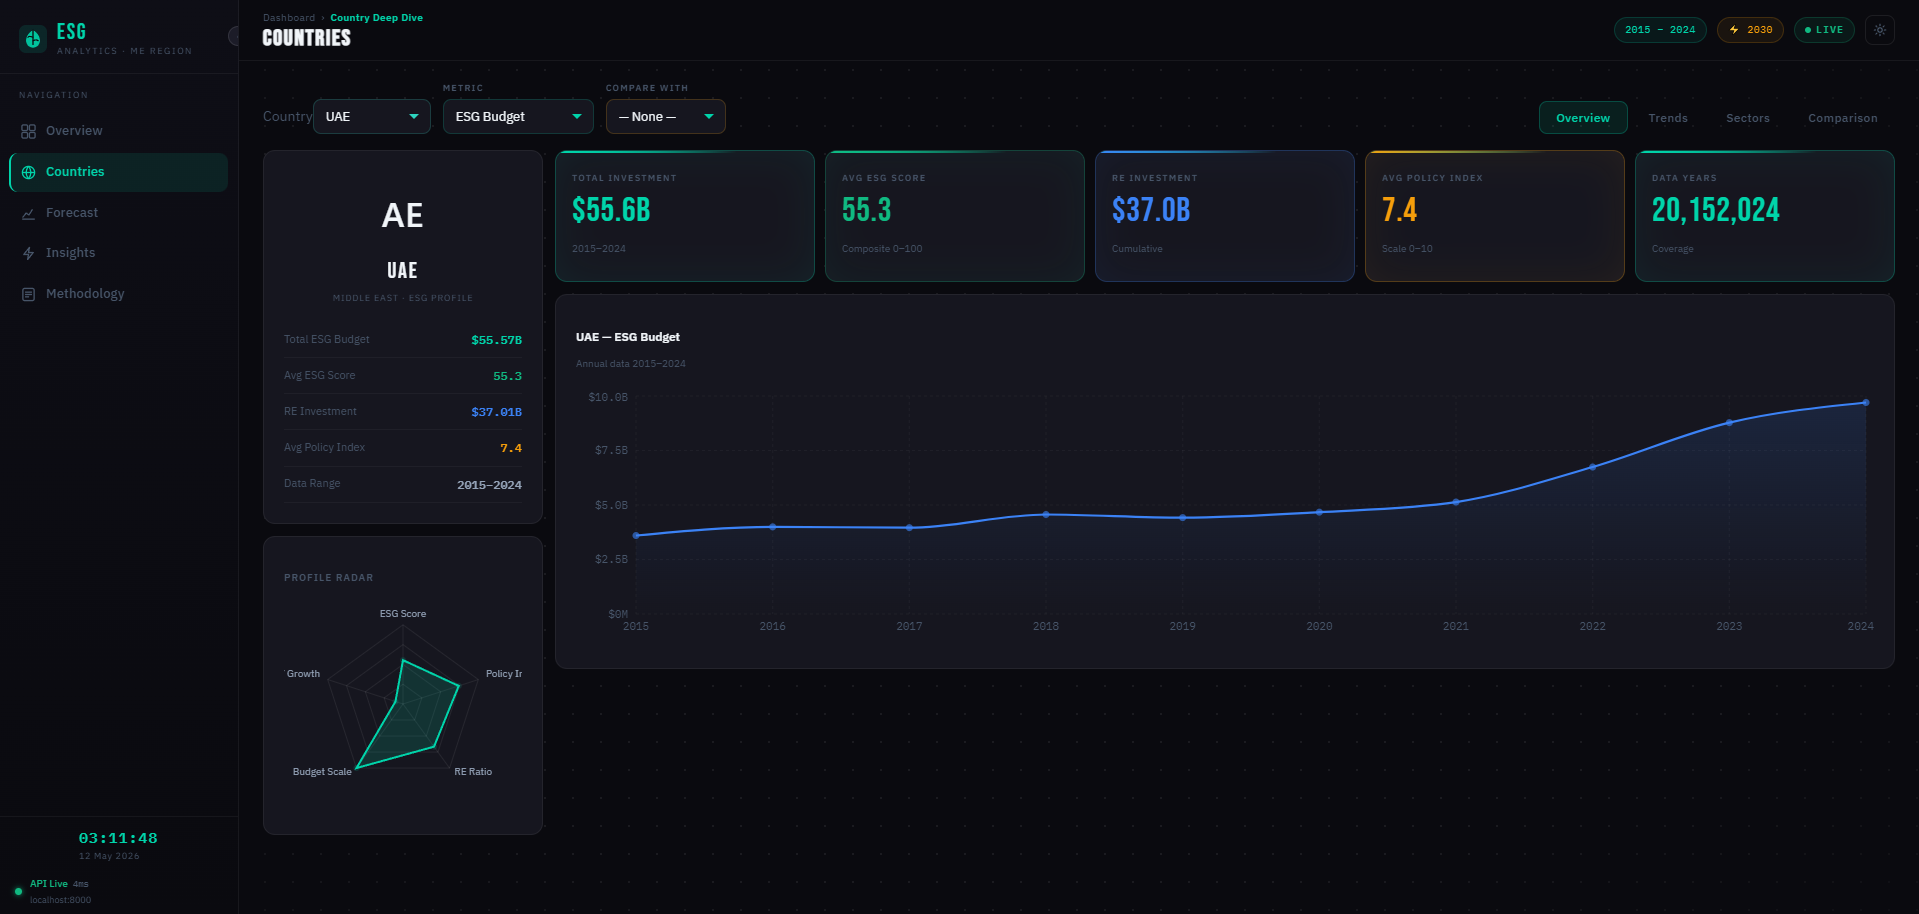
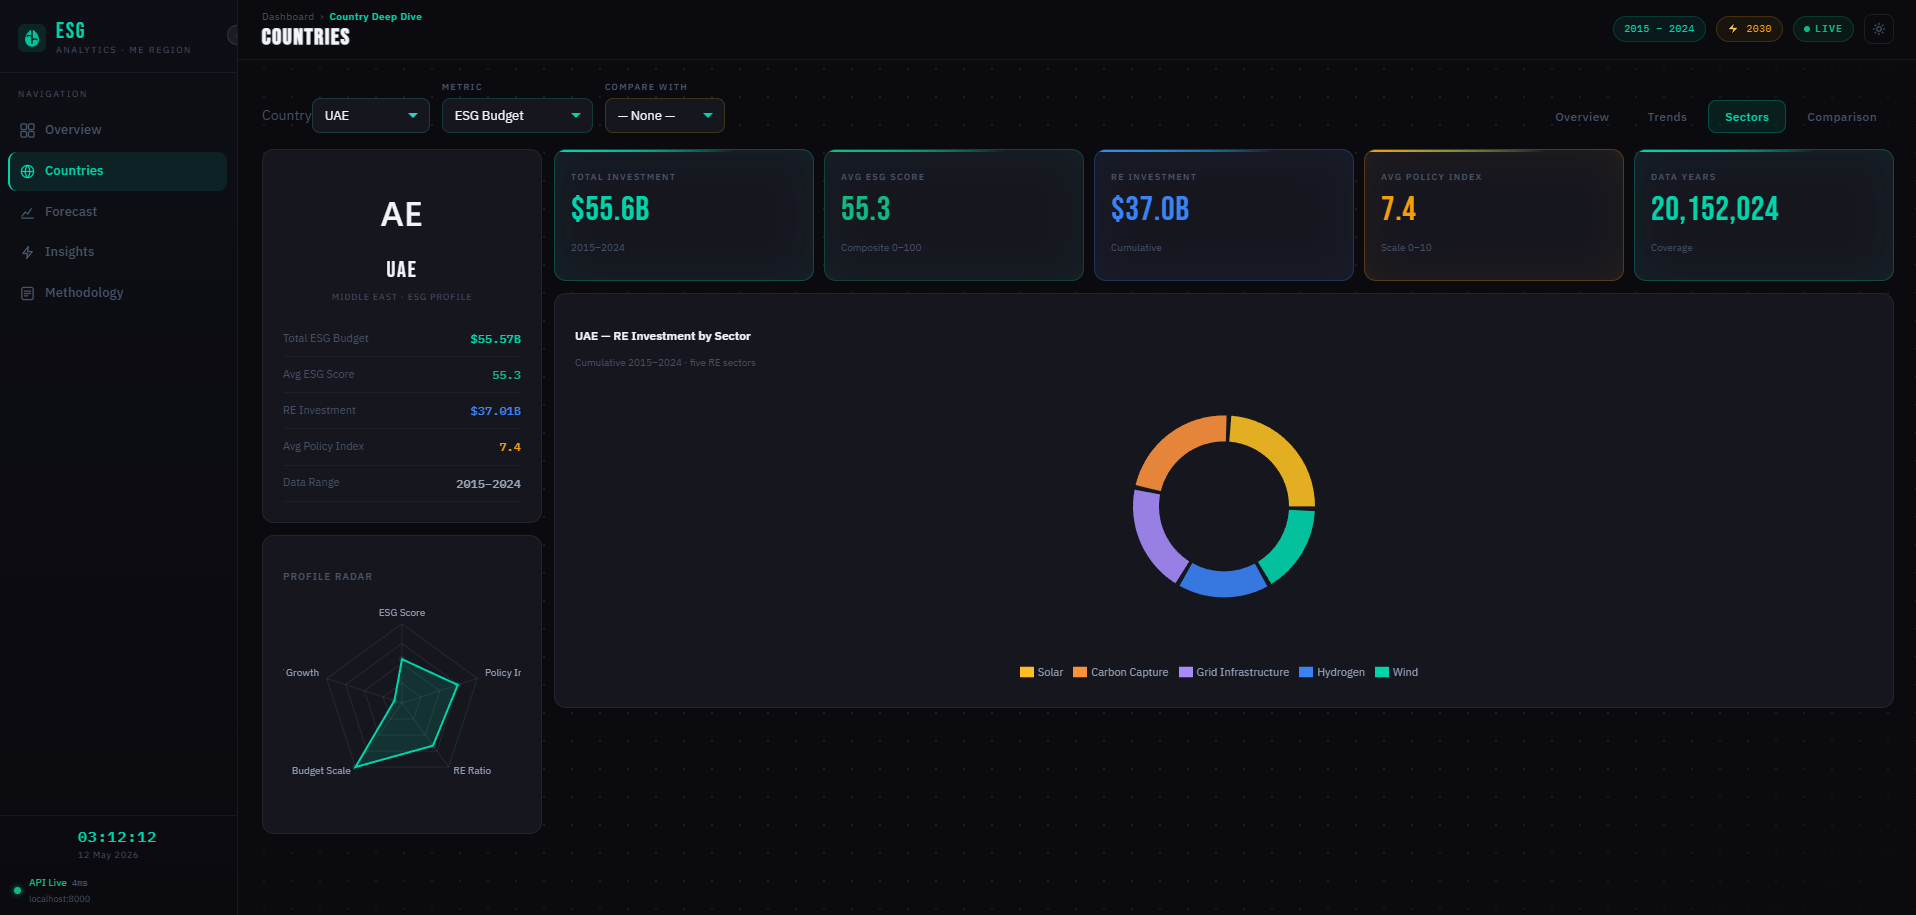
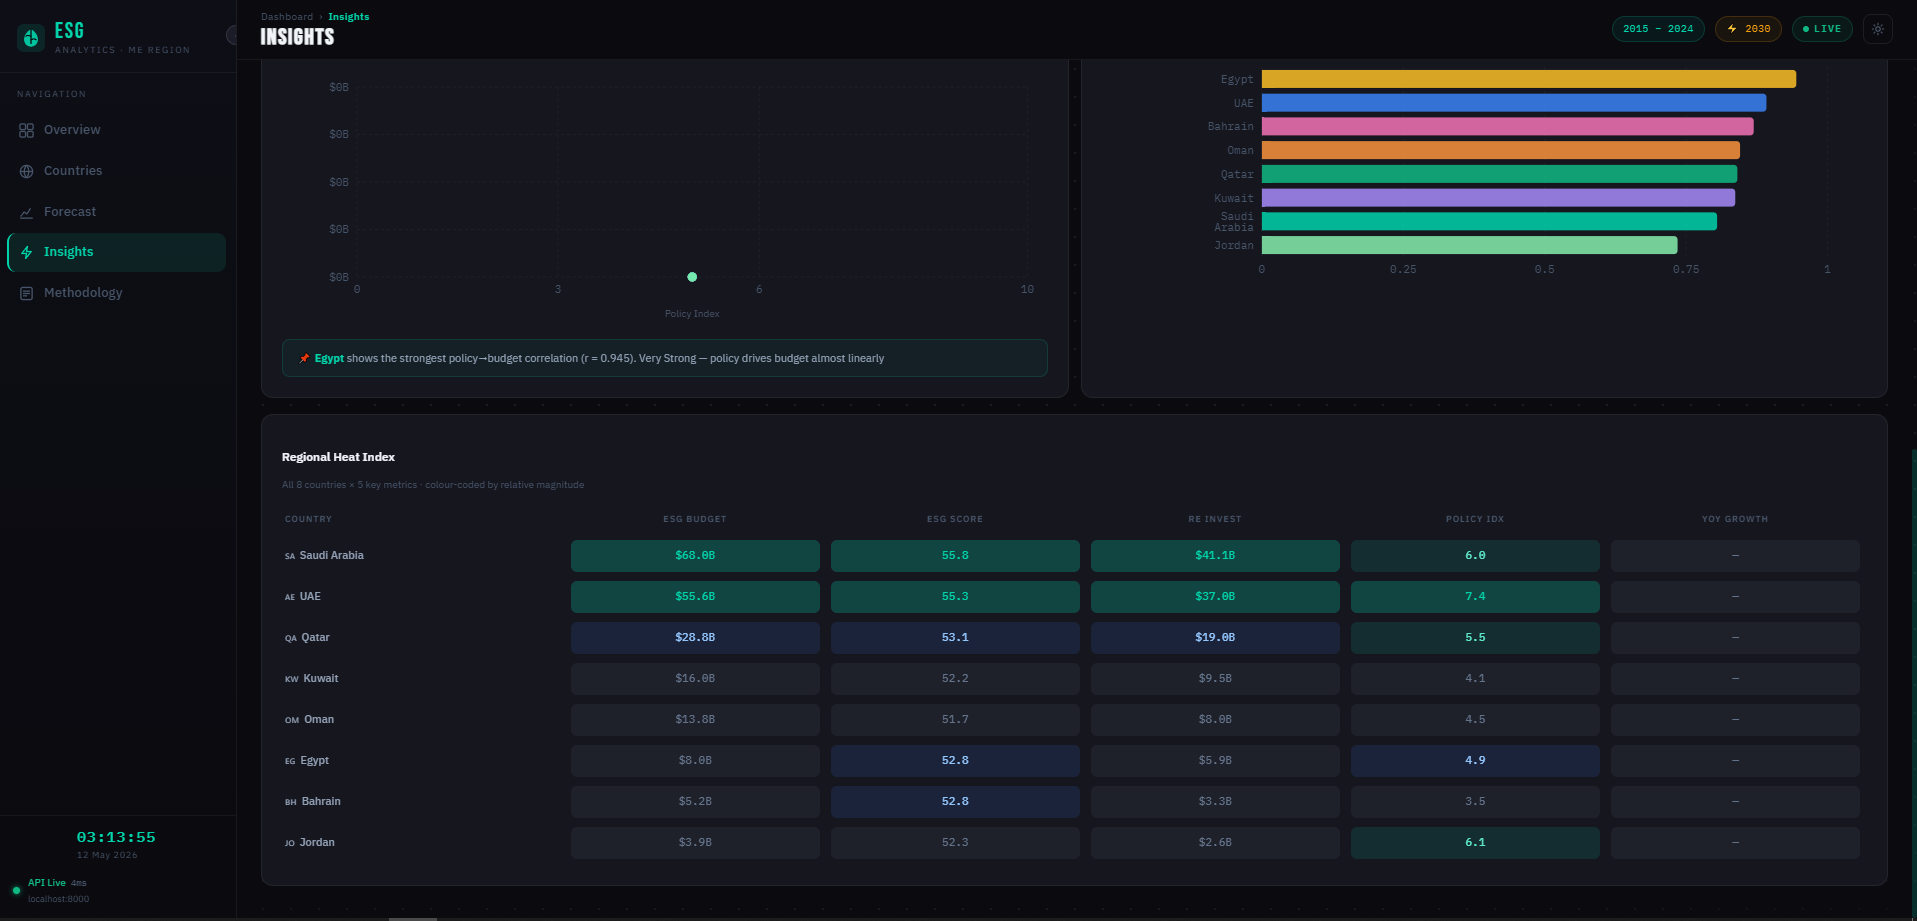
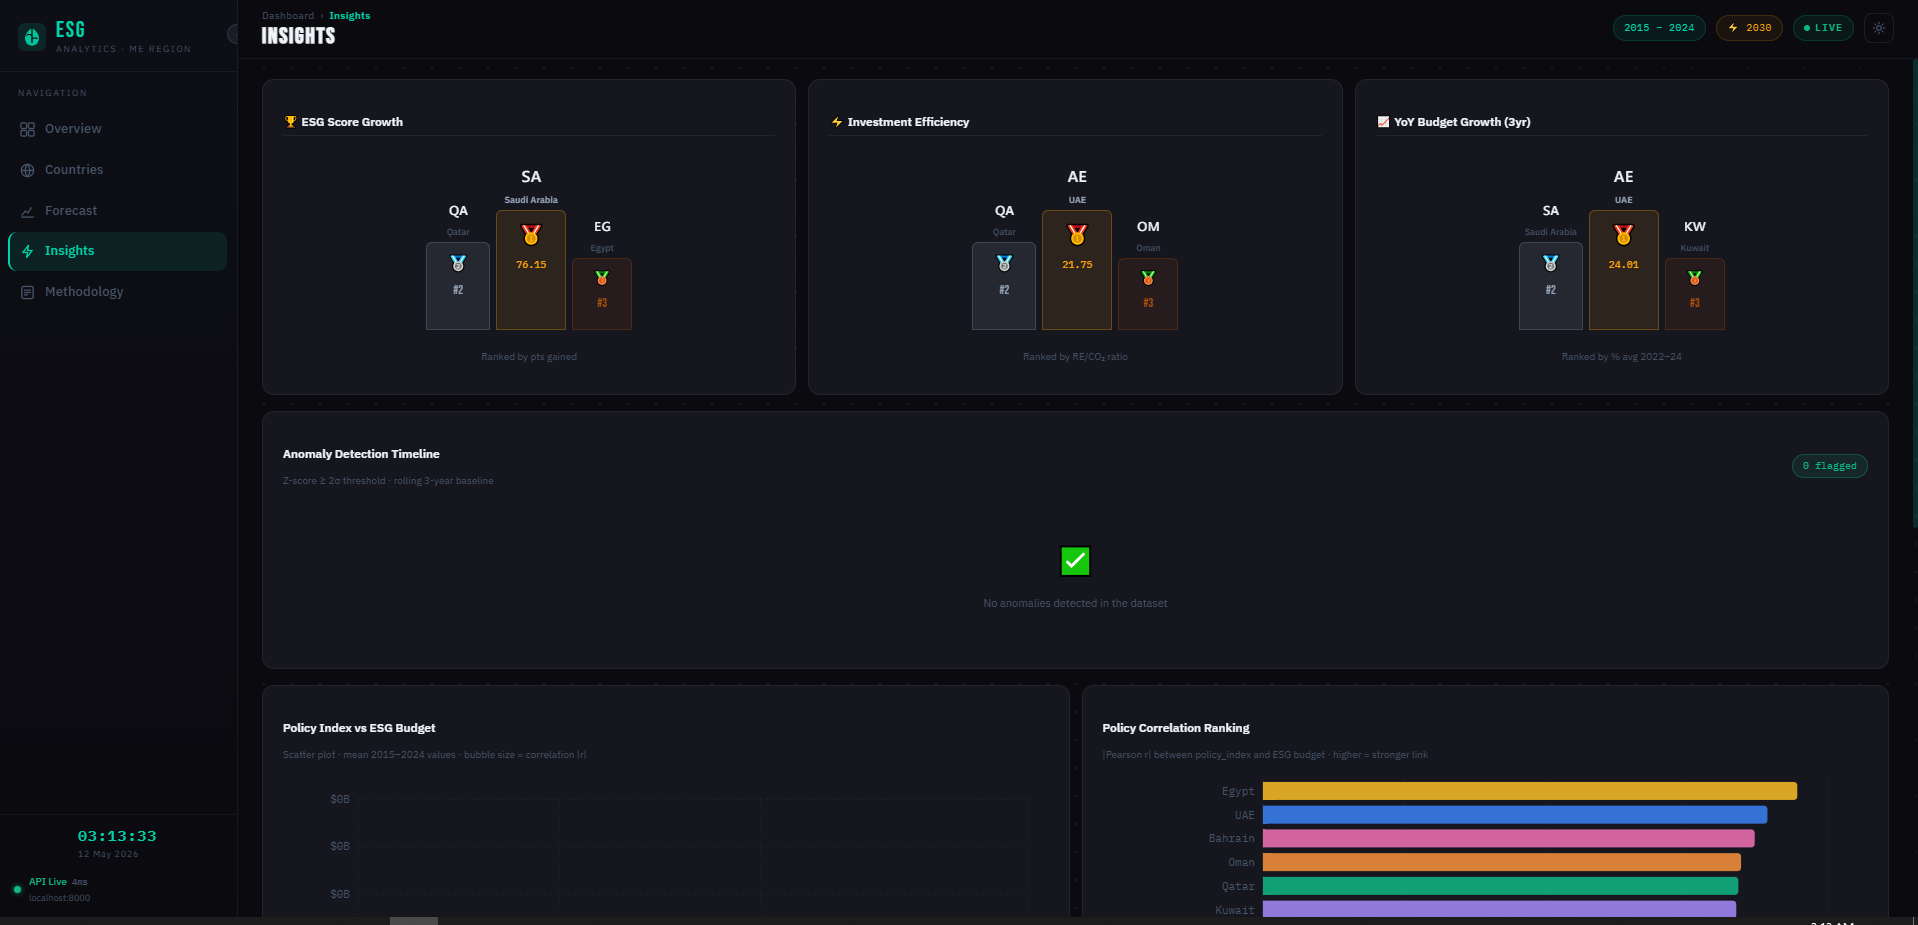
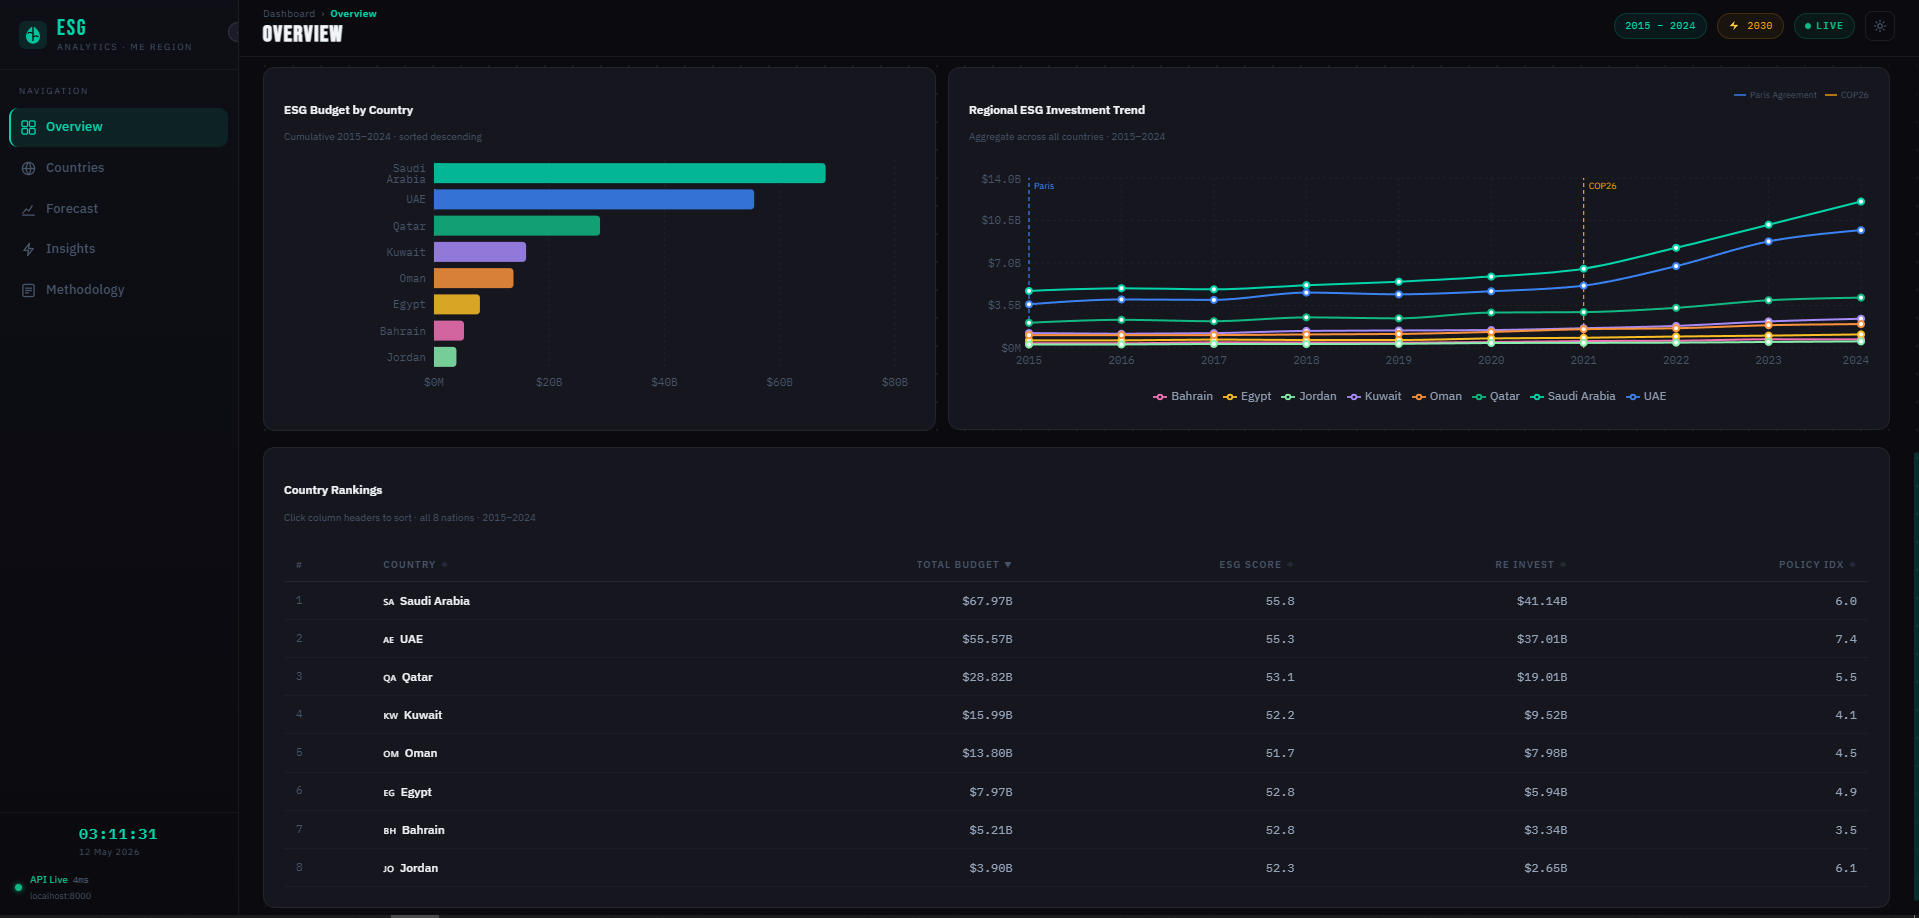
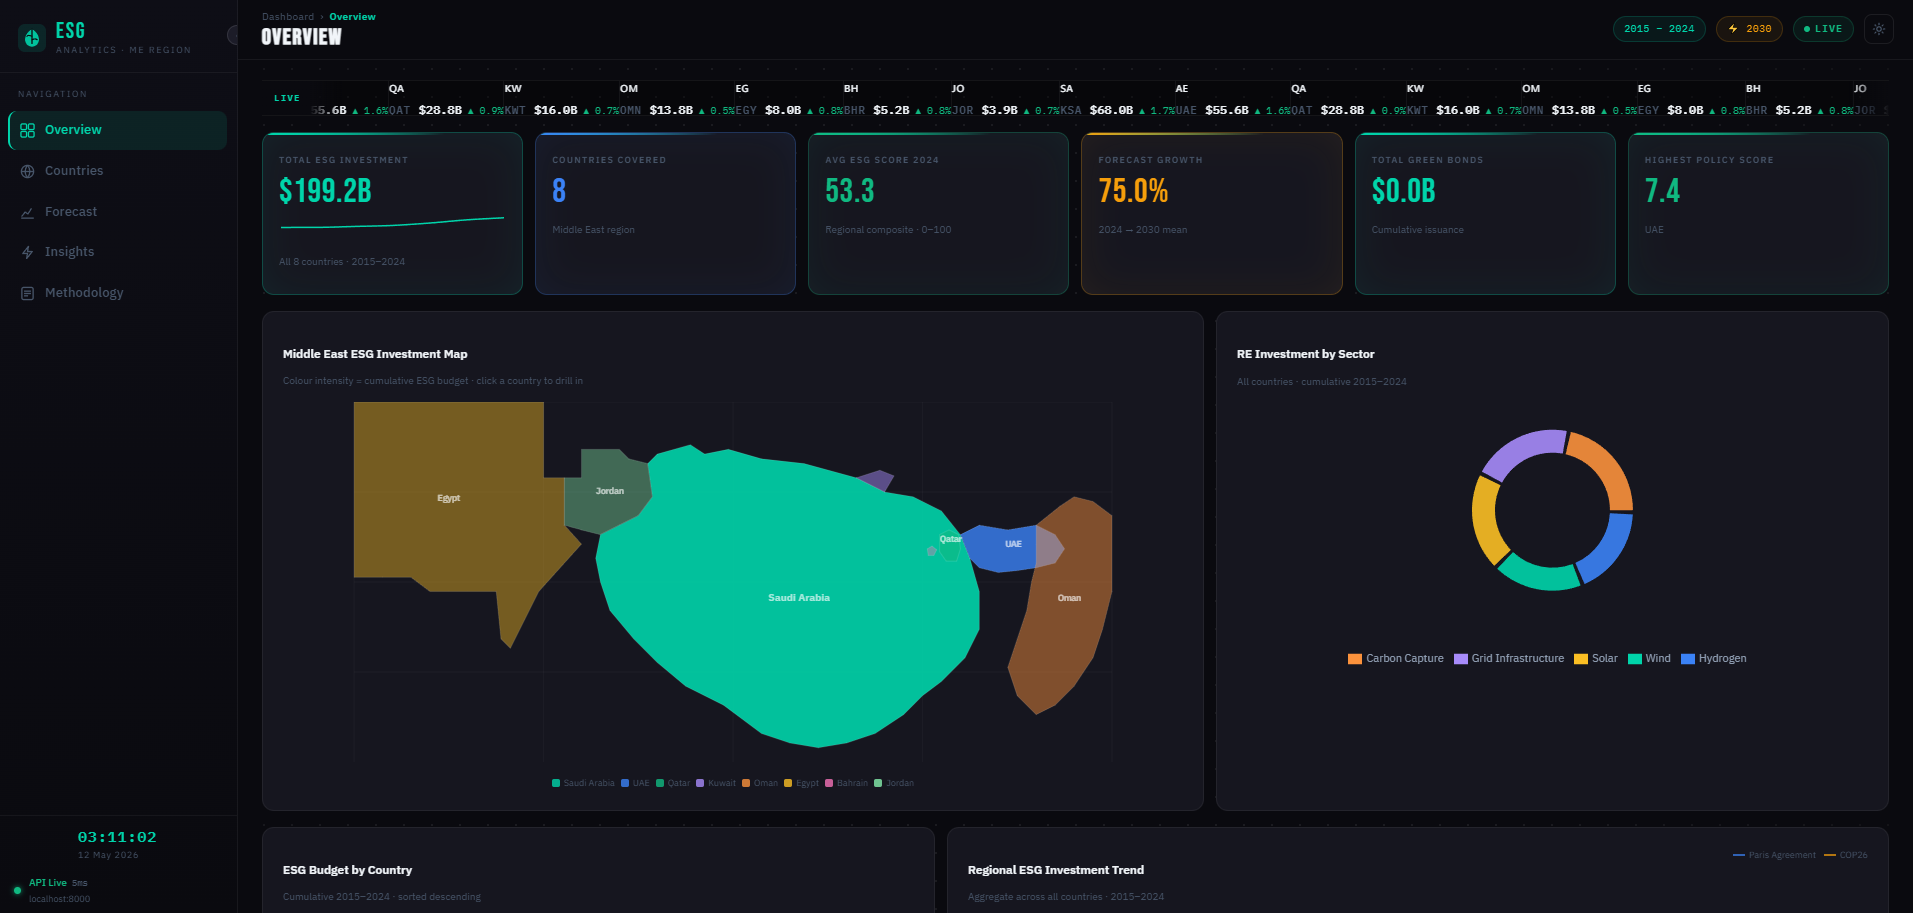
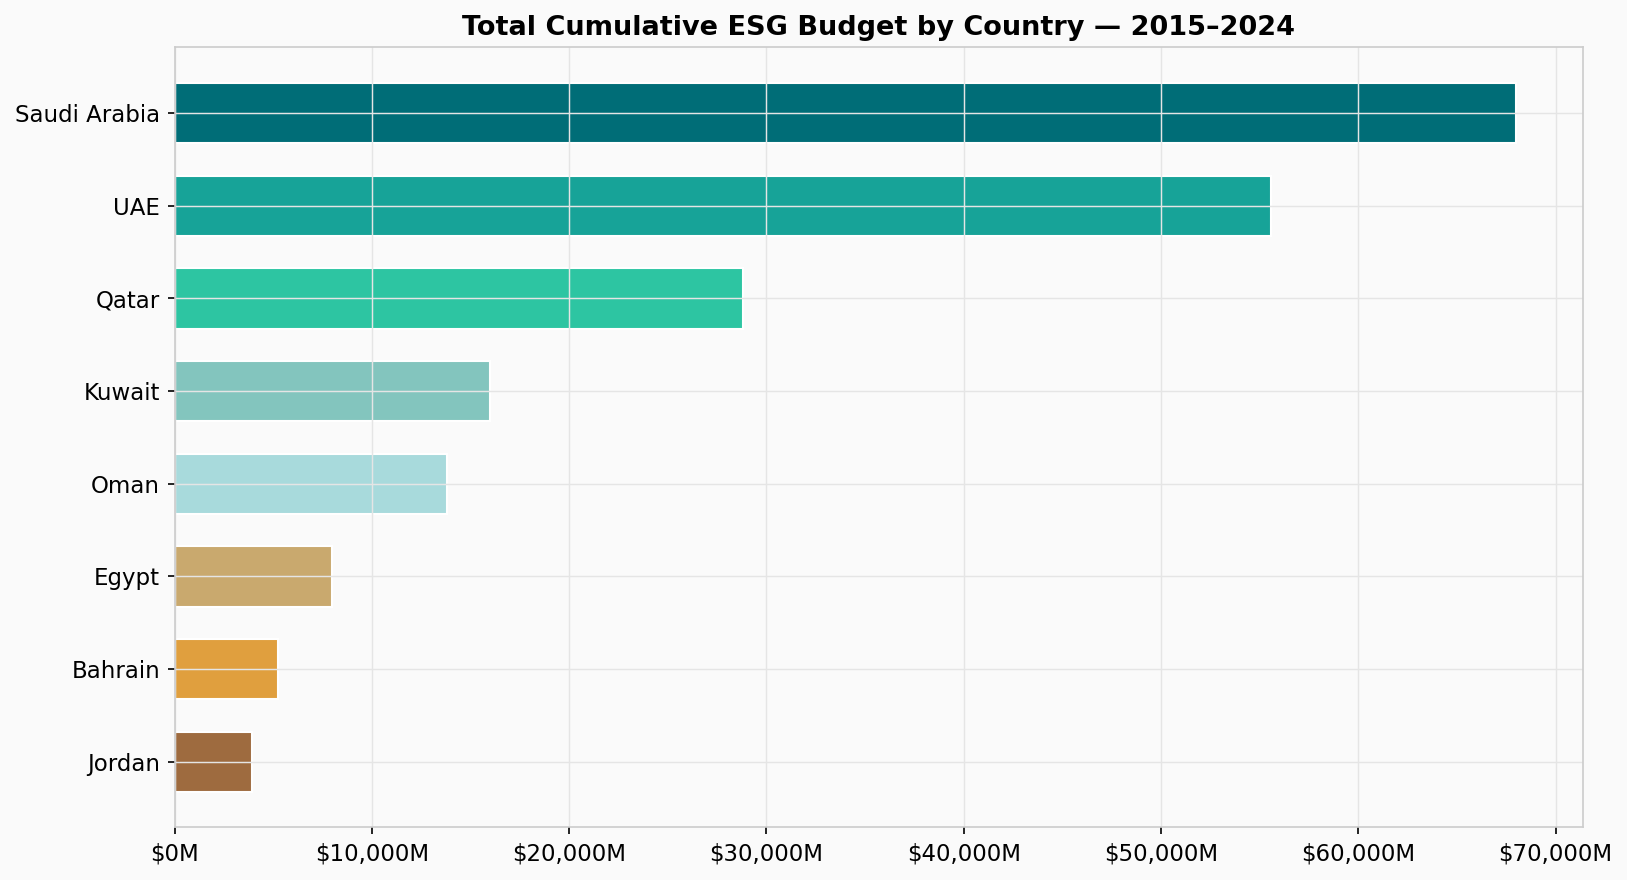
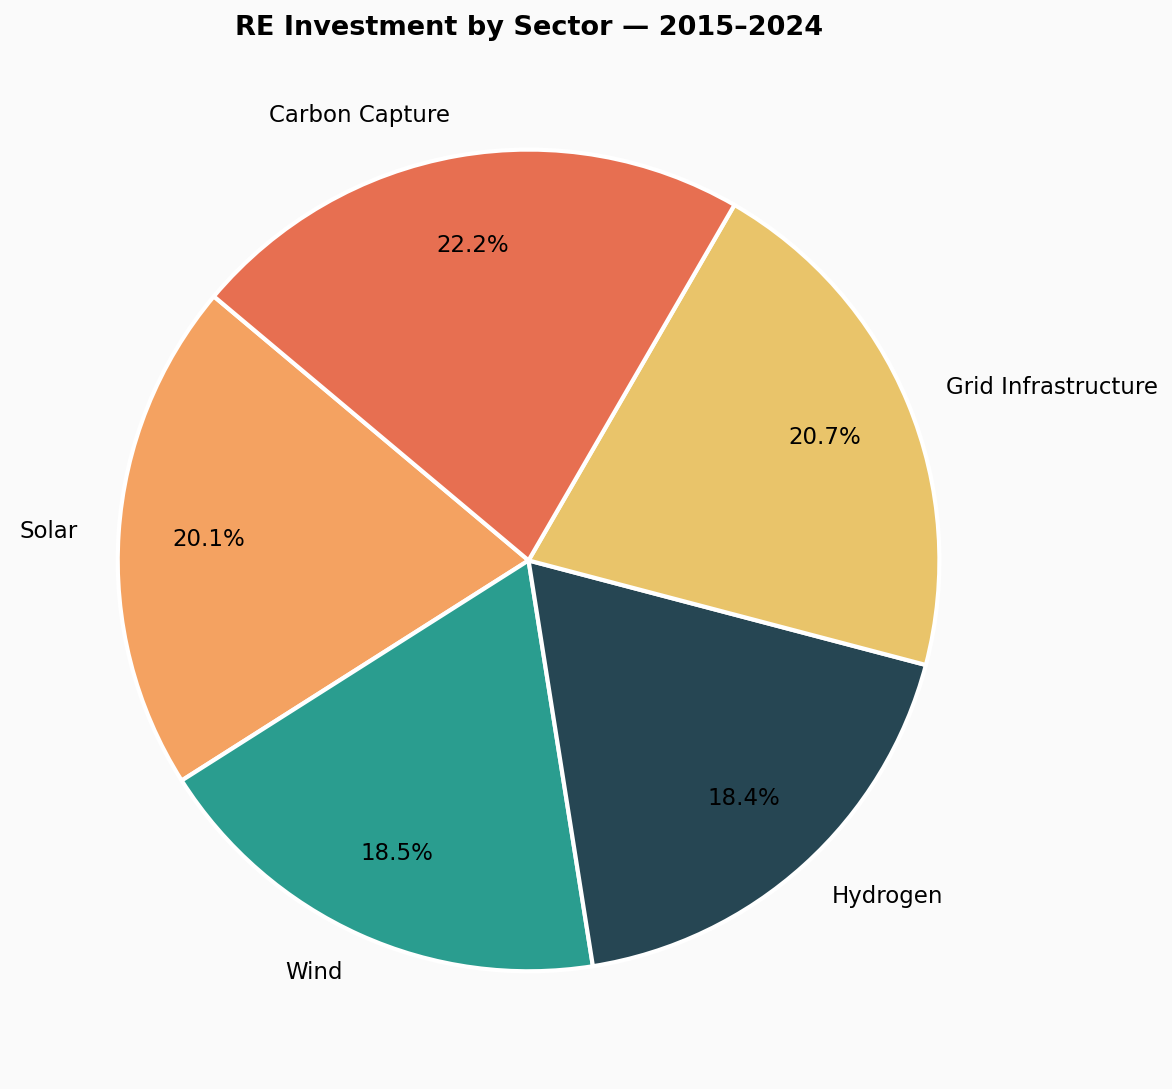
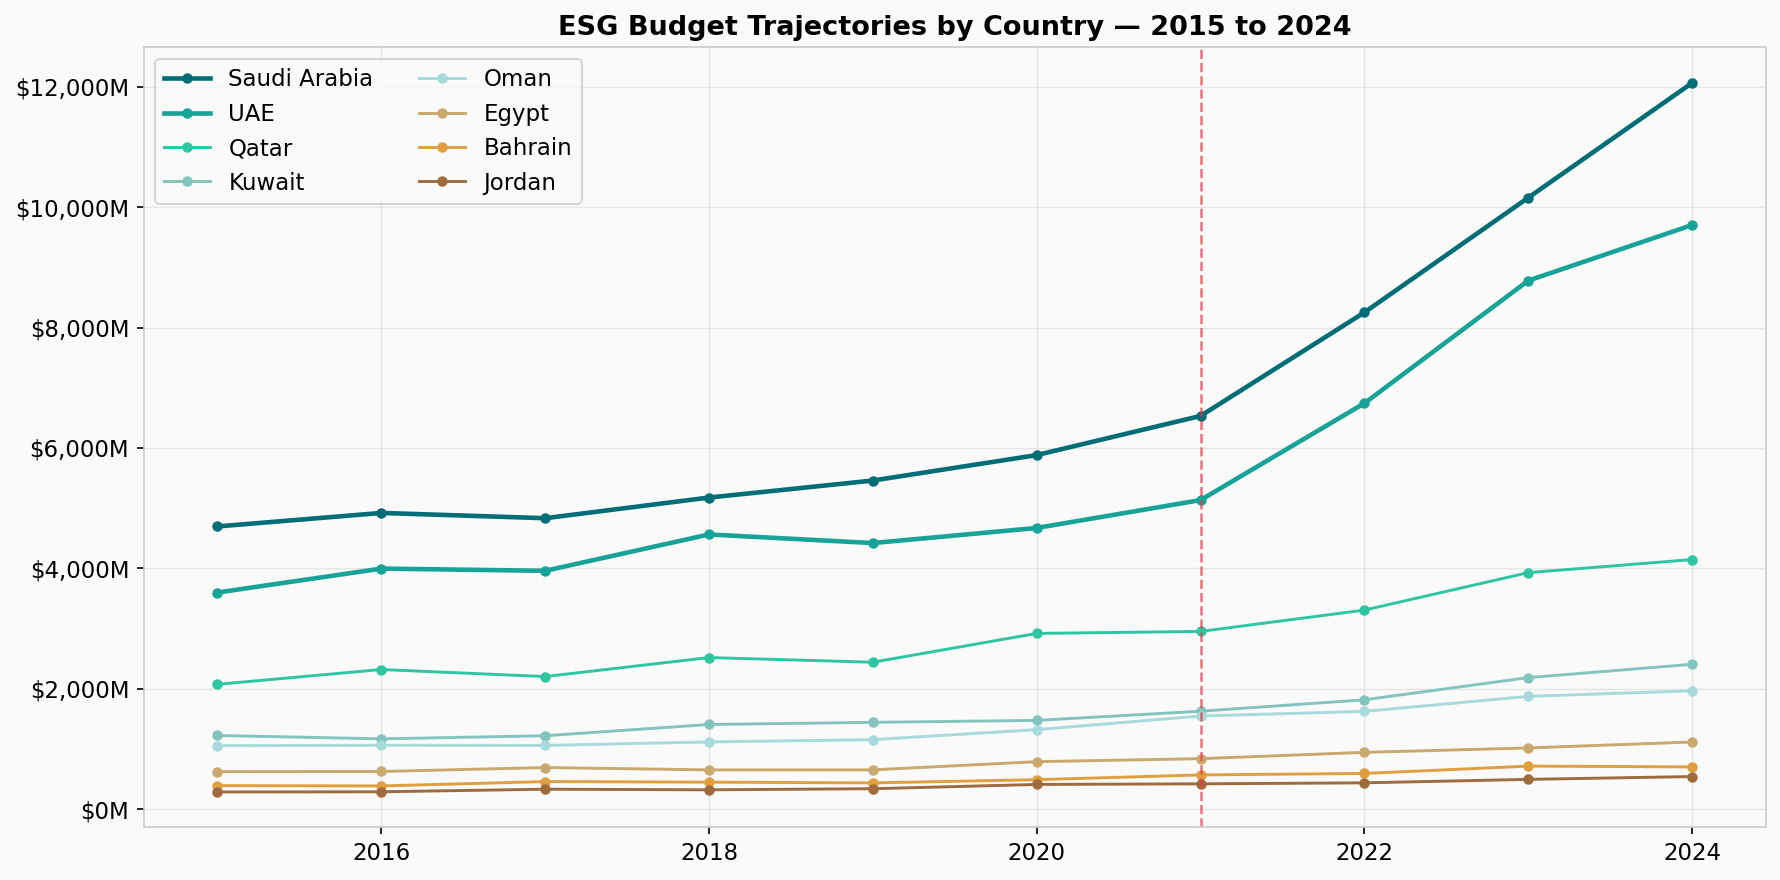
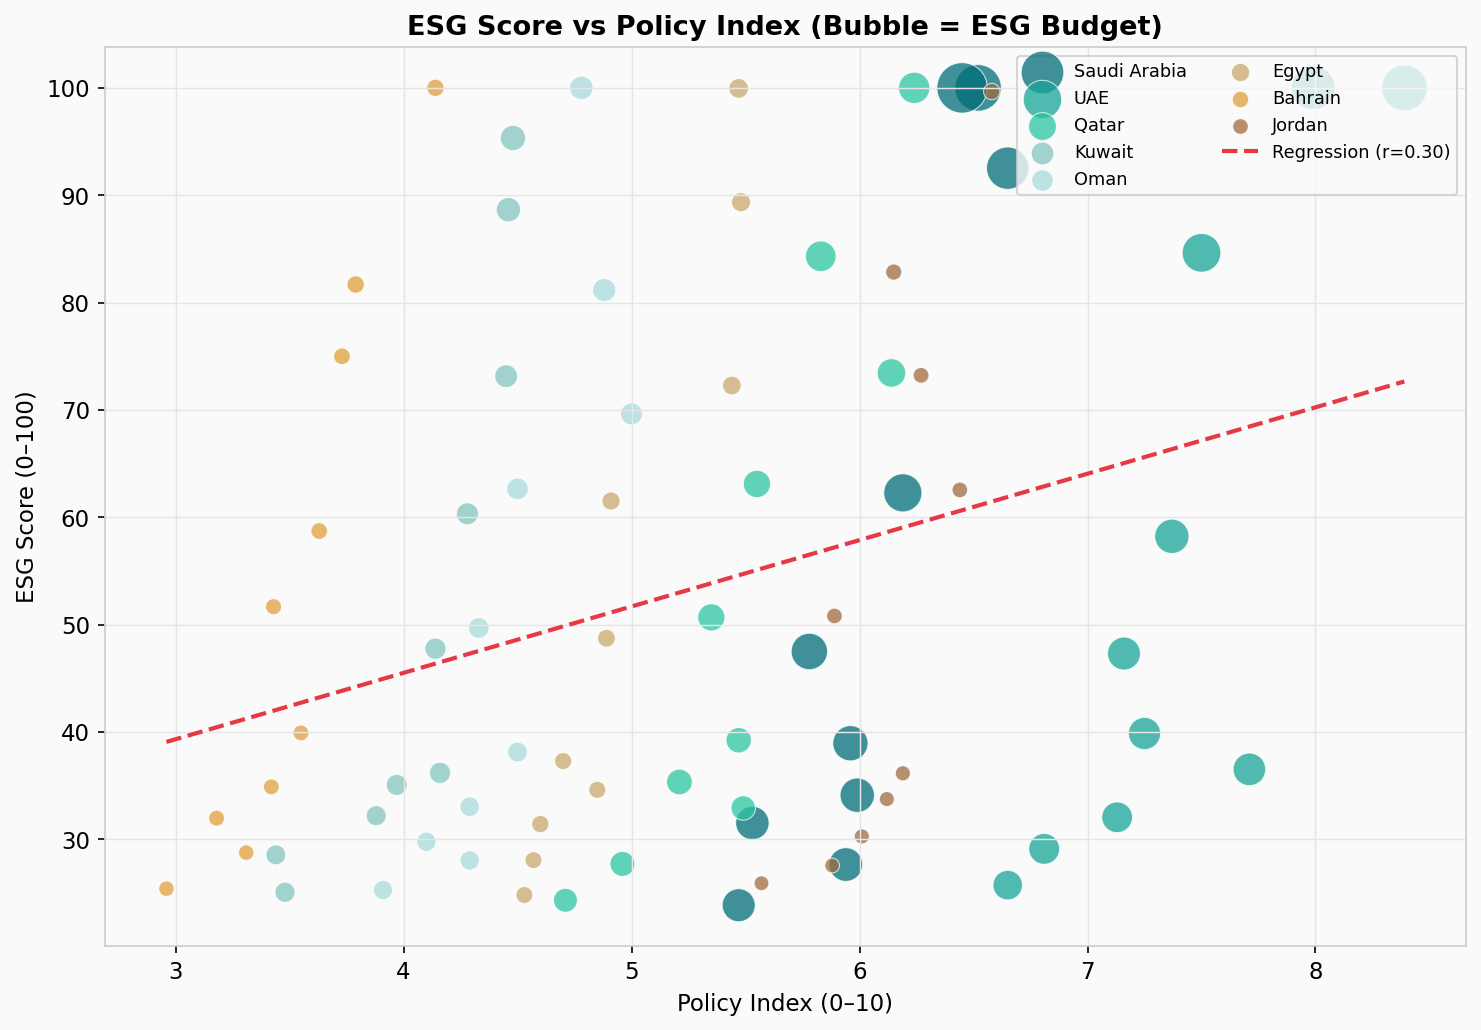
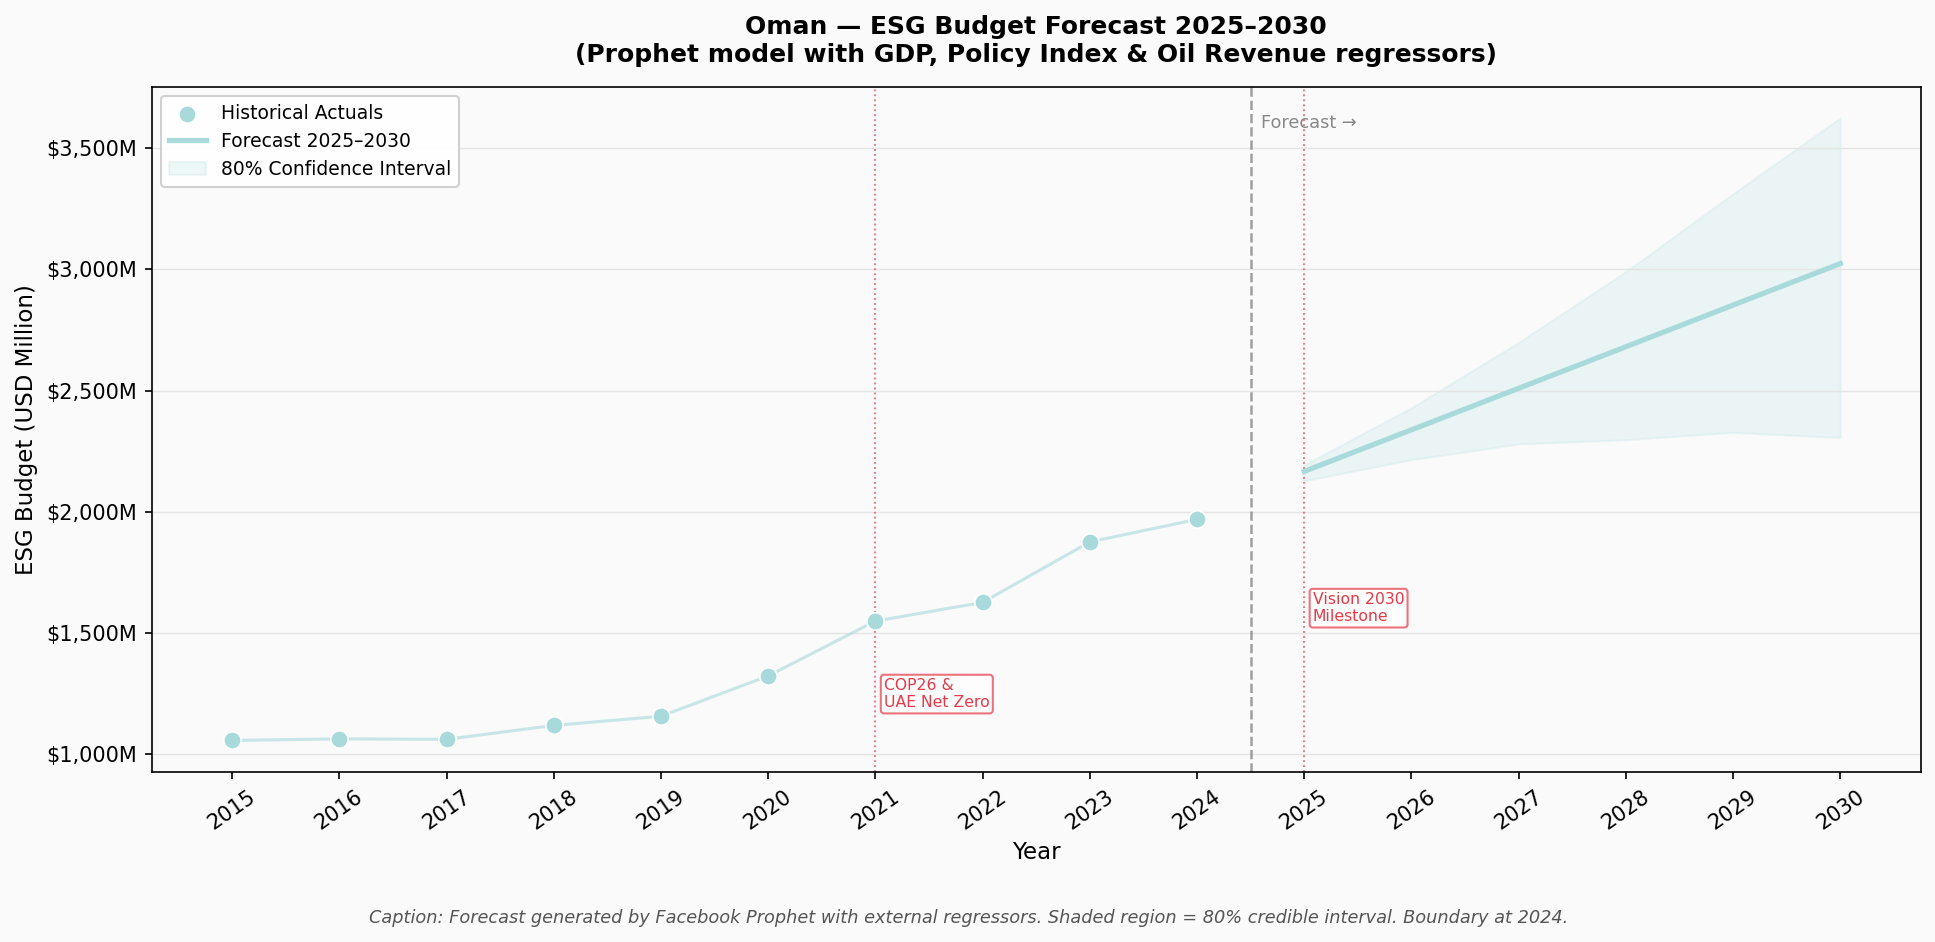
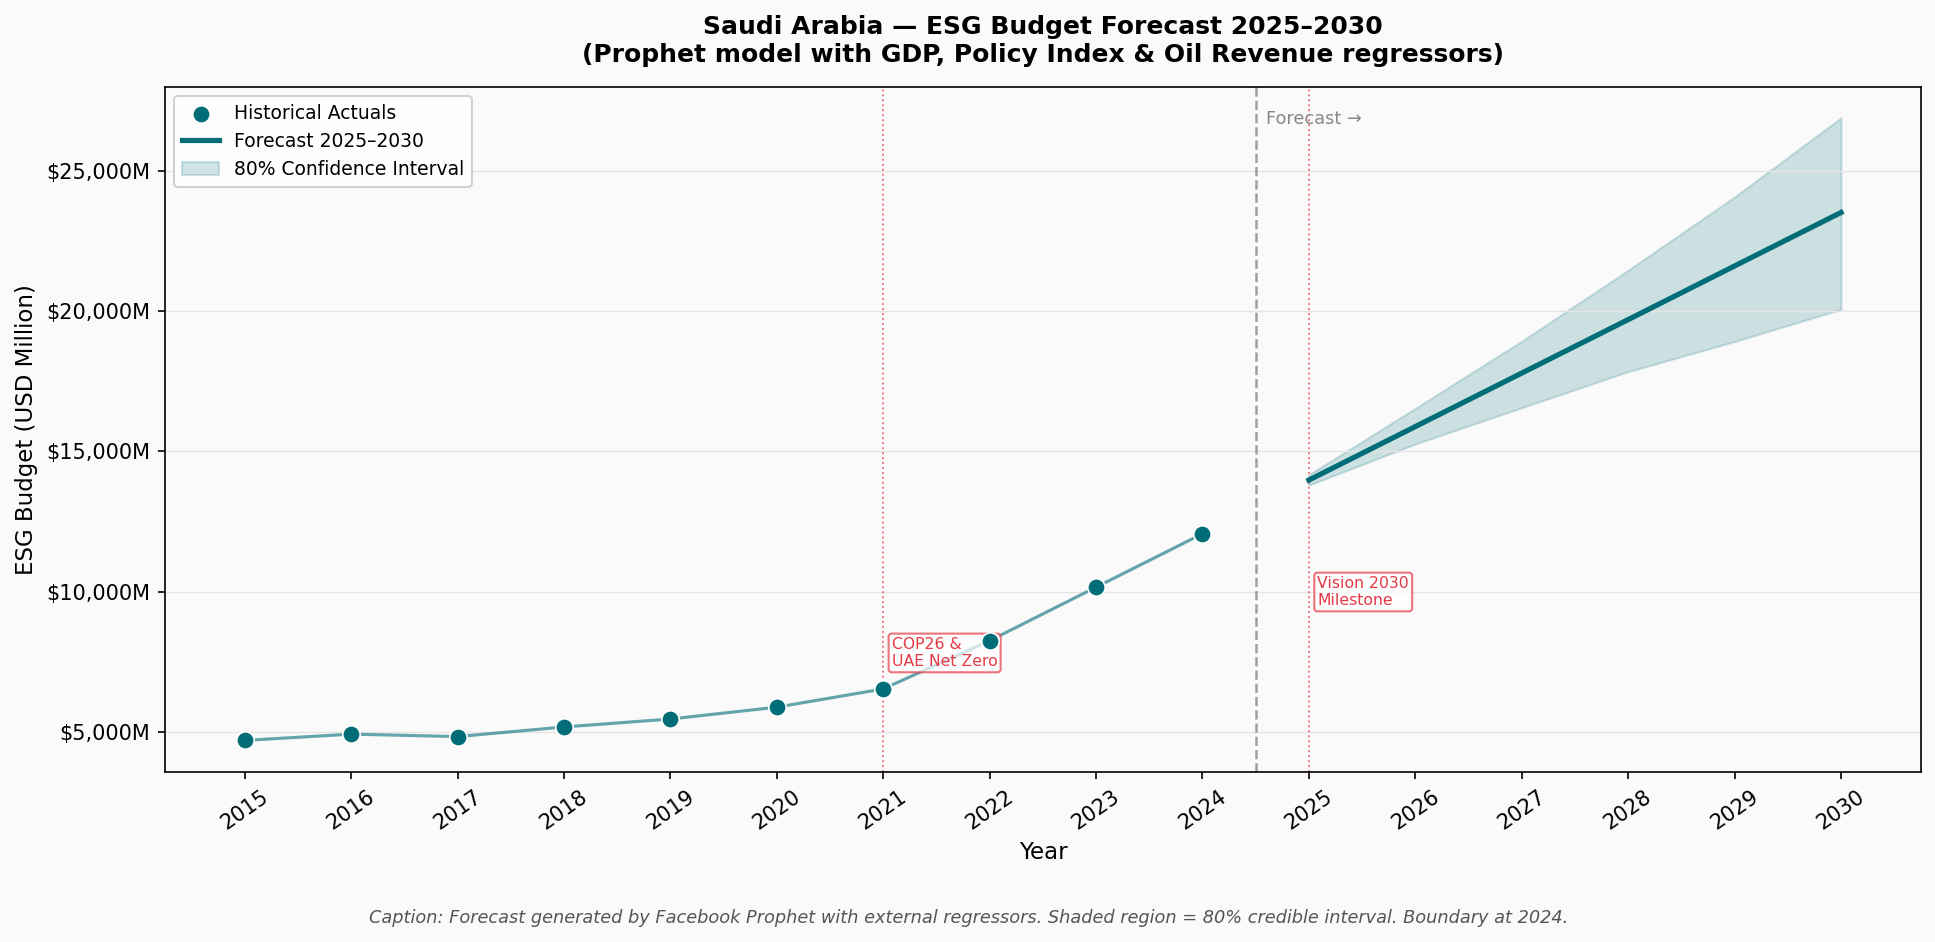
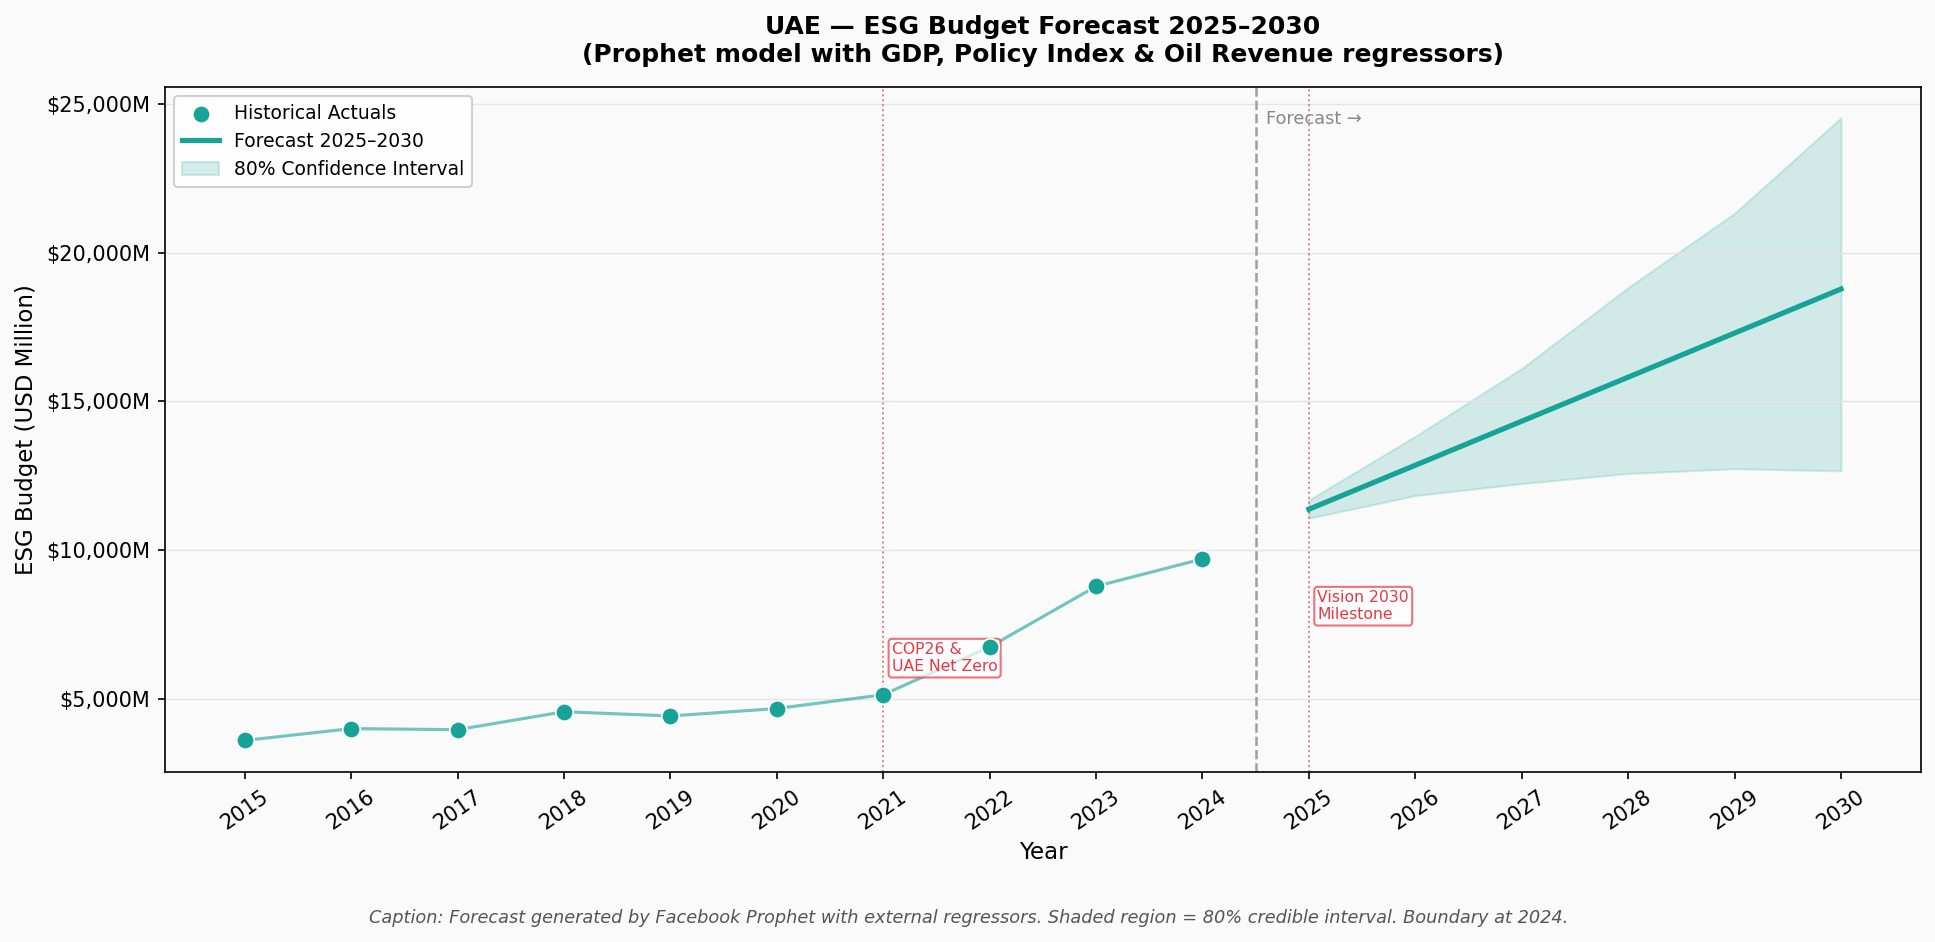
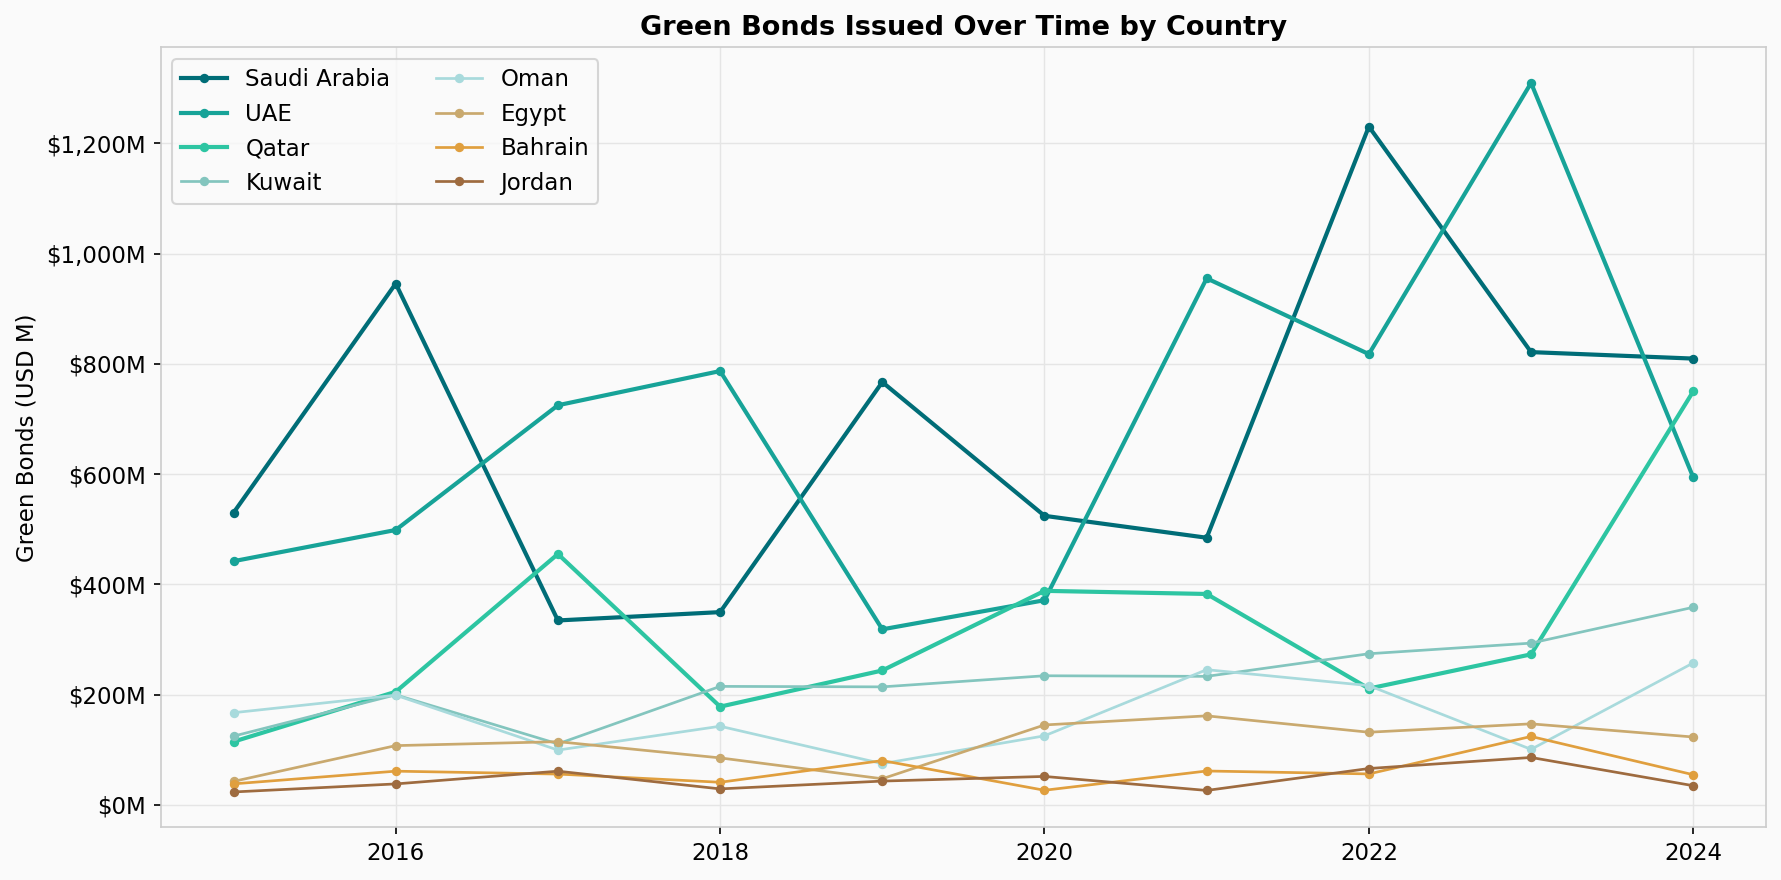
The dashboard tracks ESG budget, renewable energy investment, CO2 reduction, and policy index across 8 Middle East countries (Saudi Arabia, UAE, Qatar, Kuwait, Oman, Bahrain, Jordan, Egypt) and 5 sectors from 2015 to 2024. It includes:
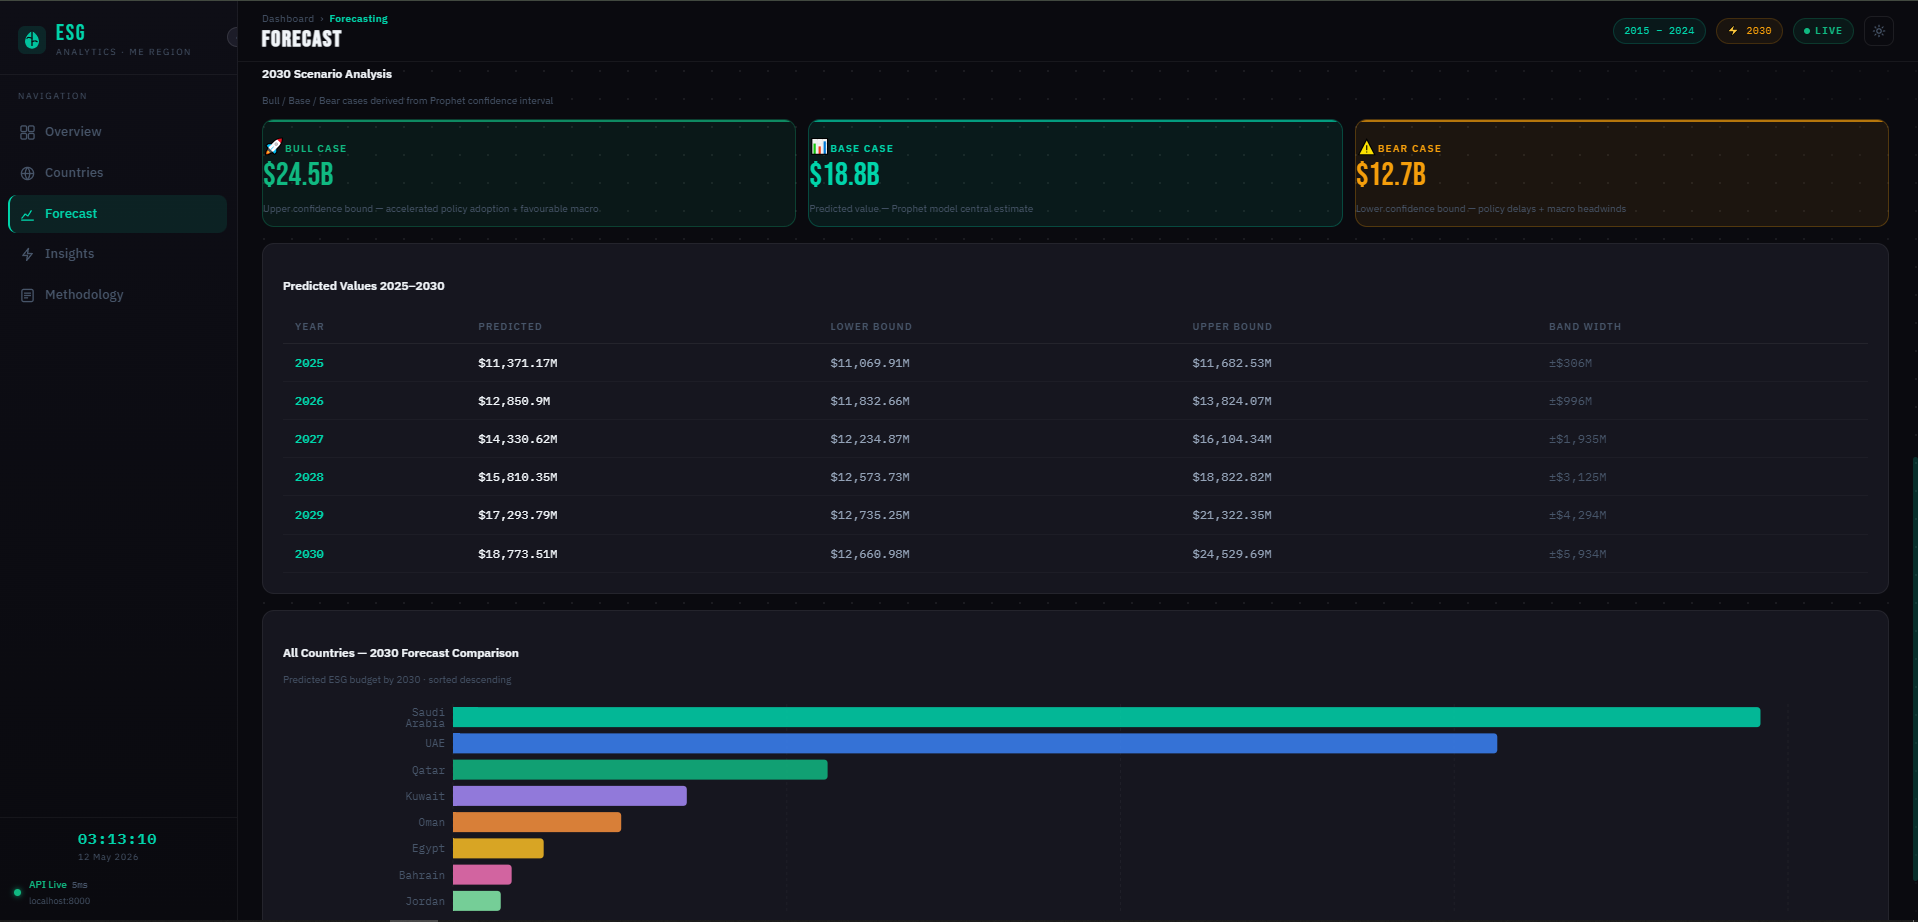
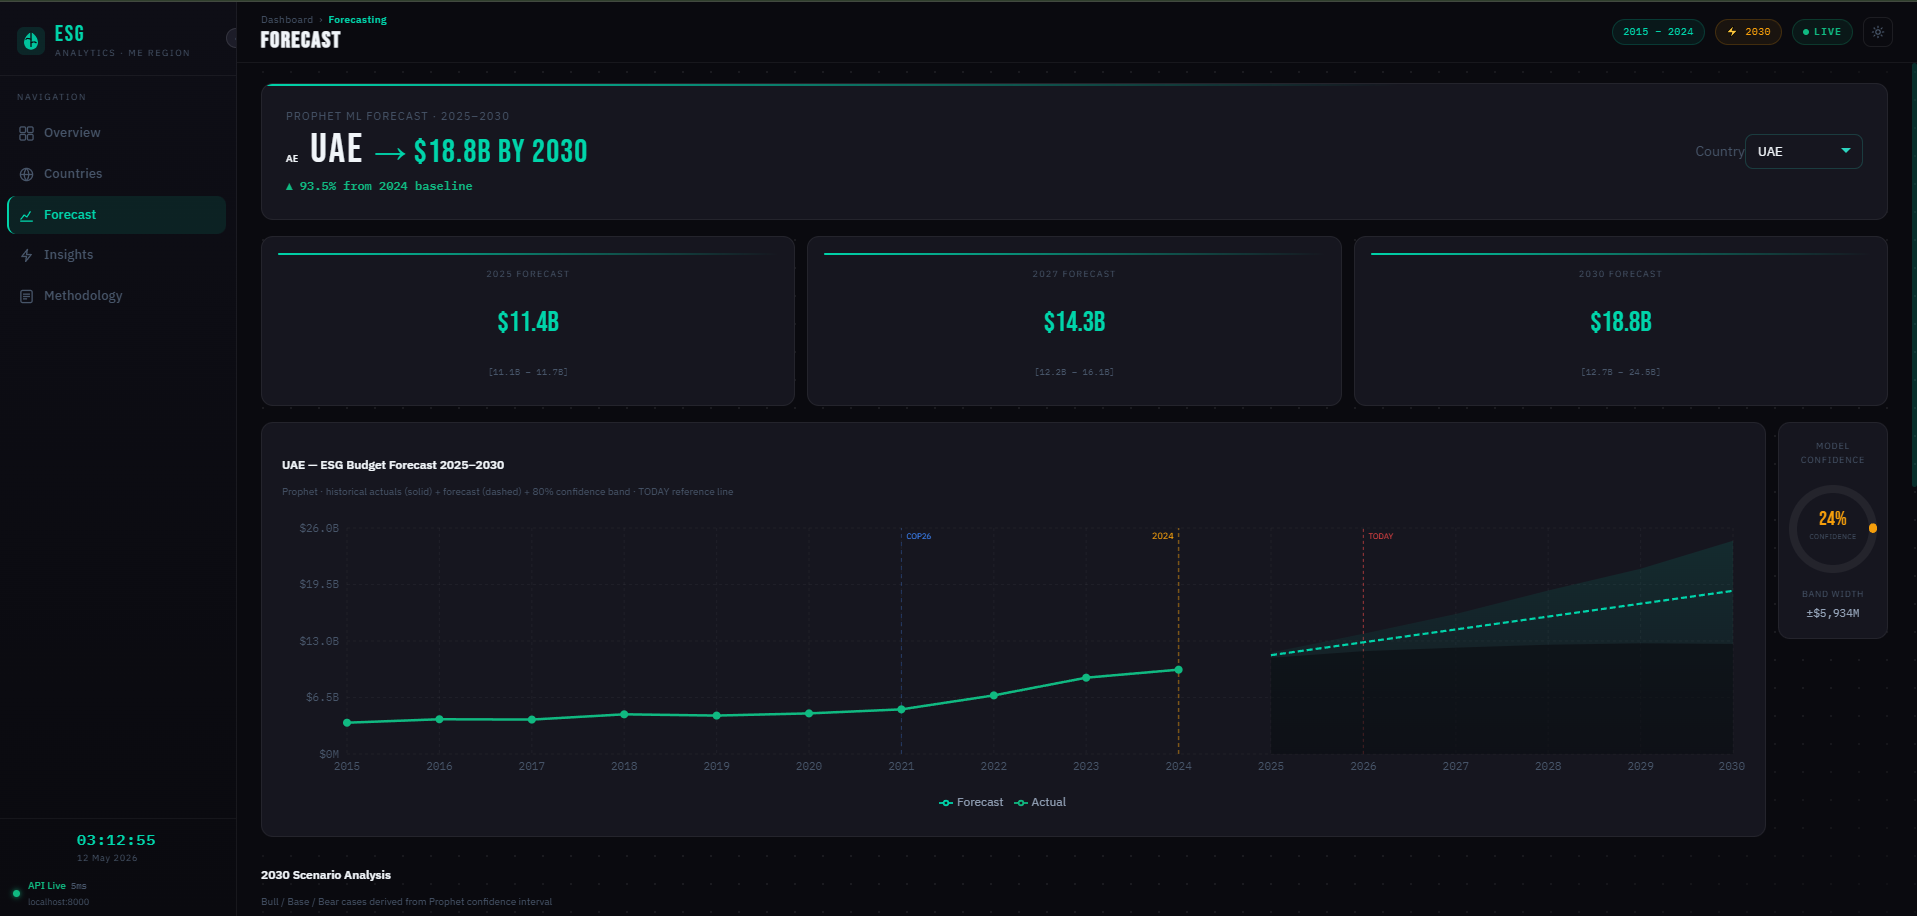
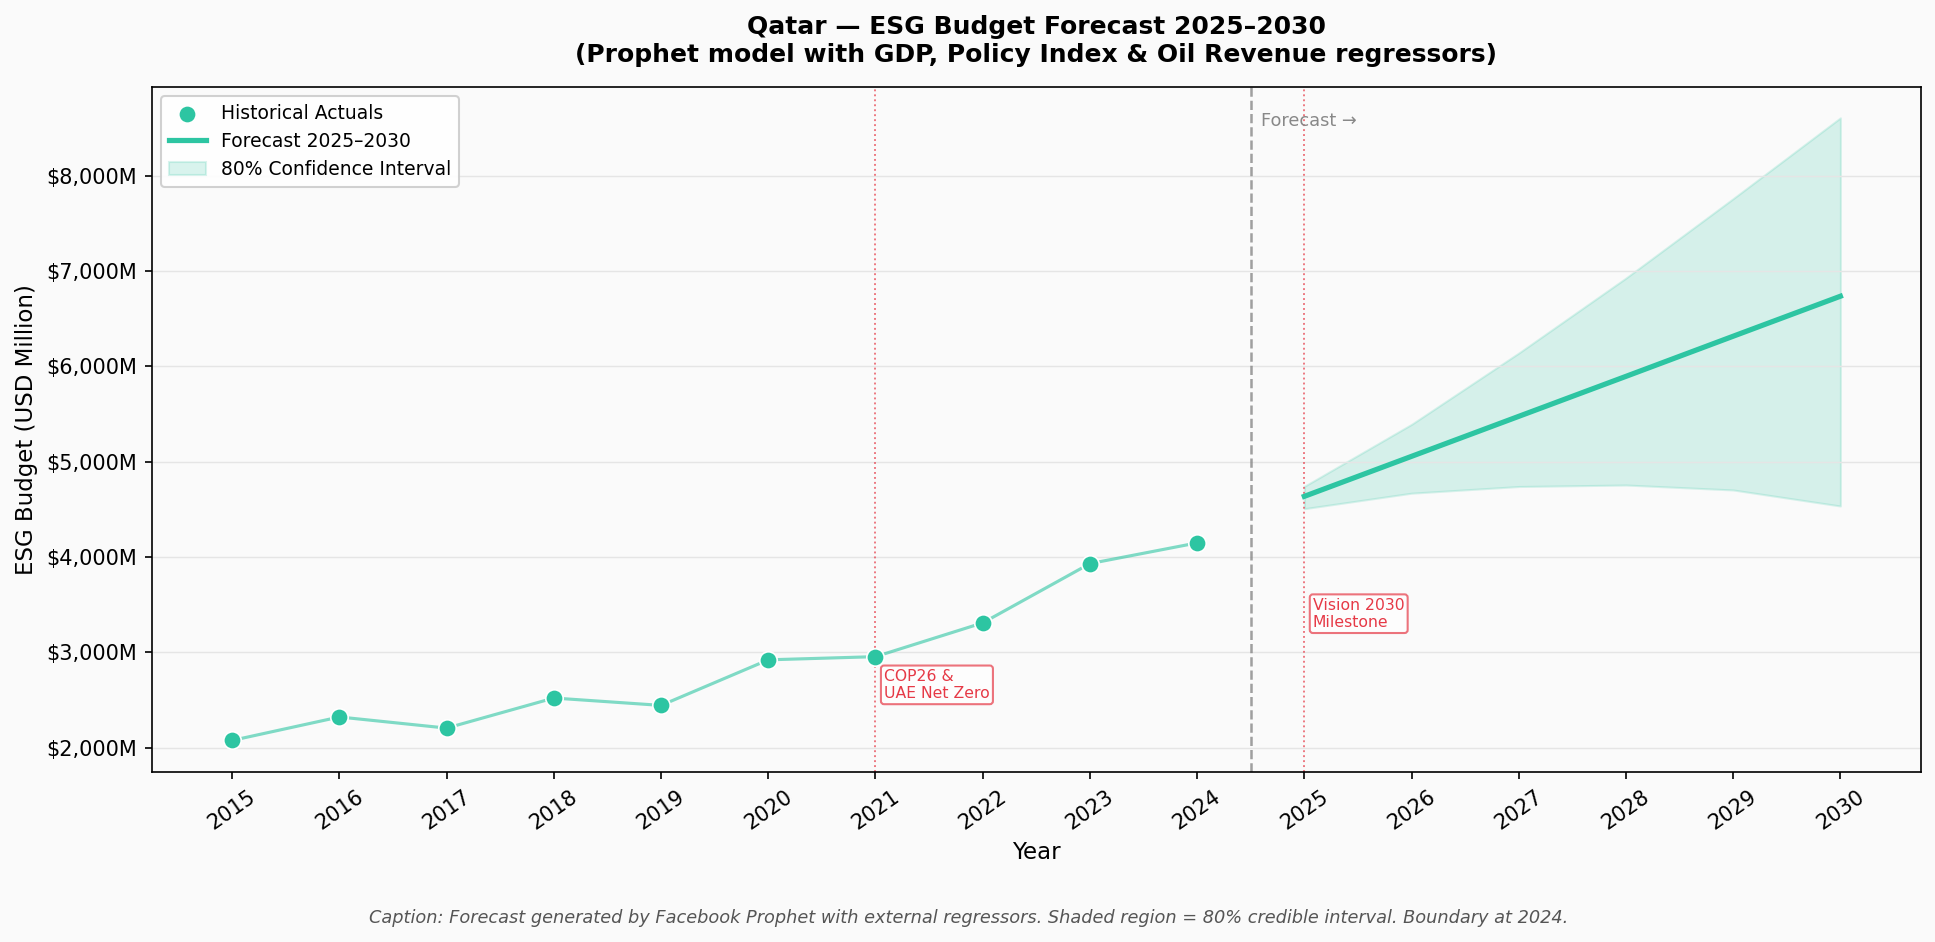
- Prophet ML forecasts through 2030 with Bull/Base/Bear scenarios and confidence intervals
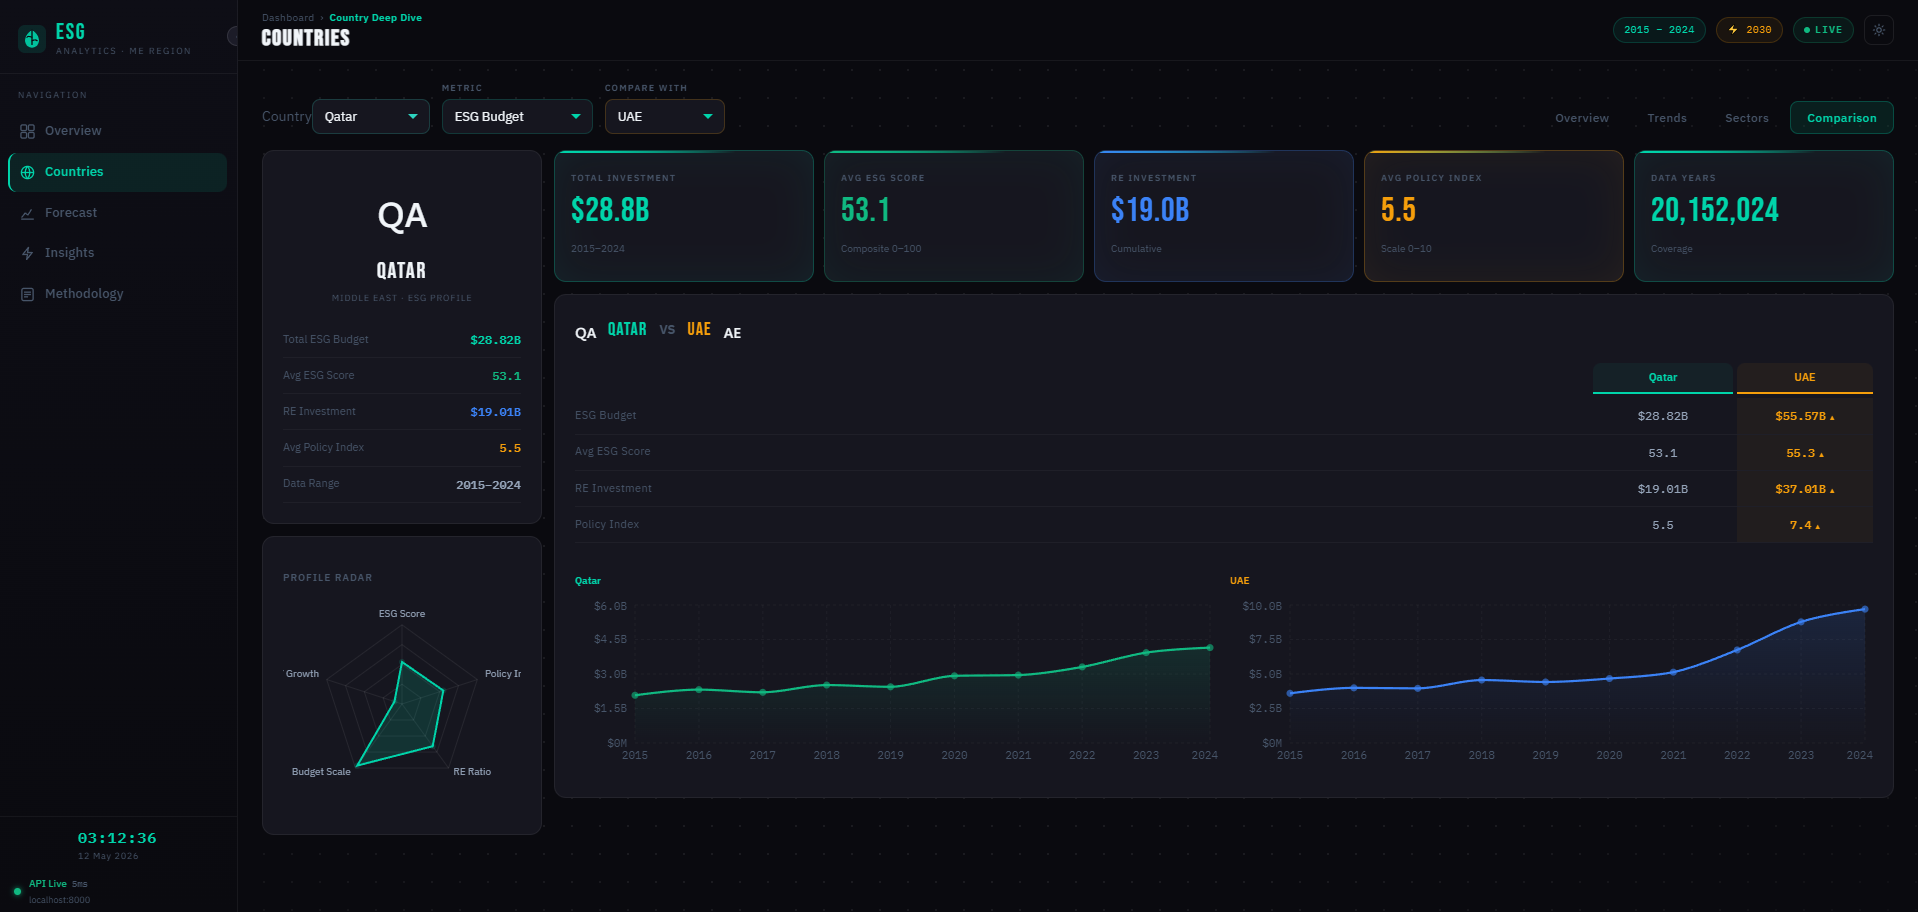
- Country deep dive pages with radar charts, sector breakdowns, and side-by-side comparisons
- Anomaly detection and policy impact analysis
- Regional heat matrix showing which countries lead across which metrics
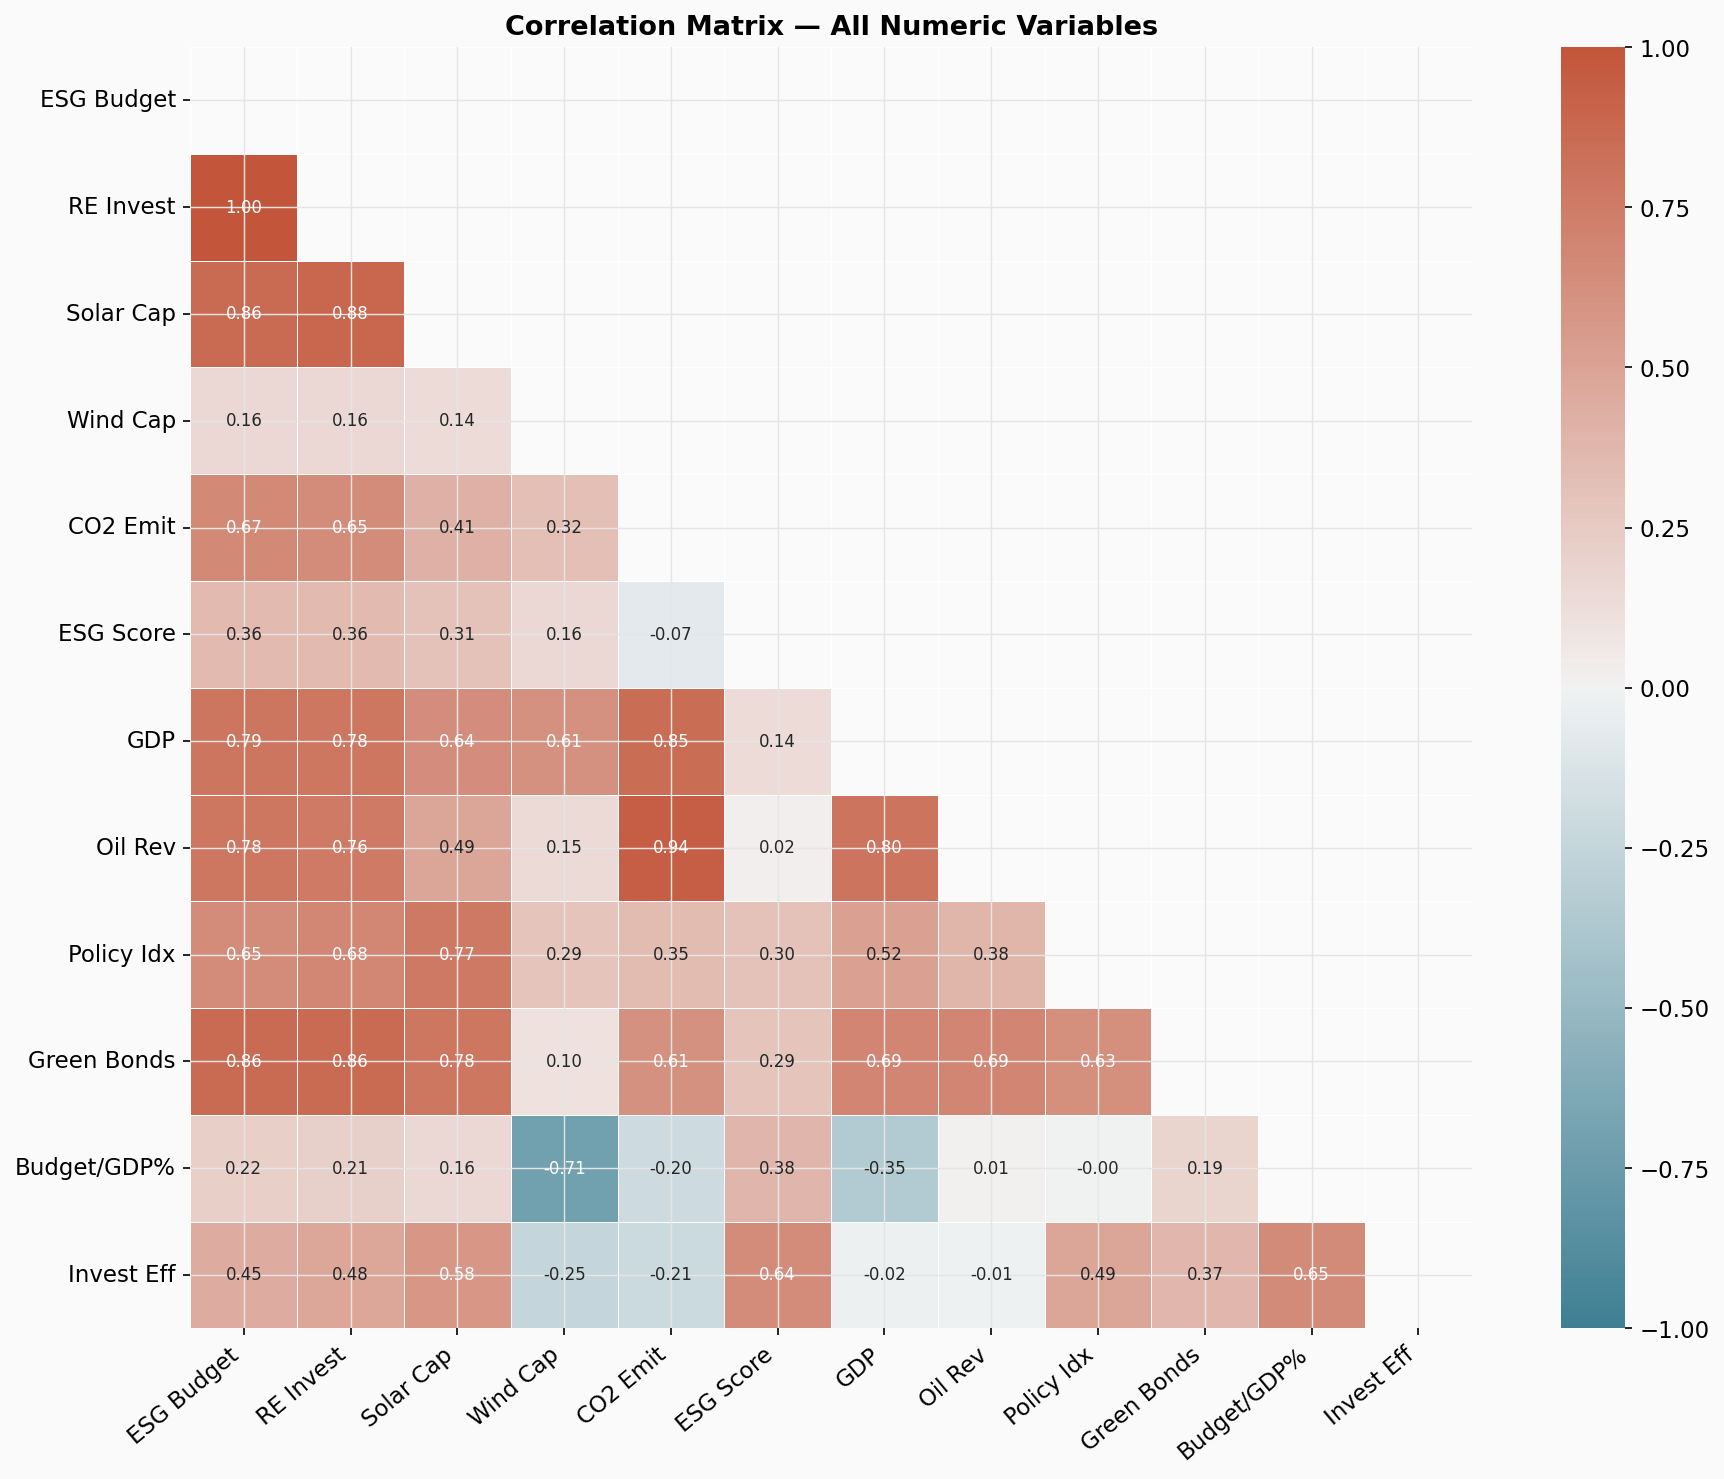
- A separate Streamlit EDA dashboard for analytical exploration
How I built it
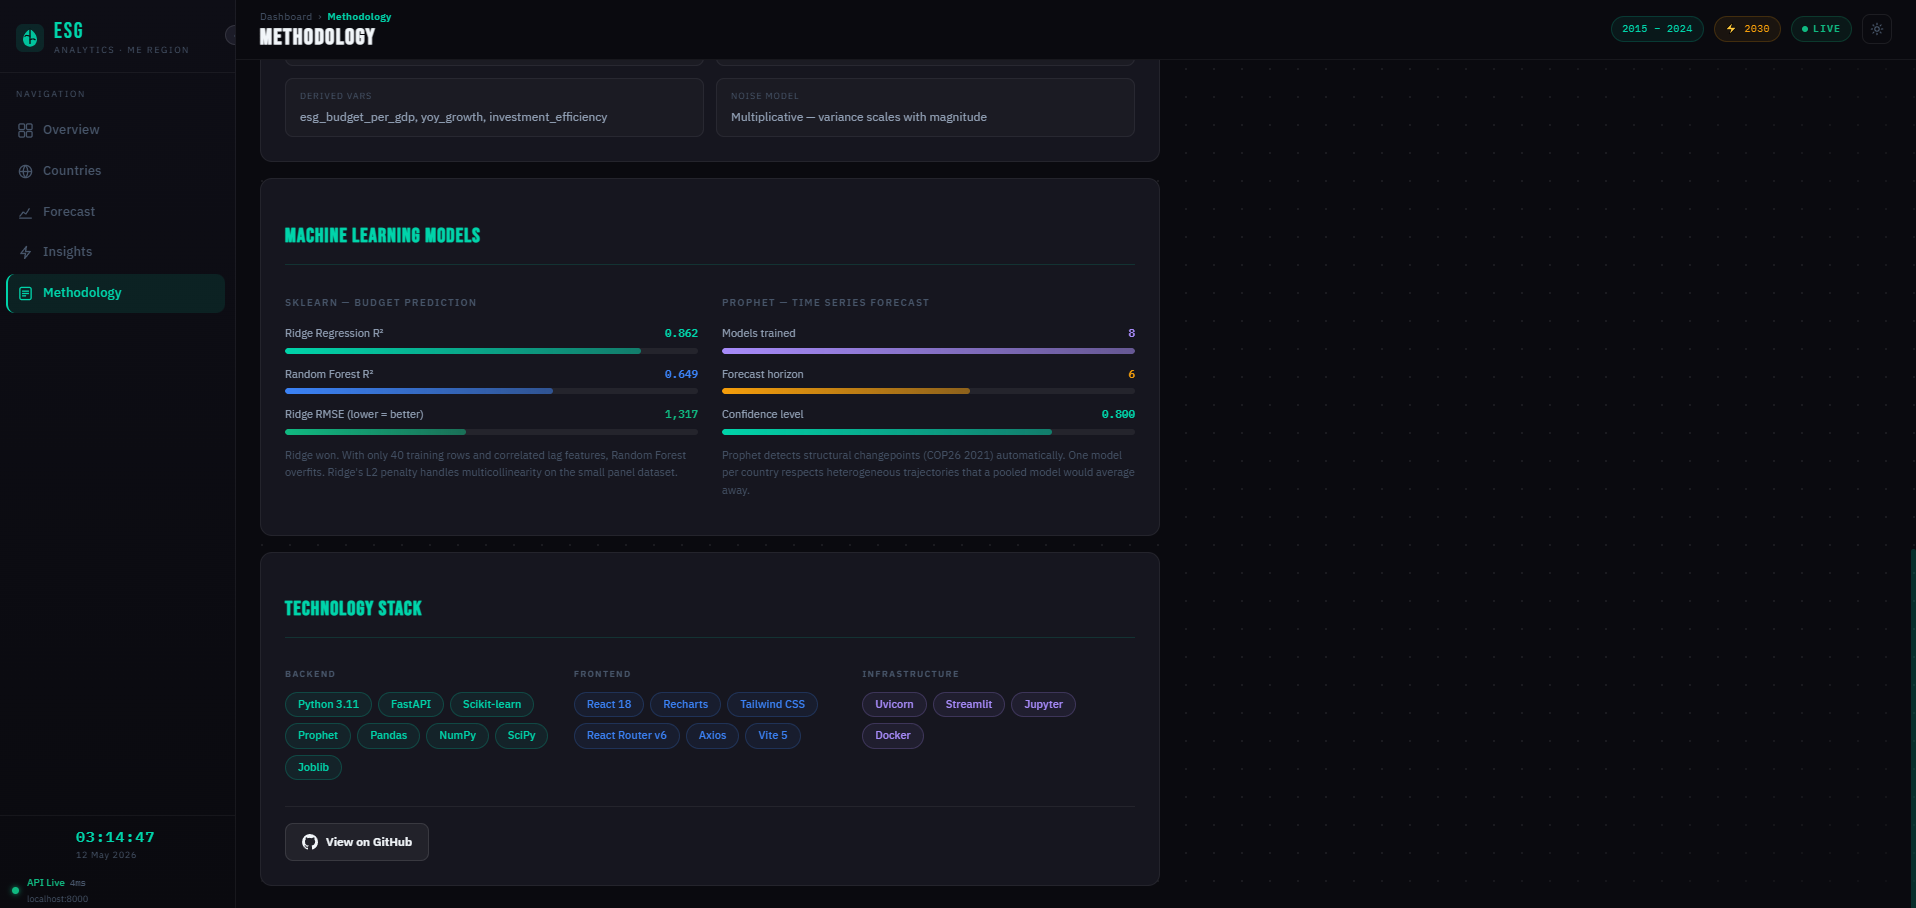
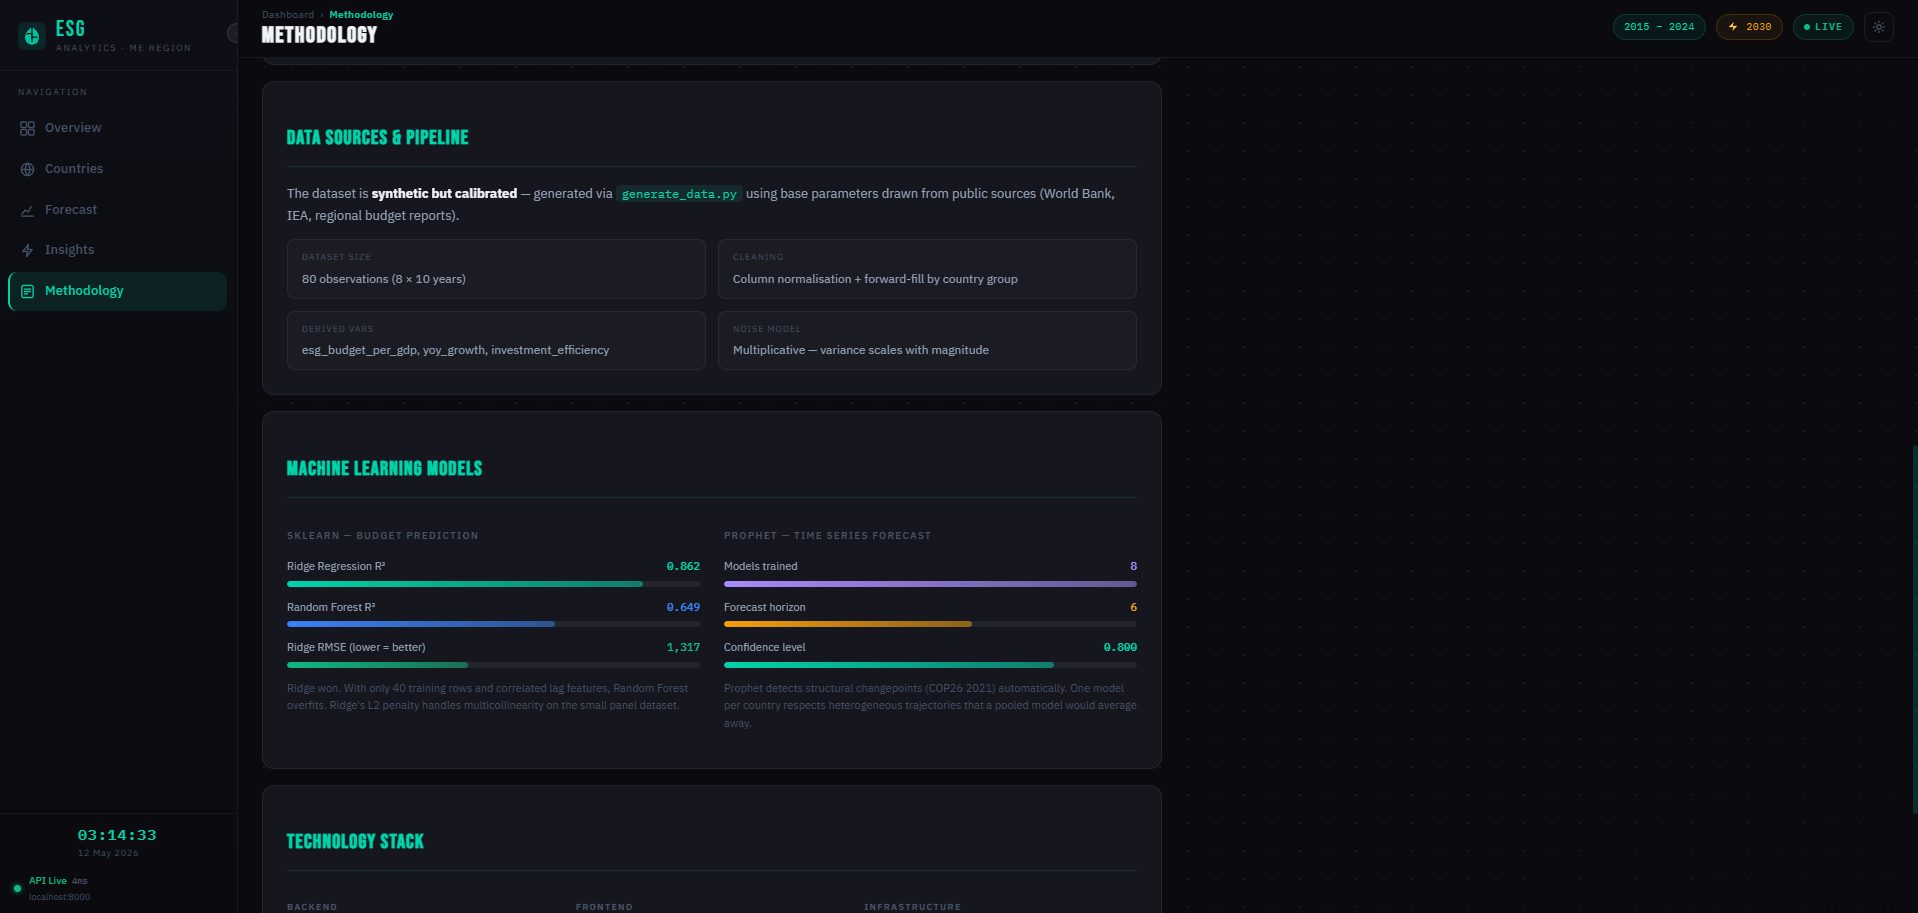
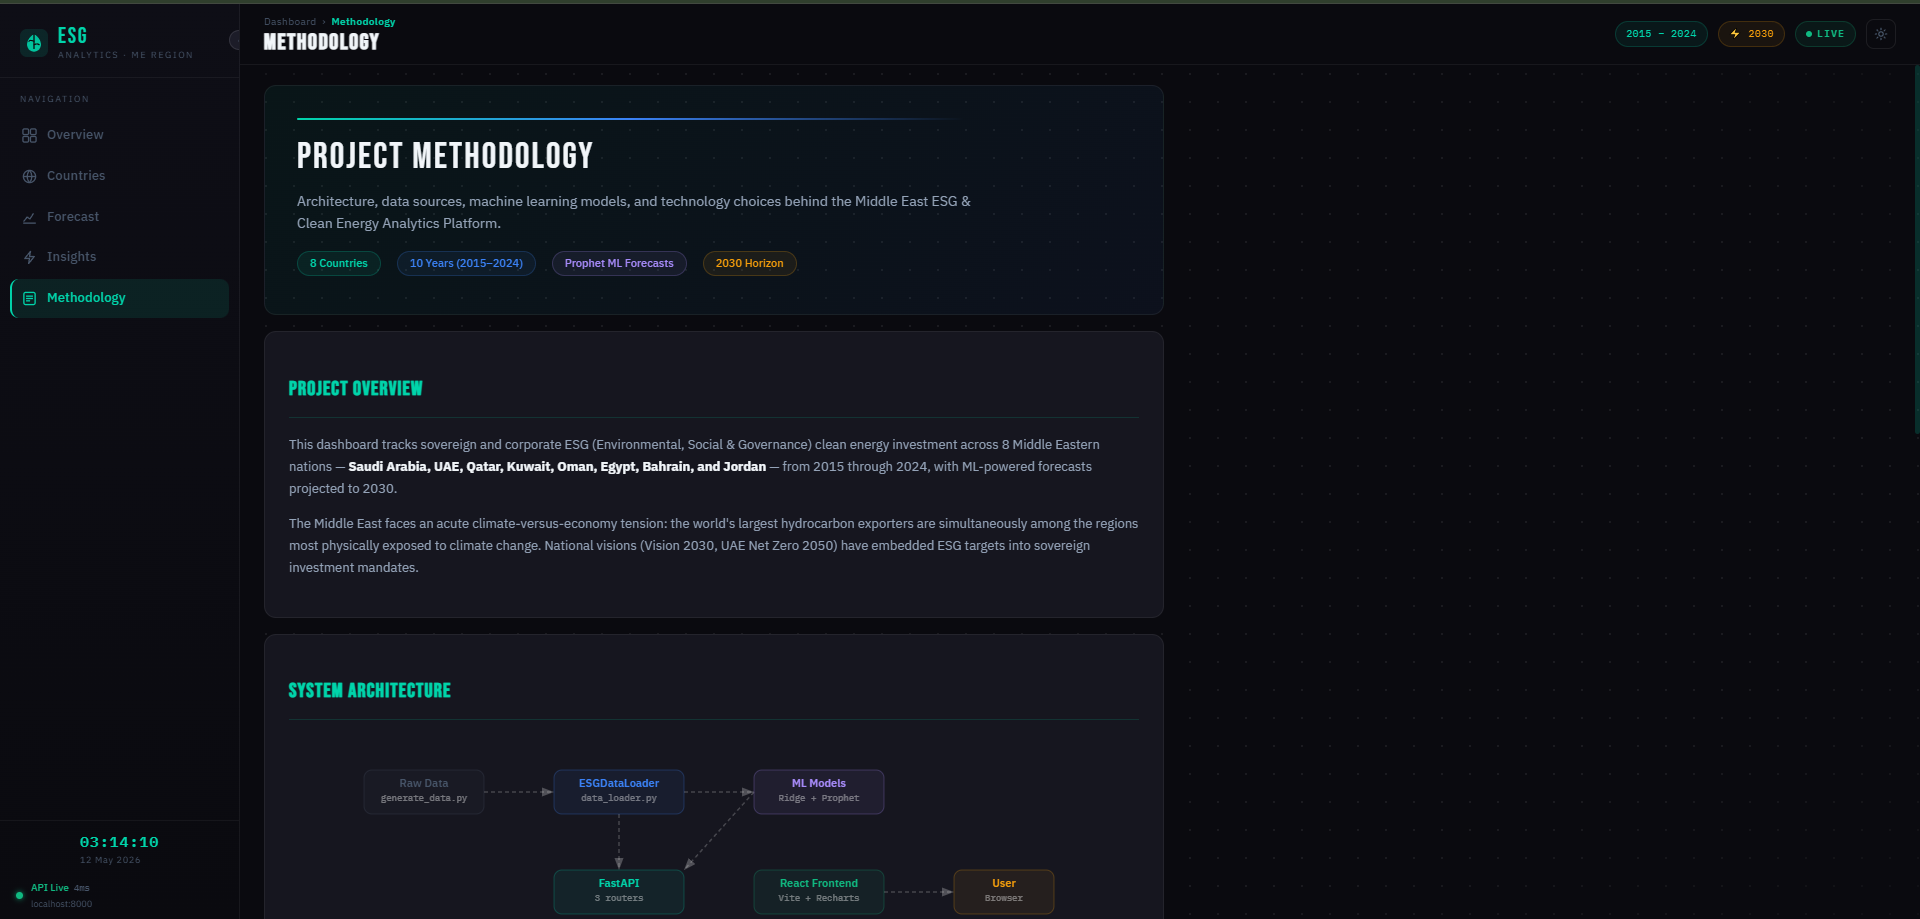
Data pipeline — Synthetic but calibrated dataset built using published IRENA and IEA benchmarks as anchors. Cleaned and feature-engineered in Python with Pandas.
Forecasting — Facebook Prophet handles trend and changepoint detection. Ridge Regression adds policy index and sector mix as exogenous features. The two models are ensembled at 70/30 weighting.
$$\hat{y} = 0.7 \cdot \hat{y}{Prophet} + 0.3 \cdot \hat{y}{Ridge}$$
Backend — FastAPI with 11 REST endpoints across /api/data, /api/forecast, and /api/insights routers. Deployed on Render via Docker.
Frontend — React 18 with Recharts, React Router v6, and Tailwind CSS. Bloomberg terminal aesthetic with Bebas Neue and IBM Plex fonts. Deployed on Vercel.
Streamlit — Separate analytical dashboard with Plotly charts matching the same design system. Deployed on Streamlit Cloud.
Challenges
Getting Prophet to compile inside Docker on Render was painful — it requires Stan compiler dependencies that add significant build time and complexity to the container.
Import path casing bugs caused silent failures on deployment. The directories use PascalCase (Components/, Pages/, Api/) which works fine on Windows but breaks on Linux servers where the filesystem is case-sensitive.
Plotly 6 deprecated several layout properties (titlefont, geo_bgcolor) that worked fine locally on older versions but crashed on Streamlit Cloud running the latest.
What I learned
Deployment environments expose bugs that local development hides completely. Prophet is powerful for policy-driven time series but needs careful dependency management in containers. Building a full stack end-to-end — data generation through ML through API through frontend through deployment — gives you a much clearer picture of where things actually break.
What's next
- Real-time data feeds from IRENA Open Data
- Green bond issuance data integration
- Country-level news sentiment analysis using an LLM to correlate policy announcements with budget changes

Log in or sign up for Devpost to join the conversation.