
Inspiration
Malaria is a major issue in Kenya, where according to the US President's Malaria Initiative ~75% of the Kenyan population is at risk for malaria. How can we help educate and provide information to individuals for them to be better prepared to deal with locations with high risk of malaria?
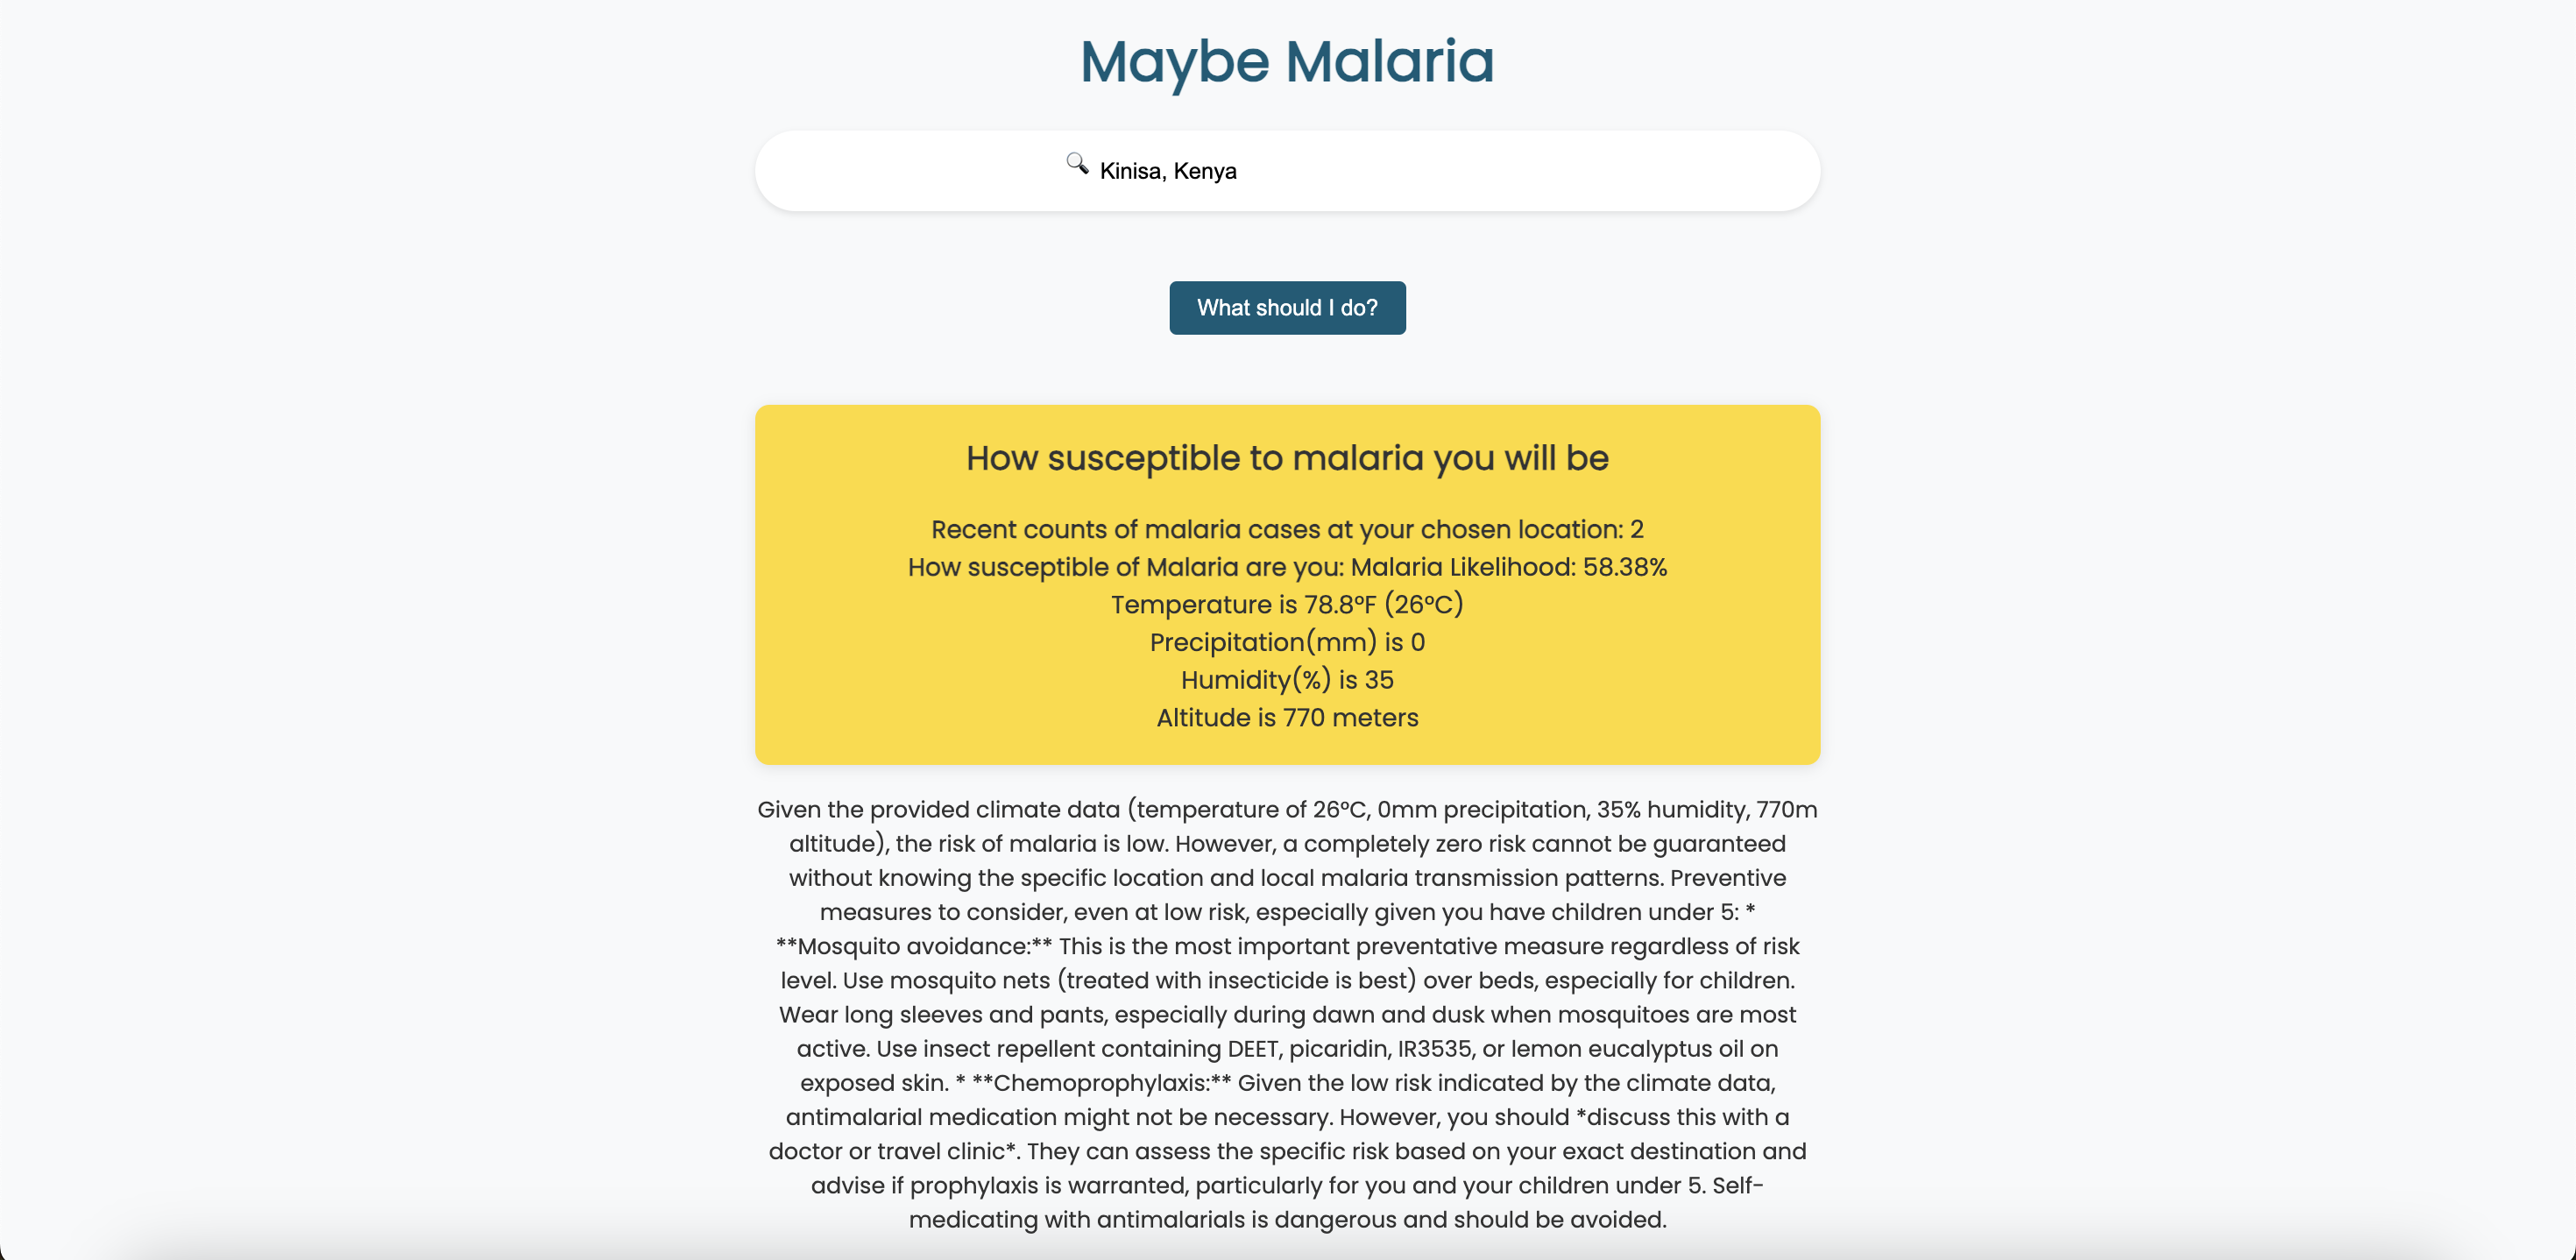
What it does
Based on the user input of the location they want to check, we pull weather and geographic data, including temperature, precipitation, humidity, and altitude to determine how susceptible/prone the location is to the spread of malaria. Along with the users' input of certain characteristics (that are optional) that may make them more vulnerable to the disease, we generate information and advice for the precautions they should take.
How we built it
Purely HTML, CSS, and JavaScript, along with Google Maps, OpenWeatherMap, and Gemini AI APIs. We also parsed through WHO's dataset on malaria threat hotspots for data on where the hotspots were. Distance from hotspots calculations were done using Haversine's formula for distance approximation between two coordinates, and we also implemented our own formulas and weightage for the factors that affect how susceptible a location is.
Challenges we ran into
Finding a way to weigh the different factors in determining how susceptible a location is to a malaria outbreak.
Accomplishments that we're proud of
Getting the data from the different sources to match up.
What we learned
We learned about malaria itself, the conditions/factors that go into making a location more susceptible to the spread of the disease, and how fatal it is for certain groups of individuals. Technically, we learned how to better implement several API calls together.
What's next for Maybe Malaria
Implement machine learning, based on past malaria hotspots and weather then, for calculations of the susceptibility percentages.

Log in or sign up for Devpost to join the conversation.