-
-
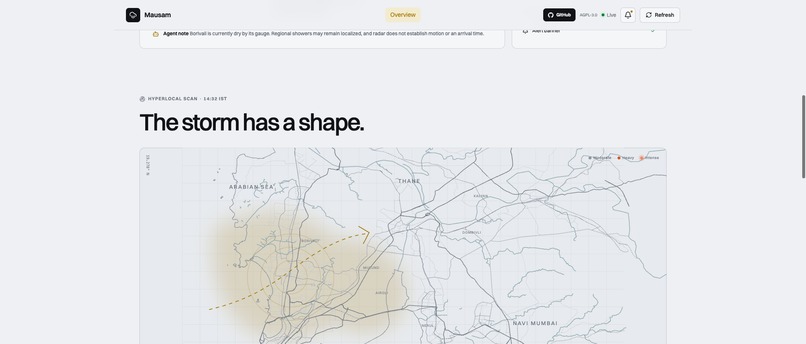
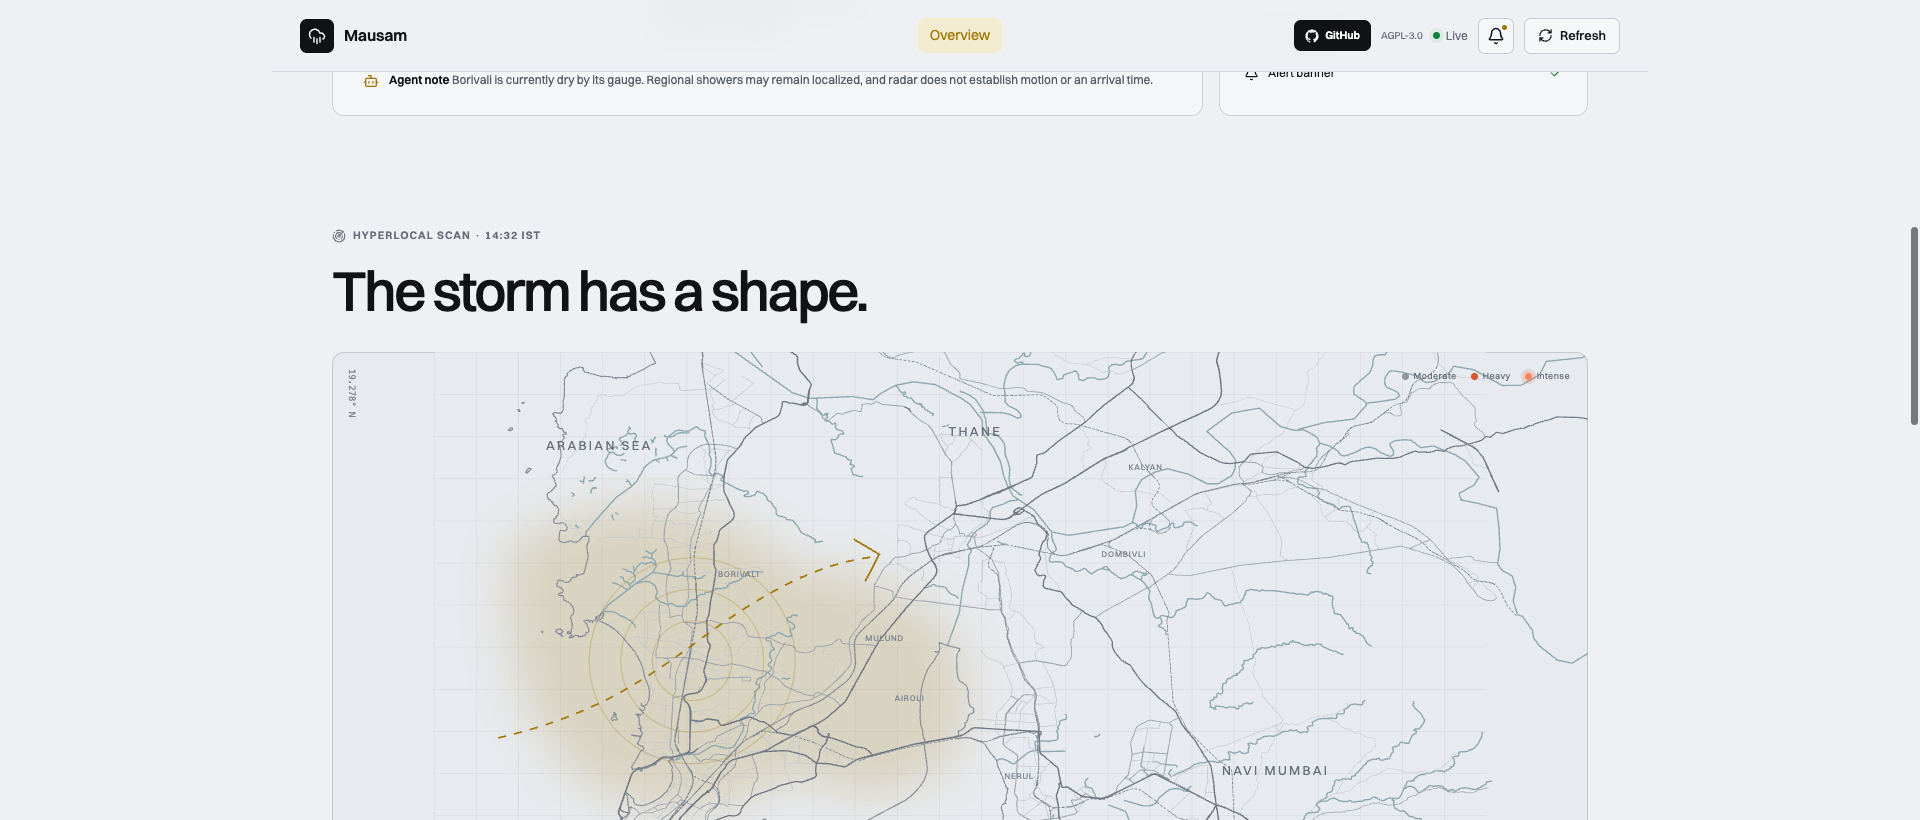
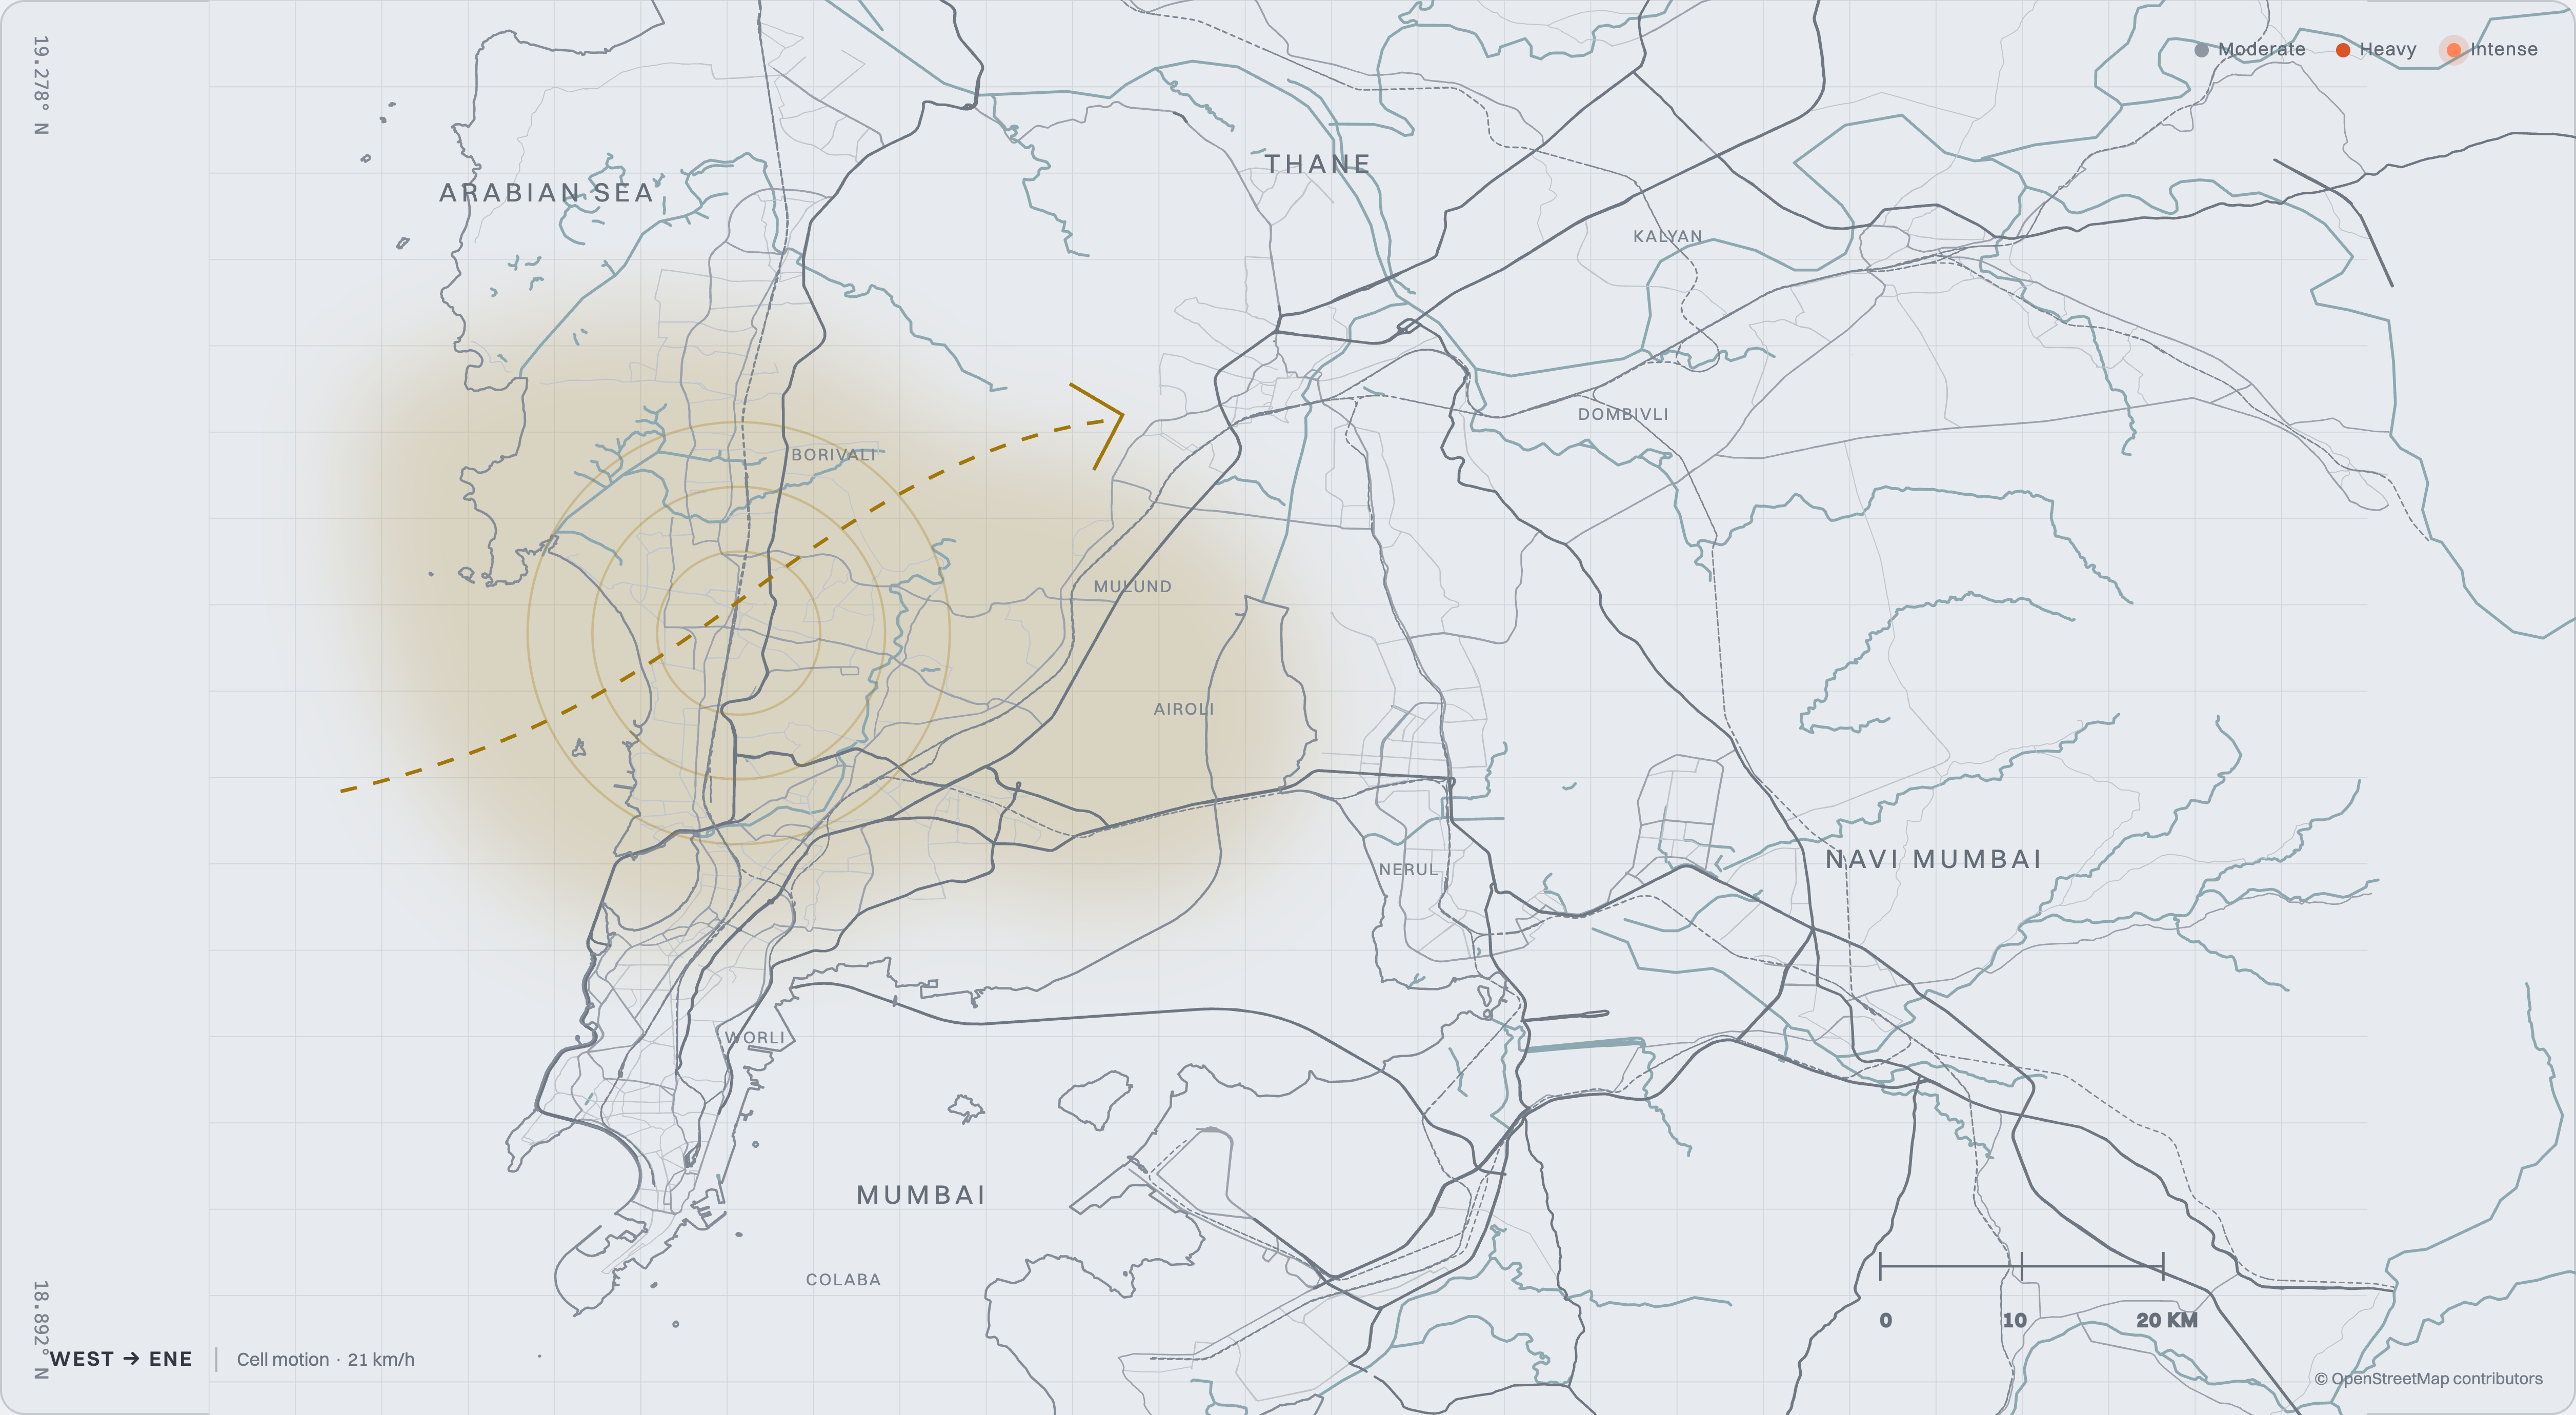
Interactive map close-up - Zoomed view of the MMR map with rainfall intensity scale
-
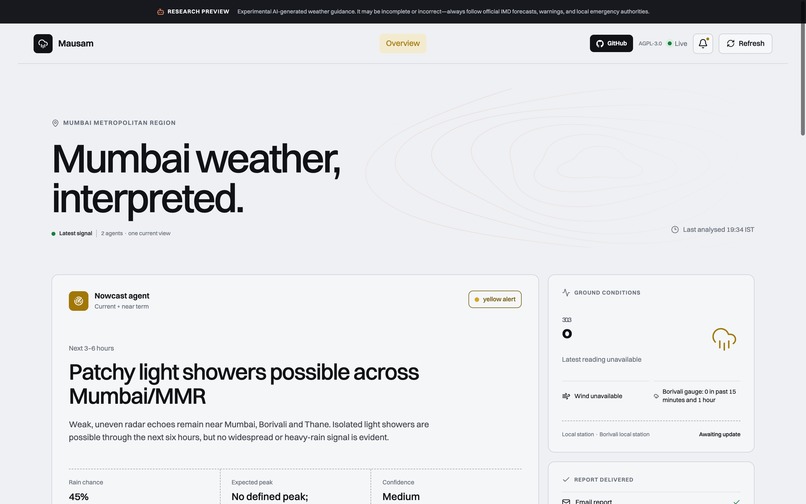
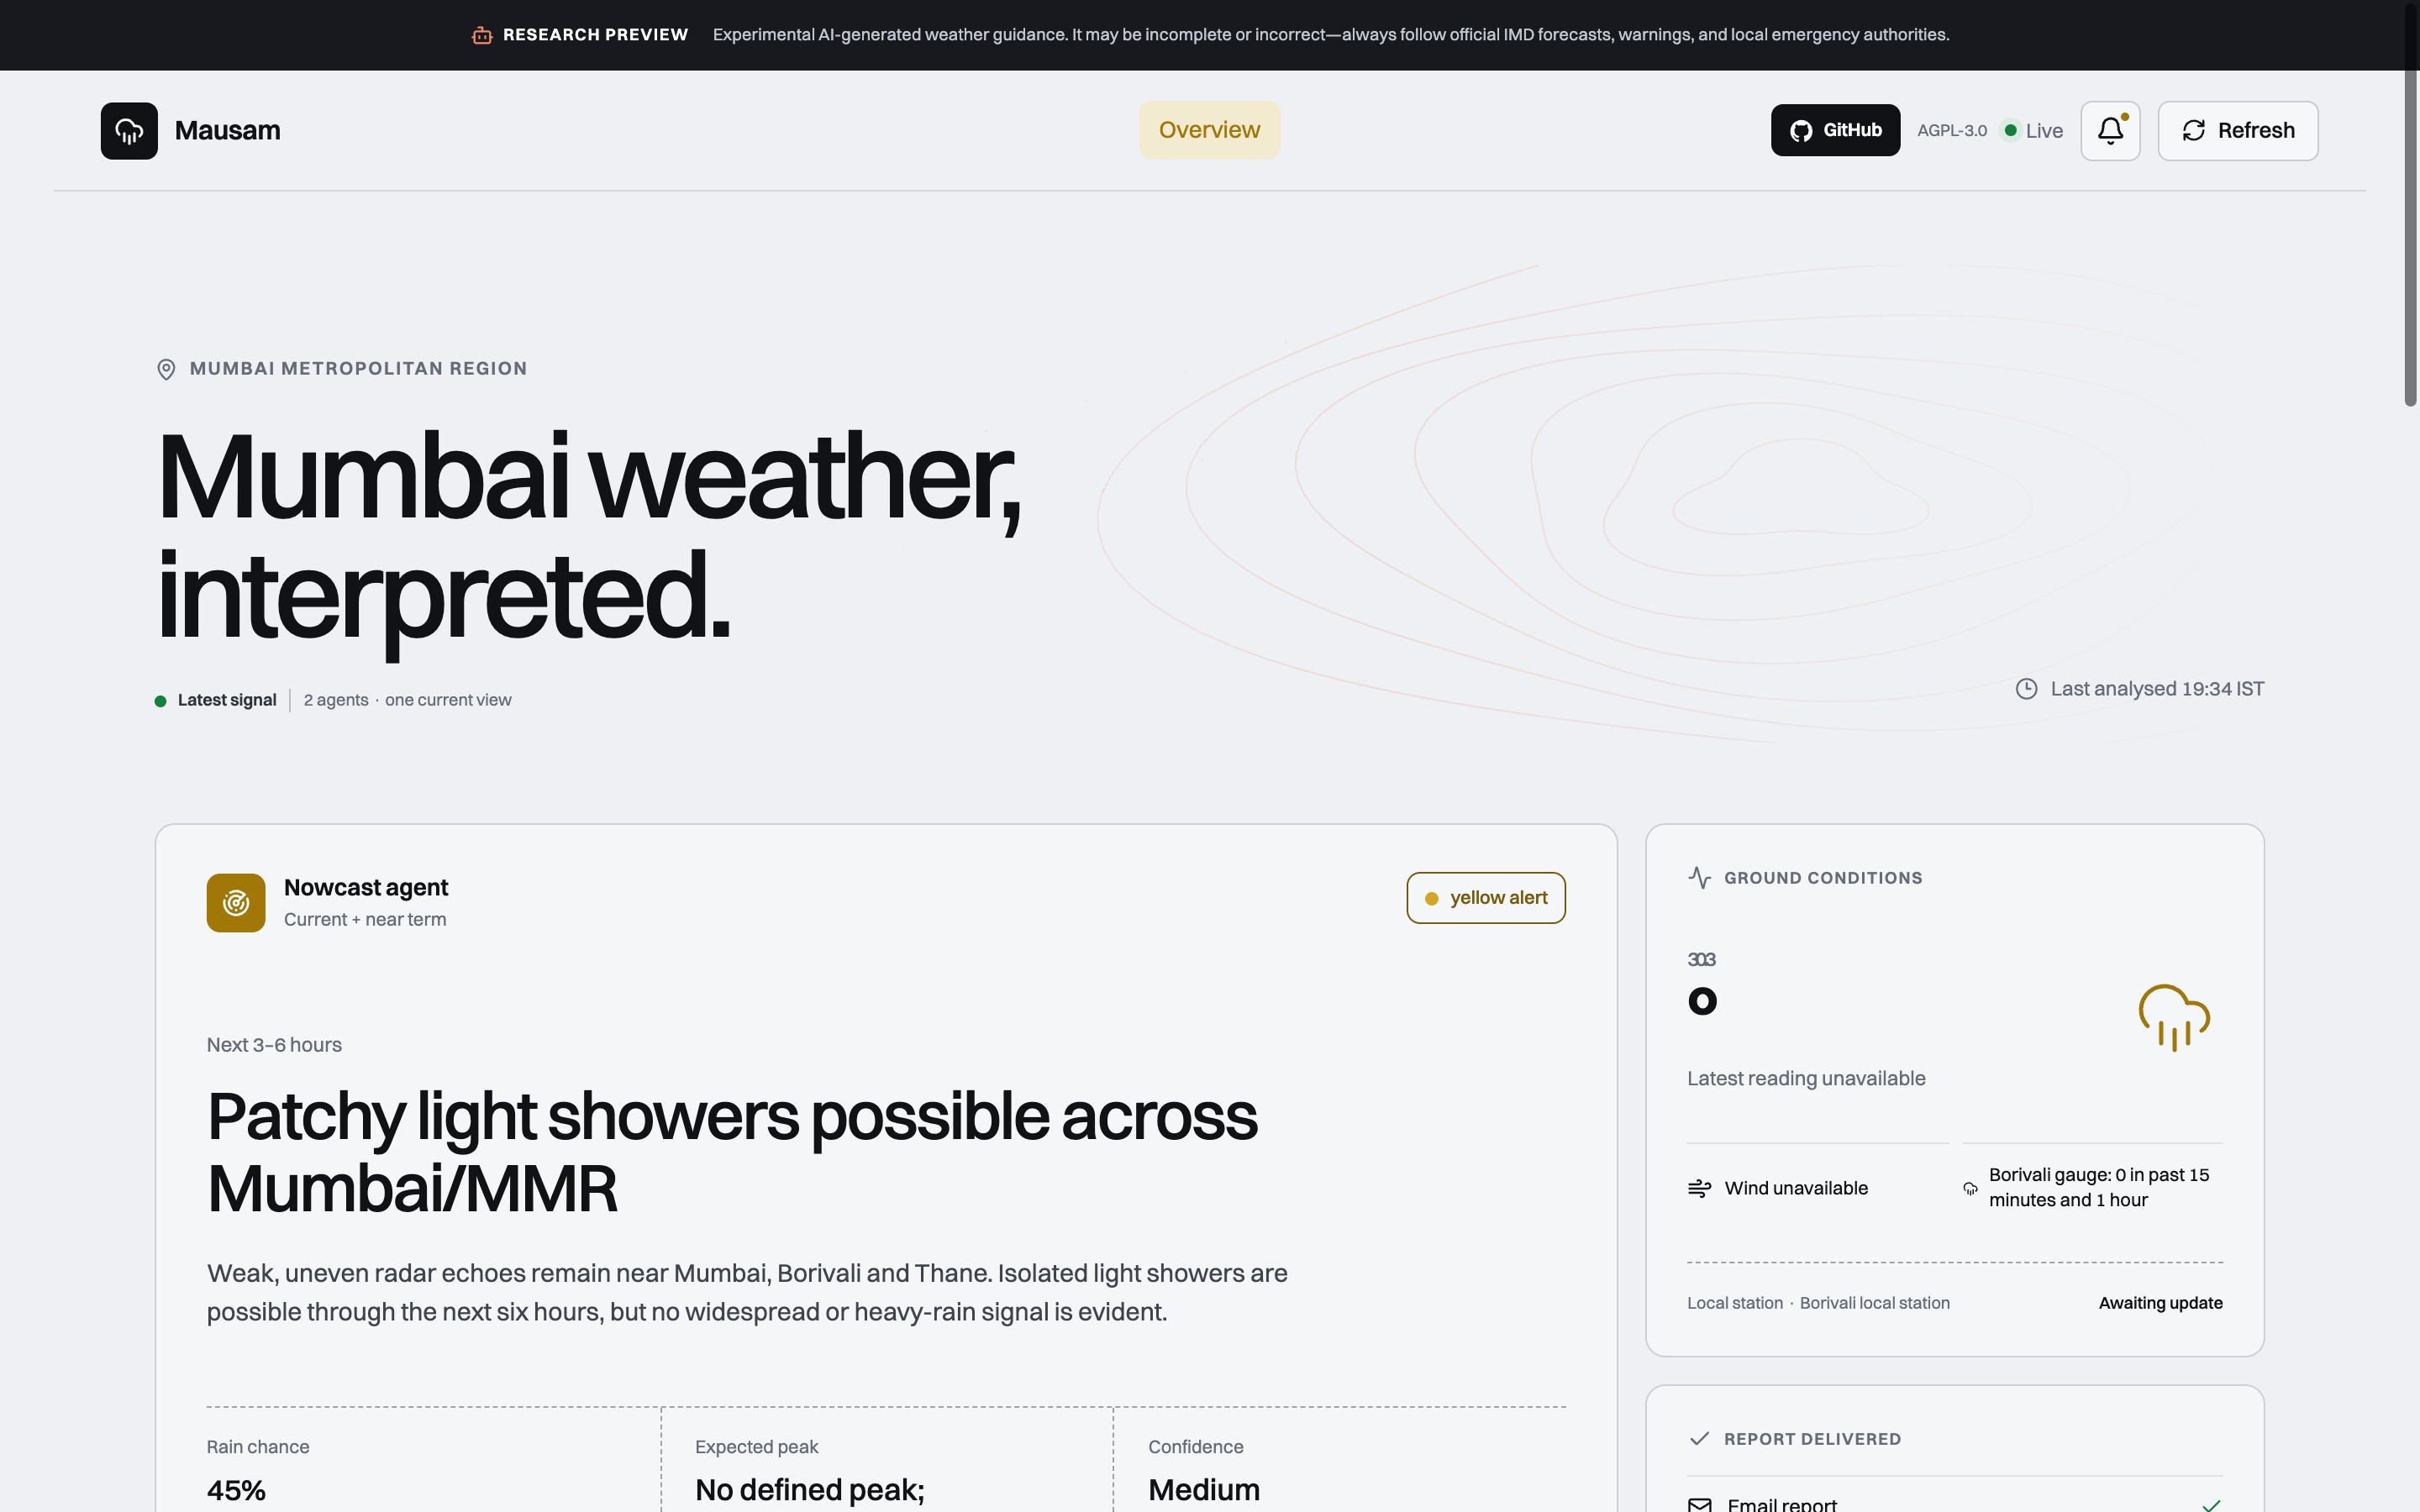
Desktop landing view - Mausam header with live status and the Mumbai rainfall intelligence map
-
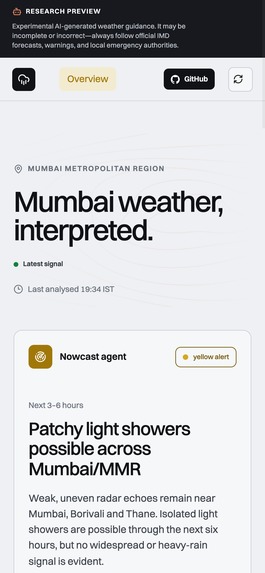
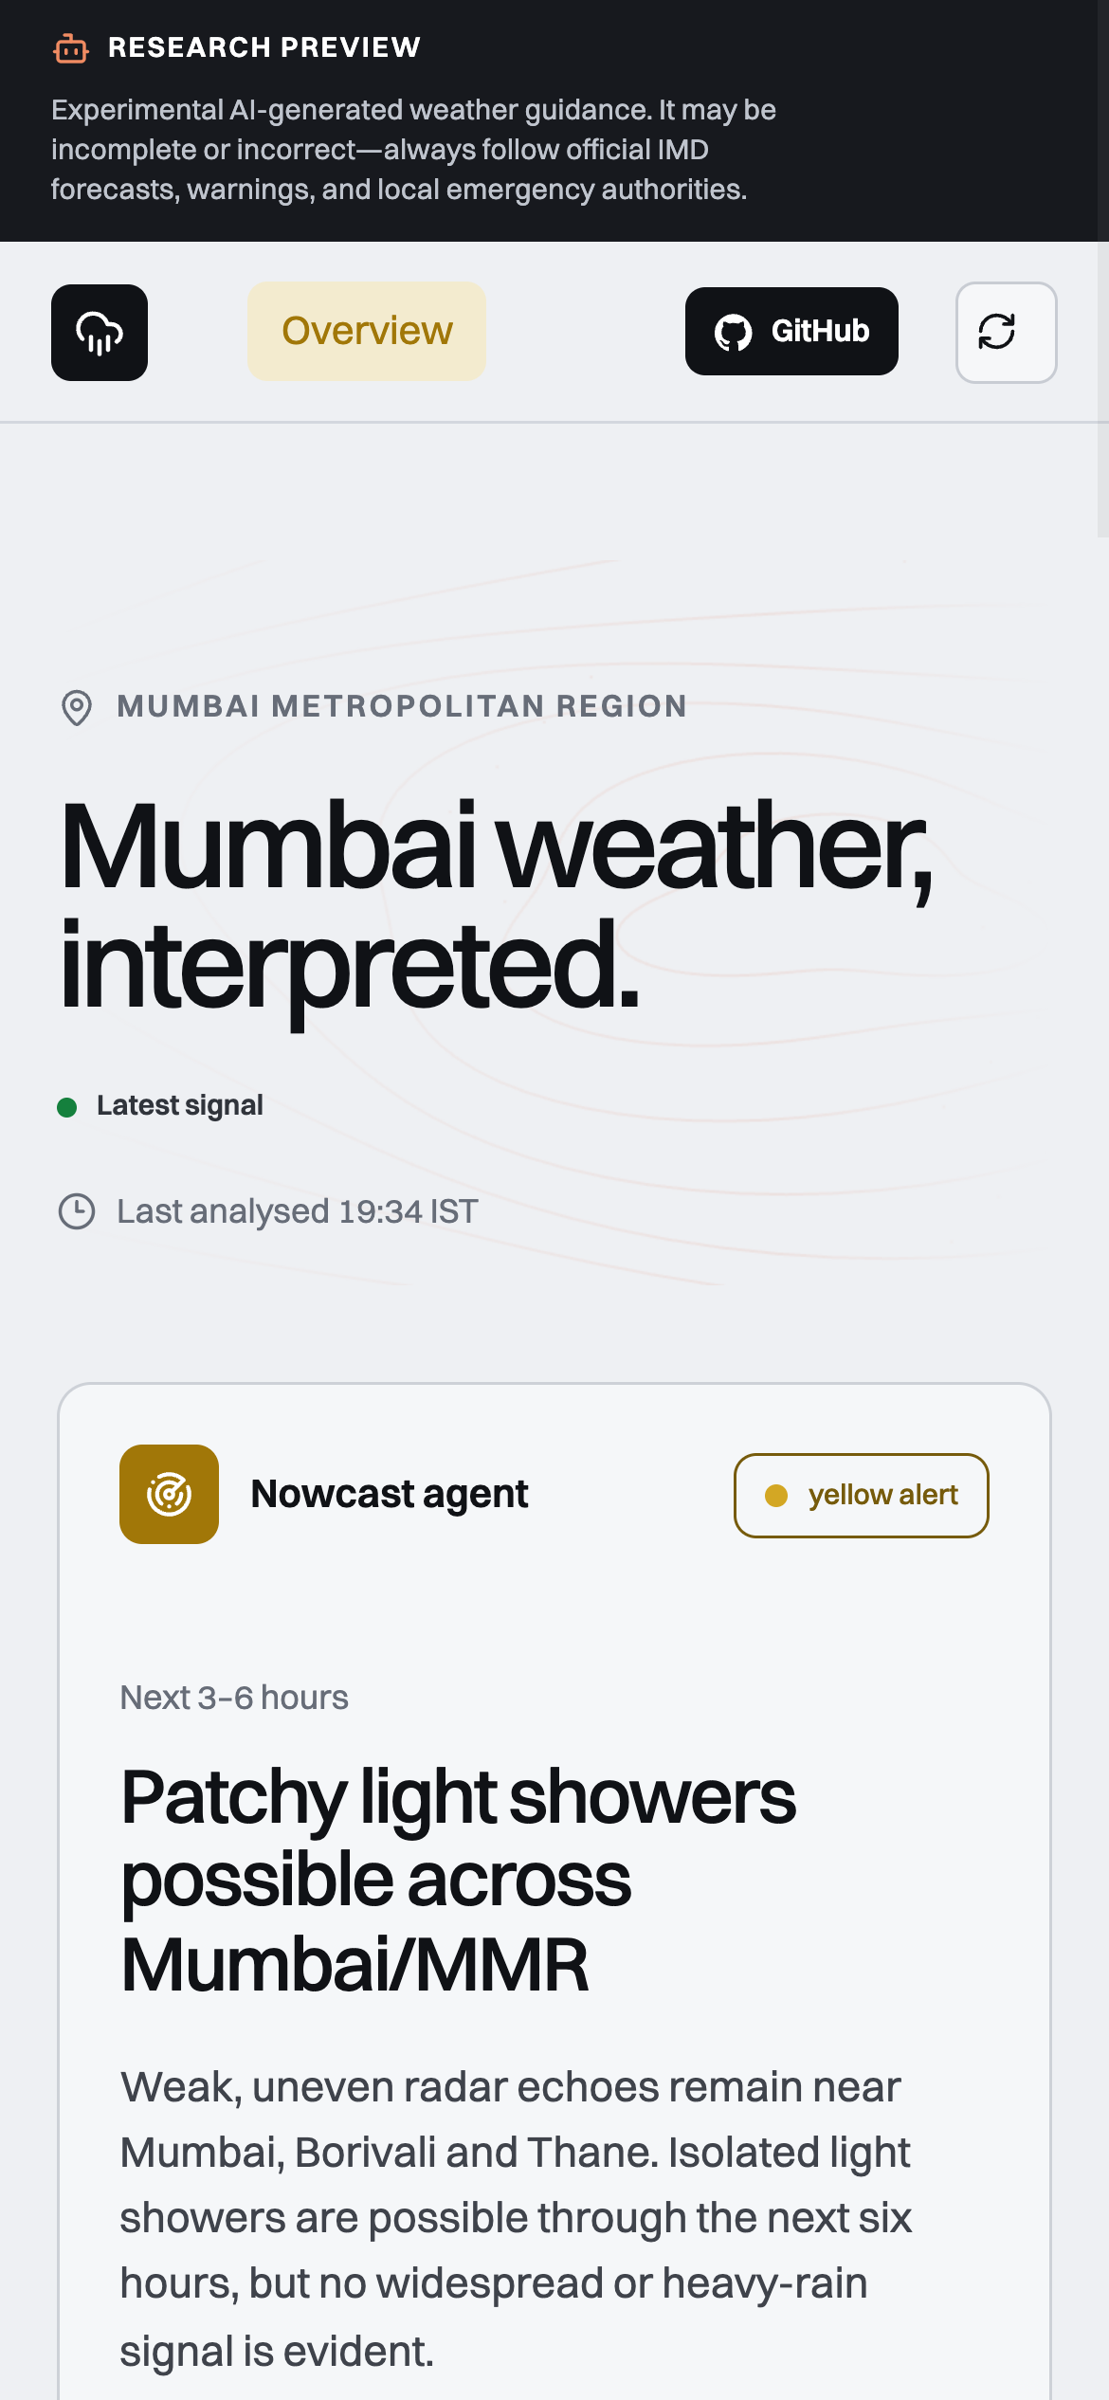
Mobile layout - Mausam on a phone-sized viewport, showing header and map
-
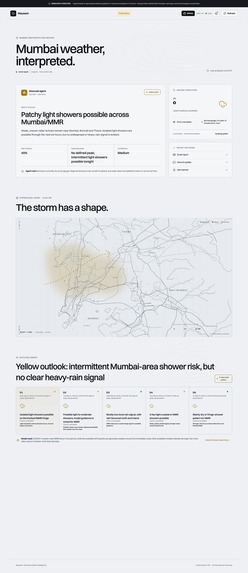
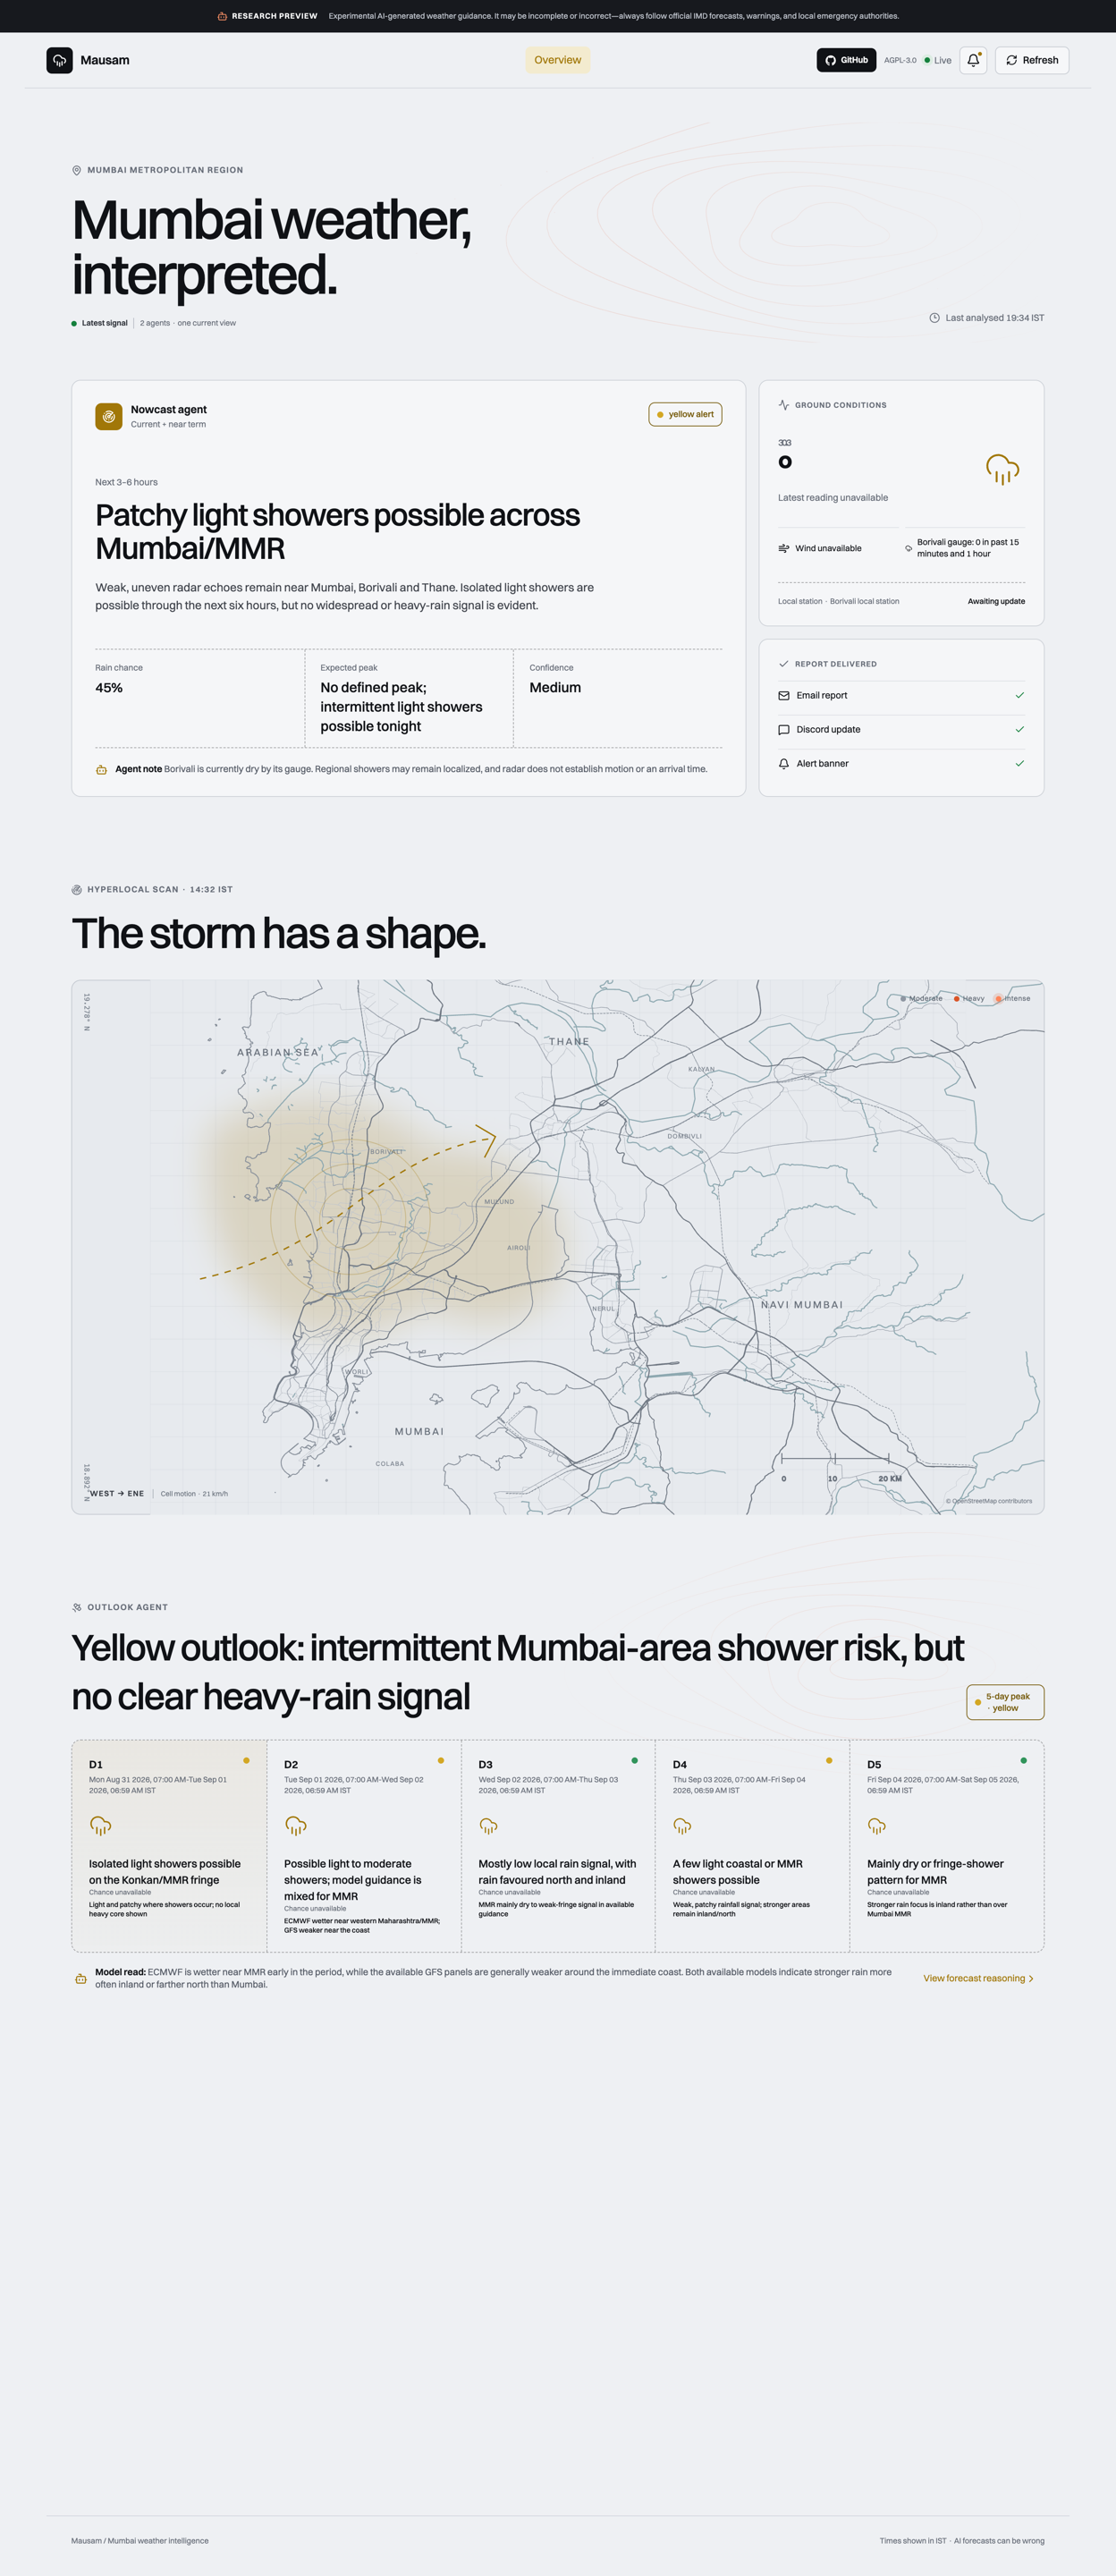
Full product page - End-to-end scroll of the Mausam site, from hero through map and supporting sections
-
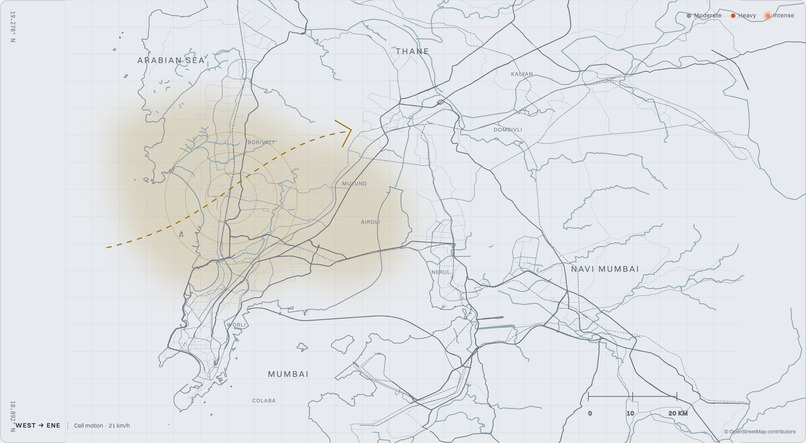
MMR rainfall map - Full Mumbai Metropolitan Region choropleth with locality labels and intensity legend
Mausam
Mausam (pronounced "mow-sum") is the Hindi word for weather or season.
I chose the name because this project grew out of Mumbai's unpredictable monsoon. In Hindi, people often ask, "Mausam kaisa hai?", or "How is the weather?" My project tries to answer the more useful version of that question: What changed? Where is the rain moving? Does Borivali face the same risk as the rest of Mumbai? Is this worth interrupting someone for?
Inspiration
Mumbai's weather rarely behaves like a simple forecast.
During the monsoon, the sky can change within minutes. One suburb may get intense rain while another stays almost dry. A forecast that says "rain in Mumbai" may be technically correct and still be useless to someone deciding whether to leave home.
That gap inspired Mausam. It watches several sources, compares new evidence with the last report, and sends an update only when something has changed.
I started with one question:
Can I build a weather service that remains alert without becoming noisy?
What it does
Mausam produces two complementary weather reports for Mumbai:
- A near-term nowcast covering approximately the next three to six hours.
- A five-day outlook comparing GFS and ECMWF forecast models.
The primary nowcast combines:
- IMD PPI-Z and SRI radar frames;
- Windy rain-accumulation imagery;
- short-range GFS and ECMWF frames;
- readings from Borivali and Kandivali East;
- scraped rain statistics;
- local weather-station observations; and
- the previous report’s state.
It evaluates Borivali separately from the wider Mumbai Metropolitan Region because rainfall can vary significantly across the city.
The five-day pipeline compares GFS and ECMWF at five forecast horizons:
$$ 2\ \text{models} \times 5\ \text{horizons} = 10\ \text{forecast frames} $$
Mausam delivers the result through email, Discord, a local alert banner, and an Astro website. It also chooses when to check again. Dangerous conditions get a faster follow-up; stable conditions can wait.
The website also exposes three read-only WebMCP tools:
get_weather_nowcastget_weather_outlookget_forecast_reasoning
A compatible browser agent can call these tools to read the forecast as structured data instead of scraping the page.
How I built it
I built Mausam over five months with Bun and TypeScript. Each month solved a problem that appeared once the previous version started running in real conditions.
April: Building the evidence pipeline
The first version downloaded radar images and stored them in S3-compatible object storage. I wrote utilities to find the latest image, convert it to a compact JPEG, compare it with the previous frame, upload new evidence, and safely remove old objects.
That led to the rule at the center of the project:
$$ \text{Analyse} = \begin{cases} 1, & \text{if evidence changed} \ 1, & \text{during the morning guarantee} \ 0, & \text{otherwise} \end{cases} $$
Weather sources often publish the same frame more than once. Analysing every copy would waste multimodal model calls and send repetitive notifications. Mausam compares the image bytes first. A morning exception still guarantees one baseline report each day.
Once that worked, I connected the images to a multimodal weather agent. I added rain observations, local station data, saved summaries, email delivery, Telegram alerts, and BullMQ scheduling around it.
By the end of April, Mausam had evolved from an image-processing script into a continuously scheduled weather service.
May: Making scheduling dependable
In May, I focused on the less exciting part that decides whether an automated service survives: failure handling. The pipeline schedules another attempt when a source fails or an image has not changed. Active-hour checks stop jobs from running at unsuitable times, while severity-based delays revisit urgent conditions sooner.
This was when scheduling became part of the weather decision rather than a fixed cron interval.
June: Adding rendered maps and Discord
Some weather sources do not provide a direct image. Windy renders its accumulation map inside a web application.
I added Puppeteer to open the page, wait for the weather layer, take a controlled screenshot, and pass it through the same pipeline as a downloaded image. A shared ingestion helper means the rest of the application does not need to know where an image came from.
Discord replaced Telegram as the technical reporting channel. A separate gRPC integration handles delivery, so communication failures stay outside the weather analysis process.
I also added Uptime Kuma heartbeats and automatic startup jobs so Mausam could run unattended.
July: Expanding from hours to days
The original system only answered, "What happens over the next few hours?" In July, I added a second pipeline to answer, "What could the next five days look like?"
It finds the newest usable GFS and ECMWF runs, resolves changing Tropical Tidbits image URLs, and collects frames at approximately (+24), (+48), (+72), (+96), and (+120) hours.
All ten images are staged before analysis. If one required frame cannot be prepared, the incomplete set is removed instead of mixing different or partial model runs.
Running the system exposed another problem: a retry could repeat actions that had already succeeded. I strengthened the workflow with:
- Zod-validated configuration and model output;
- Redis-backed previous-report state;
- decision caching using evidence-derived run identifiers;
- delivery locks and completion markers;
- follow-up-job deduplication; and
- separation between queue construction and process side effects.
The model interprets uncertain weather evidence. Regular application code controls persistence, delivery, retries, and scheduling. This boundary keeps free-form model behavior away from side effects.
August: Building the web experience
In August, I started retaining the two newest frames from each primary source. A pair of images shows basic movement and development that one snapshot cannot.
I also compressed primary evidence to reduce multimodal input cost. The estimated image-token load fell from roughly 50,000 tokens in the earlier high-frame case to around 7,500:
$$ 1-\frac{7{,}500}{50{,}000} =0.85 =85\% $$
I extended the agents with structured website fields and Zod validation. Using bun:sqlite, I persist nowcasts and outlooks for an Astro and React frontend. The stored data includes separate Borivali and Mumbai/MMR alert levels, headlines, rain probability, peak timing, confidence, station observations, source summaries, daily outlook cards, model comparisons, and detailed reasoning.
The website presents the current alert, local conditions, five-day forecast, source summaries, model comparison, and reasoning. I also integrated an interactive Mumbai Metropolitan Region map. It connects report data to localities and visualizes alert severity, rain intensity, forecast movement, and differences across the region.
The last addition was WebMCP. When a browser exposes document.modelContext, the React application registers three focused, read-only weather tools. Each returns bounded structured data and labels the result as AI guidance.
Browsers without WebMCP still receive the complete website, making agent interaction a progressive enhancement rather than a dependency.
The full path now looks like this:
$$ \text{Weather sources} \rightarrow \text{Evidence pipeline} \rightarrow \text{Structured reasoning} \rightarrow \text{Reliable delivery} \rightarrow \text{Web experience} \rightarrow \text{WebMCP interaction} $$
Challenges I ran into
Inconsistent weather sources
Some sources provide files. Others need browser rendering. Forecast URLs change with model initialization times, and station or rain-statistics endpoints can fail on their own.
I wrote source-specific resolvers behind one ingestion interface. A missing required radar frame stops the run. An optional source can fail without taking the whole forecast down, and Mausam uses retained evidence where appropriate.
Detecting real changes
A newly published file does not always contain new weather. Running the agent on identical frames would consume resources and wear out the person receiving alerts.
Exact byte comparison is predictable, but it has a trade-off: an encoding change can look new to the system even when the two images look identical to a person.
Preventing duplicate alerts
A run may successfully send an email and then fail while posting to Discord. Retrying the entire workflow could send the email twice.
Evidence-derived run IDs, a Redis decision cache, per-action locks, completion markers, and a fixed delivery sequence solve this. A retry reuses the validated decision and continues from the unfinished action.
Representing Mumbai accurately
Mumbai cannot be treated as one weather point. Regional conditions may not match what is happening in Borivali or another locality.
I split the assessment into Borivali and Mumbai/MMR severity. A broad regional warning no longer becomes a local alert without evidence for that locality.
Communicating uncertainty
GFS and ECMWF frequently disagree, especially several days into a forecast. Hiding this disagreement behind one confident statement would make the output less trustworthy.
The outlook keeps the model comparison, disagreement, confidence, and dated reasoning next to the public summary.
Accomplishments that I’m proud of
The production record is the part I am proudest of. Mausam:
- produced 392 reports across 63 recorded monsoon days;
- generated 343 primary nowcasts and 49 five-day outlooks;
- analyses evidence only when it changes or a daily baseline is required;
- distinguishes local Borivali risk from wider Mumbai/MMR conditions;
- combines visual forecasts with ground observations;
- tolerates optional-source failures without inventing missing evidence;
- safely resumes interrupted deliveries without duplicating completed actions;
- reduced estimated multimodal image-token usage by approximately (85\%);
- serves the same structured forecast through alerts, email, Discord, and the web; and
- makes its forecast directly accessible to browser agents through WebMCP.
Describing a radar image was the easy prototype. The harder achievement was building the system around the model: deciding when analysis is necessary, preserving evidence, validating the result, delivering it safely, and recovering after a failure.
What I learned
I expected most of the work to be prompt engineering. It was not. The difficult work was managing the evidence before the model call and controlling every action after it.
My most important lessons were:
- Freshness must be measured rather than assumed.
- Visual evidence becomes more useful when combined with ground observations.
- Optional sources should improve a forecast without controlling its availability.
- Structured output is essential when model decisions feed application behavior.
- Models should interpret uncertainty; deterministic code should own side effects.
- Reliable retries require idempotency, not simply another attempt.
- Forecast disagreement should be communicated instead of hidden.
- Local and regional risk must remain distinct.
- The same structured data can serve people, applications, and AI agents.
The most useful product lesson was that silence can be a feature. If the evidence has not changed, the best notification is often no notification at all.
What’s next for Mausam
My next priorities are:
- replace the build-time website snapshot with live report updates;
- add more rain gauges and local weather stations across the MMR;
- introduce perceptual image comparison alongside exact byte matching;
- visualize radar movement and report-to-report changes on the map;
- preserve delayed queue jobs safely across process restarts;
- add stronger automated deployment and operational testing;
- track forecast accuracy against later station observations;
- expose source timestamps and confidence changes more clearly;
- expand WebMCP with locality-specific, read-only queries; and
- investigate personalized alerts based on commute, location, and risk tolerance.
Mausam does not replace IMD warnings or official emergency guidance. It gives people and browser agents a local, evidence-based view of what changed and why the forecast changed with it.
Built With
- amazon-web-services
- astro
- bun
- cloudflare
- codex
- grpc
- langchain
- react
- s3
- typescript
- webmcp


Log in or sign up for Devpost to join the conversation.