Inspiration
Constantly imagining and manipulating 3D mathematical structures in our heads for class was a bit cumbersome. We believed that if we had a tool like this, our experiences might ease up a bit.
What it does
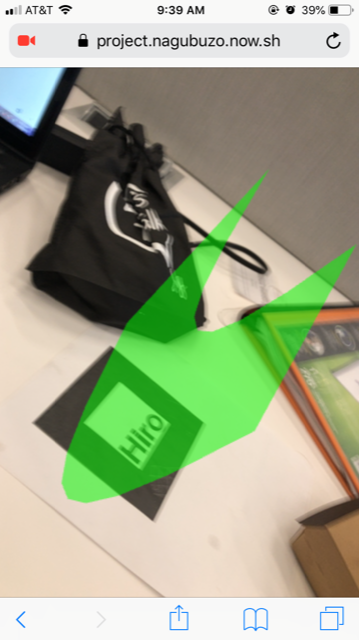
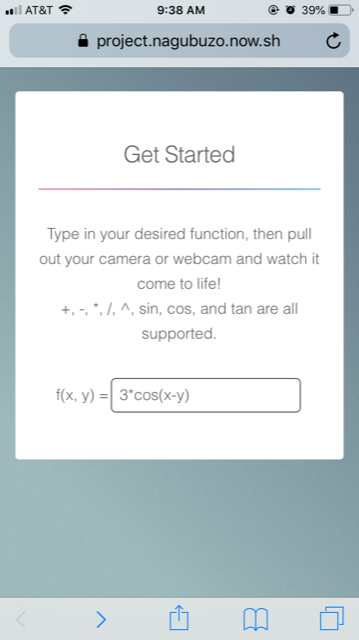
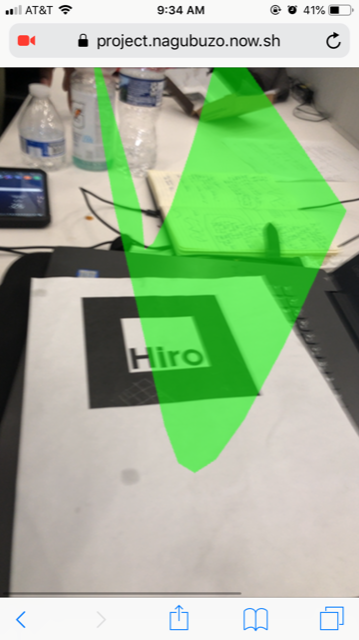
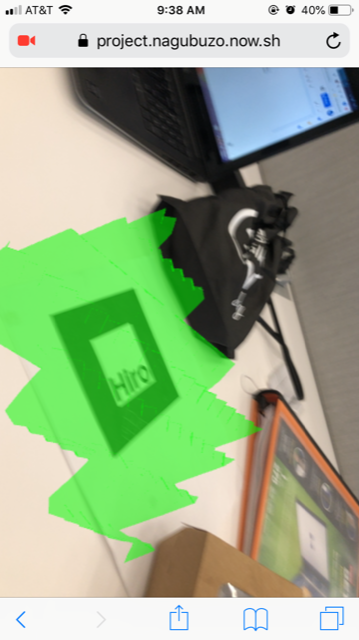
After the user enters in a function, the solution creates a 3D visualization of the function and imposes it on a camera feed. This results in a 3D math graph appearing as if it was in real life.
How we built it
The technologies we used were JavaScript, HTML, and CSS. We also made use of helpful libraries such as Three.js and Ar.js.
The main components of the app are:
-a string parser, which receives input from the user and formats it;
-a calculator, which used the string parser info to calculate points on the graph;
-a grapher, which creates a 3D scene, plots the points and creates a mesh; and
-augmented components, which creates the augmented affect
Challenges we ran into:
 -Getting different functions and libraries to work  together
 -Creating a function to make a mesh based of the points
 -Security Issues
 -Styling
Accomplishments that we're proud of
 Getting the project done
 getting the functions to work together
 Mesh and rendering components producing proper output
What we learned
  JavaScript
 Web Development
 Augmented Technologies
 Business Concepts
What's next for Math IRL
 Advance features
 International distribution

Log in or sign up for Devpost to join the conversation.