-
-
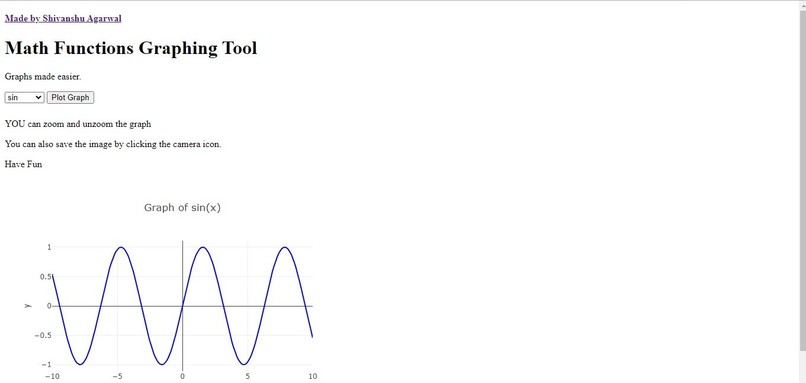
screenshot of our website(1)
-
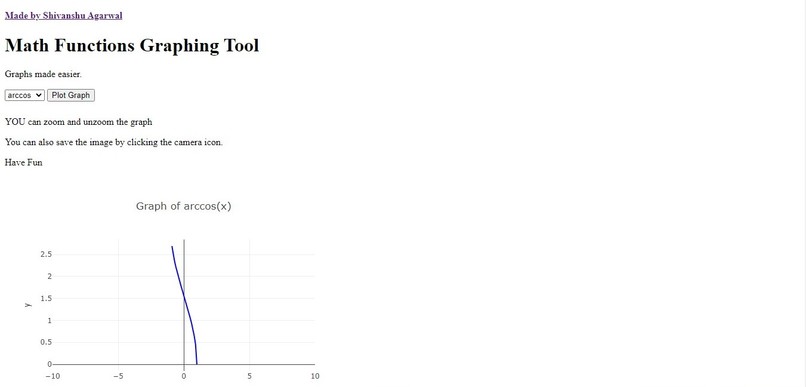
screenshot of our website(2)


Inspiration
Our project is a Math Function Graphing Tool that allows users to visualize and explore various mathematical functions. The inspiration behind this project came from the desire to create a tool that would make it easy for users to interactively plot and study mathematical functions.
What it does
Our Math Function Graphing Tool is a powerful web-based application that allows users to visualize and analyze various mathematical functions. With this tool, users can explore functions such as trigonometric, logarithmic, inverse trigonometric, and more, by plotting them on an interactive graph.
The tool offers a user-friendly interface where users can select their desired function from a dropdown menu. Upon selecting a function, the graph is dynamically updated to display the plot of the chosen function. This interactive graph allows users to zoom in, zoom out, pan, and explore different sections of the graph with ease.
Users can also customize the appearance of the graph by adjusting the colors, line styles, and other visual elements. The tool provides options to label the x-axis and y-axis, making it easier to understand the plotted function in the context of its variables.
One of the notable features of our Math Function Graphing Tool is its versatility. It supports a wide range of mathematical functions, enabling users to study and compare different functions on a single platform. Whether it's analyzing periodic behavior, studying exponential growth, or investigating the behavior of inverse functions, this tool provides a comprehensive platform for visualizing and understanding mathematical concepts.
The Math Function Graphing Tool is designed to be accessible and user-friendly for students, educators, researchers, and anyone interested in exploring mathematical functions. By providing an interactive and intuitive environment, it facilitates a deeper understanding of mathematical concepts and enables users to make meaningful observations and discoveries.
With its robust functionality, user-friendly interface, and interactive graphing capabilities, our Math Function Graphing Tool is a valuable resource for anyone seeking to visualize, explore, and gain insights into mathematical functions.
How we built it
Throughout the development process, we learned a great deal about web development, including front-end and back-end technologies. We utilized HTML, CSS, and JavaScript for the front-end, while Node.js and Express.js were used for the back-end. Plotly.js library was used for creating the interactive graphs.
Building the project involved designing a user-friendly interface with a dropdown menu for function selection and a graph container to display the plots. The front-end code handled user interactions, such as selecting a function and triggering the graphing process. The back-end code served the static files and responded to requests from the front-end.
Challenges we ran into
One of the challenges we faced was integrating the Plotly.js library and generating the correct data for the selected function to plot the graphs accurately. We had to carefully map the x-values and calculate the corresponding y-values for each function. Additionally, ensuring smooth communication between the front-end and back-end was crucial to handle user input and update the graph accordingly.
Accomplishments that we're proud of
Throughout the project, we gained valuable experience in web development, improved our understanding of JavaScript libraries, and sharpened our problem-solving skills. We also learned about the importance of user interface design and creating interactive elements to enhance the user experience.
What we learned
Overall, our Math Function Graphing Tool project provided us with a hands-on learning experience and the opportunity to apply our knowledge to create a useful tool for exploring mathematical functions.


Log in or sign up for Devpost to join the conversation.