Inspiration
In 2026, 124 of the 150 MLB and affiliated Minor League clubs ran a Star Wars night. Clubs plan their seasons from a shared playbook, and the decisions that move the most money (which nights get fireworks, which brands to pitch, which local businesses to partner with) get made from habit and last year's calendar. I wanted a desk that answers those three questions for one specific club, from what its city and its fans actually like and from what promotions have measurably done to attendance.
What it does
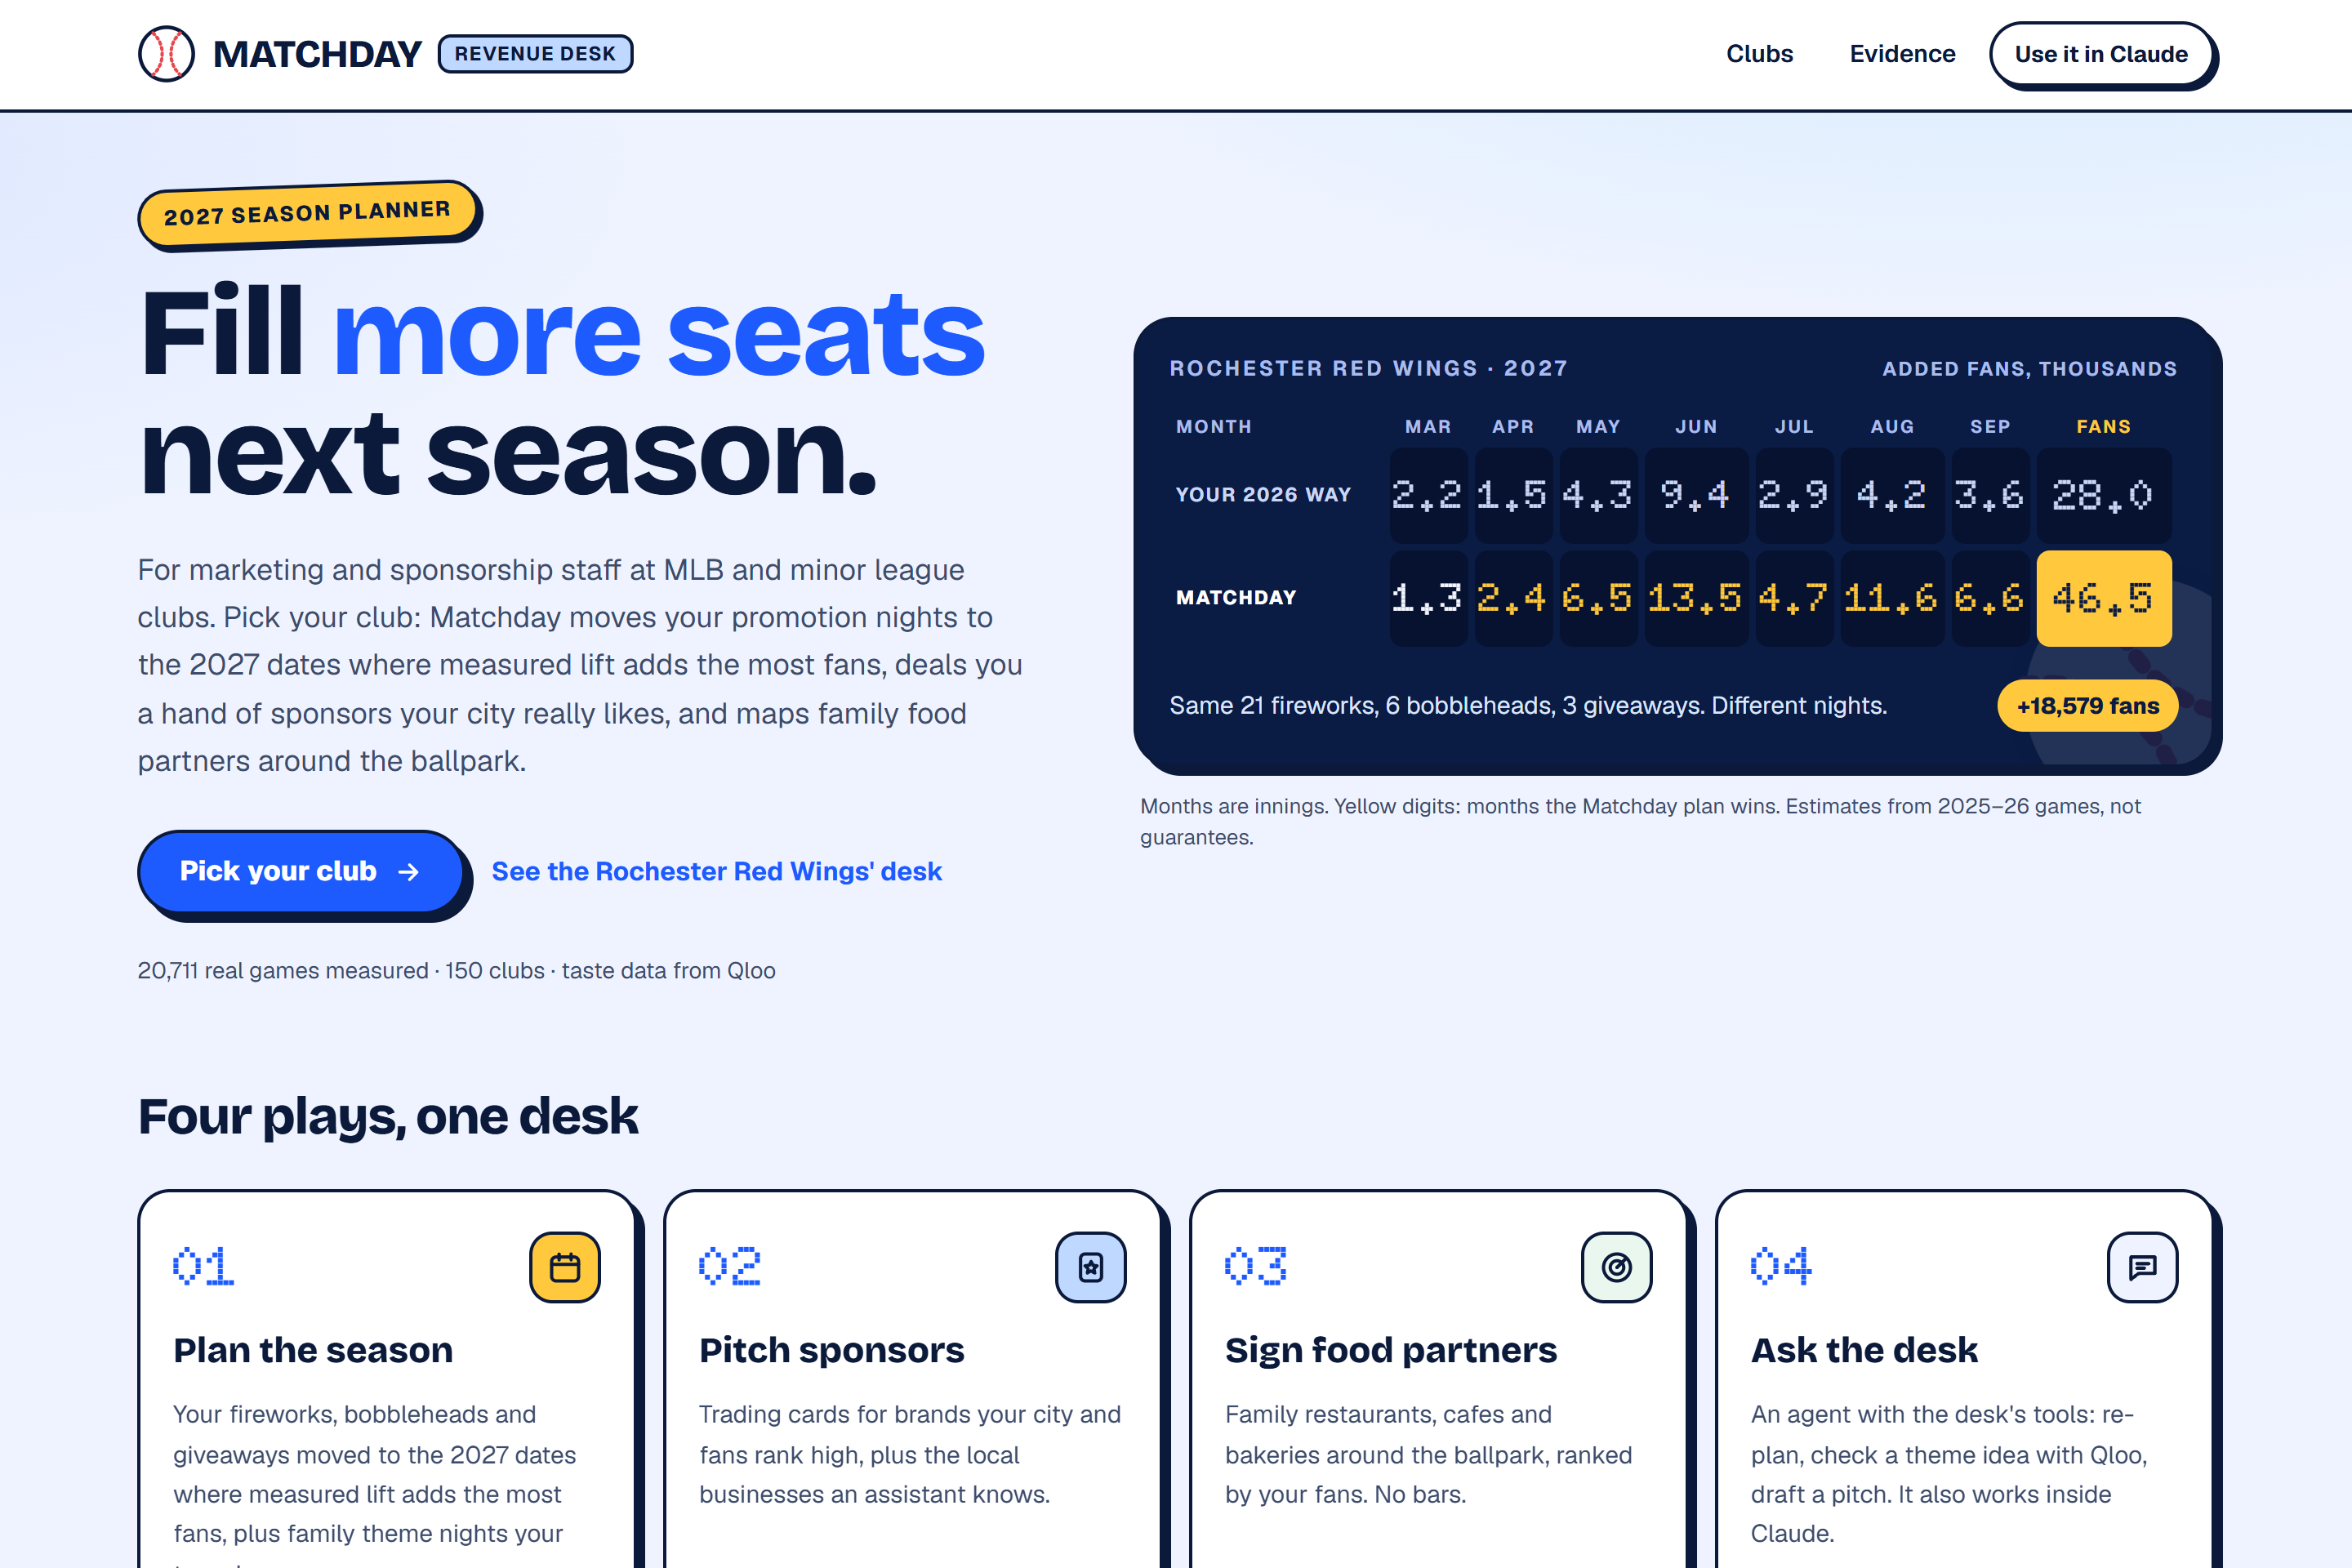
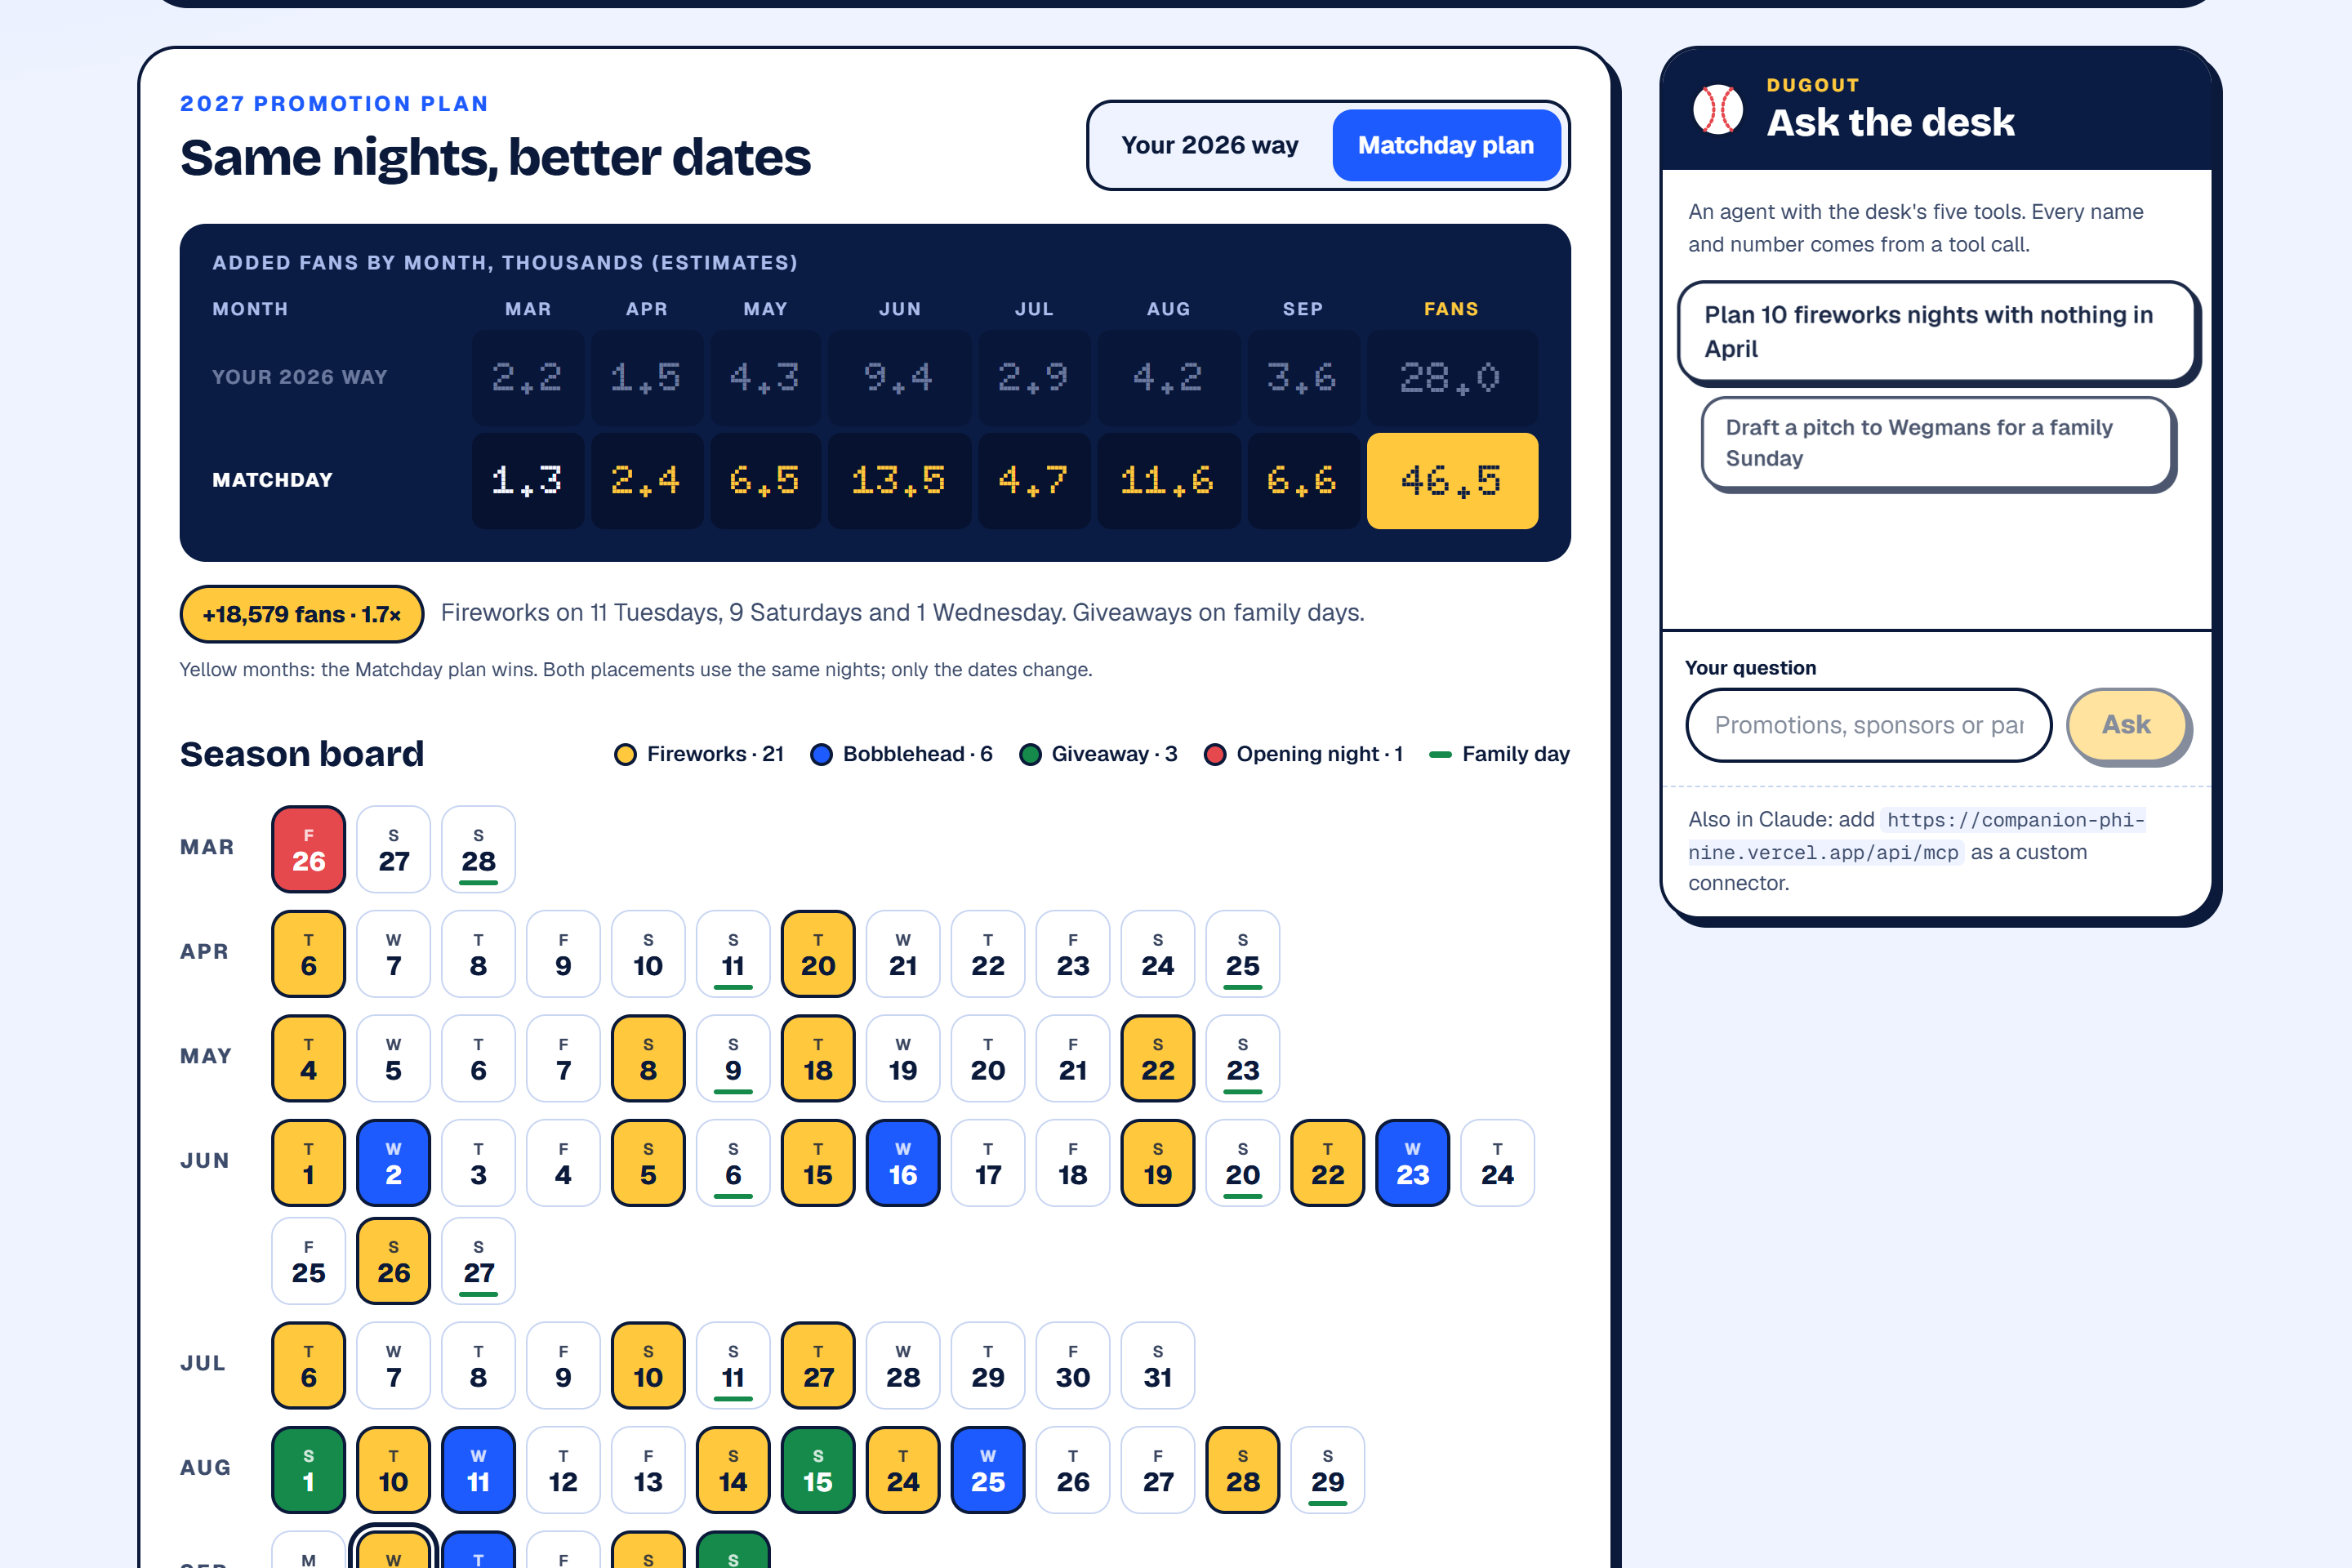
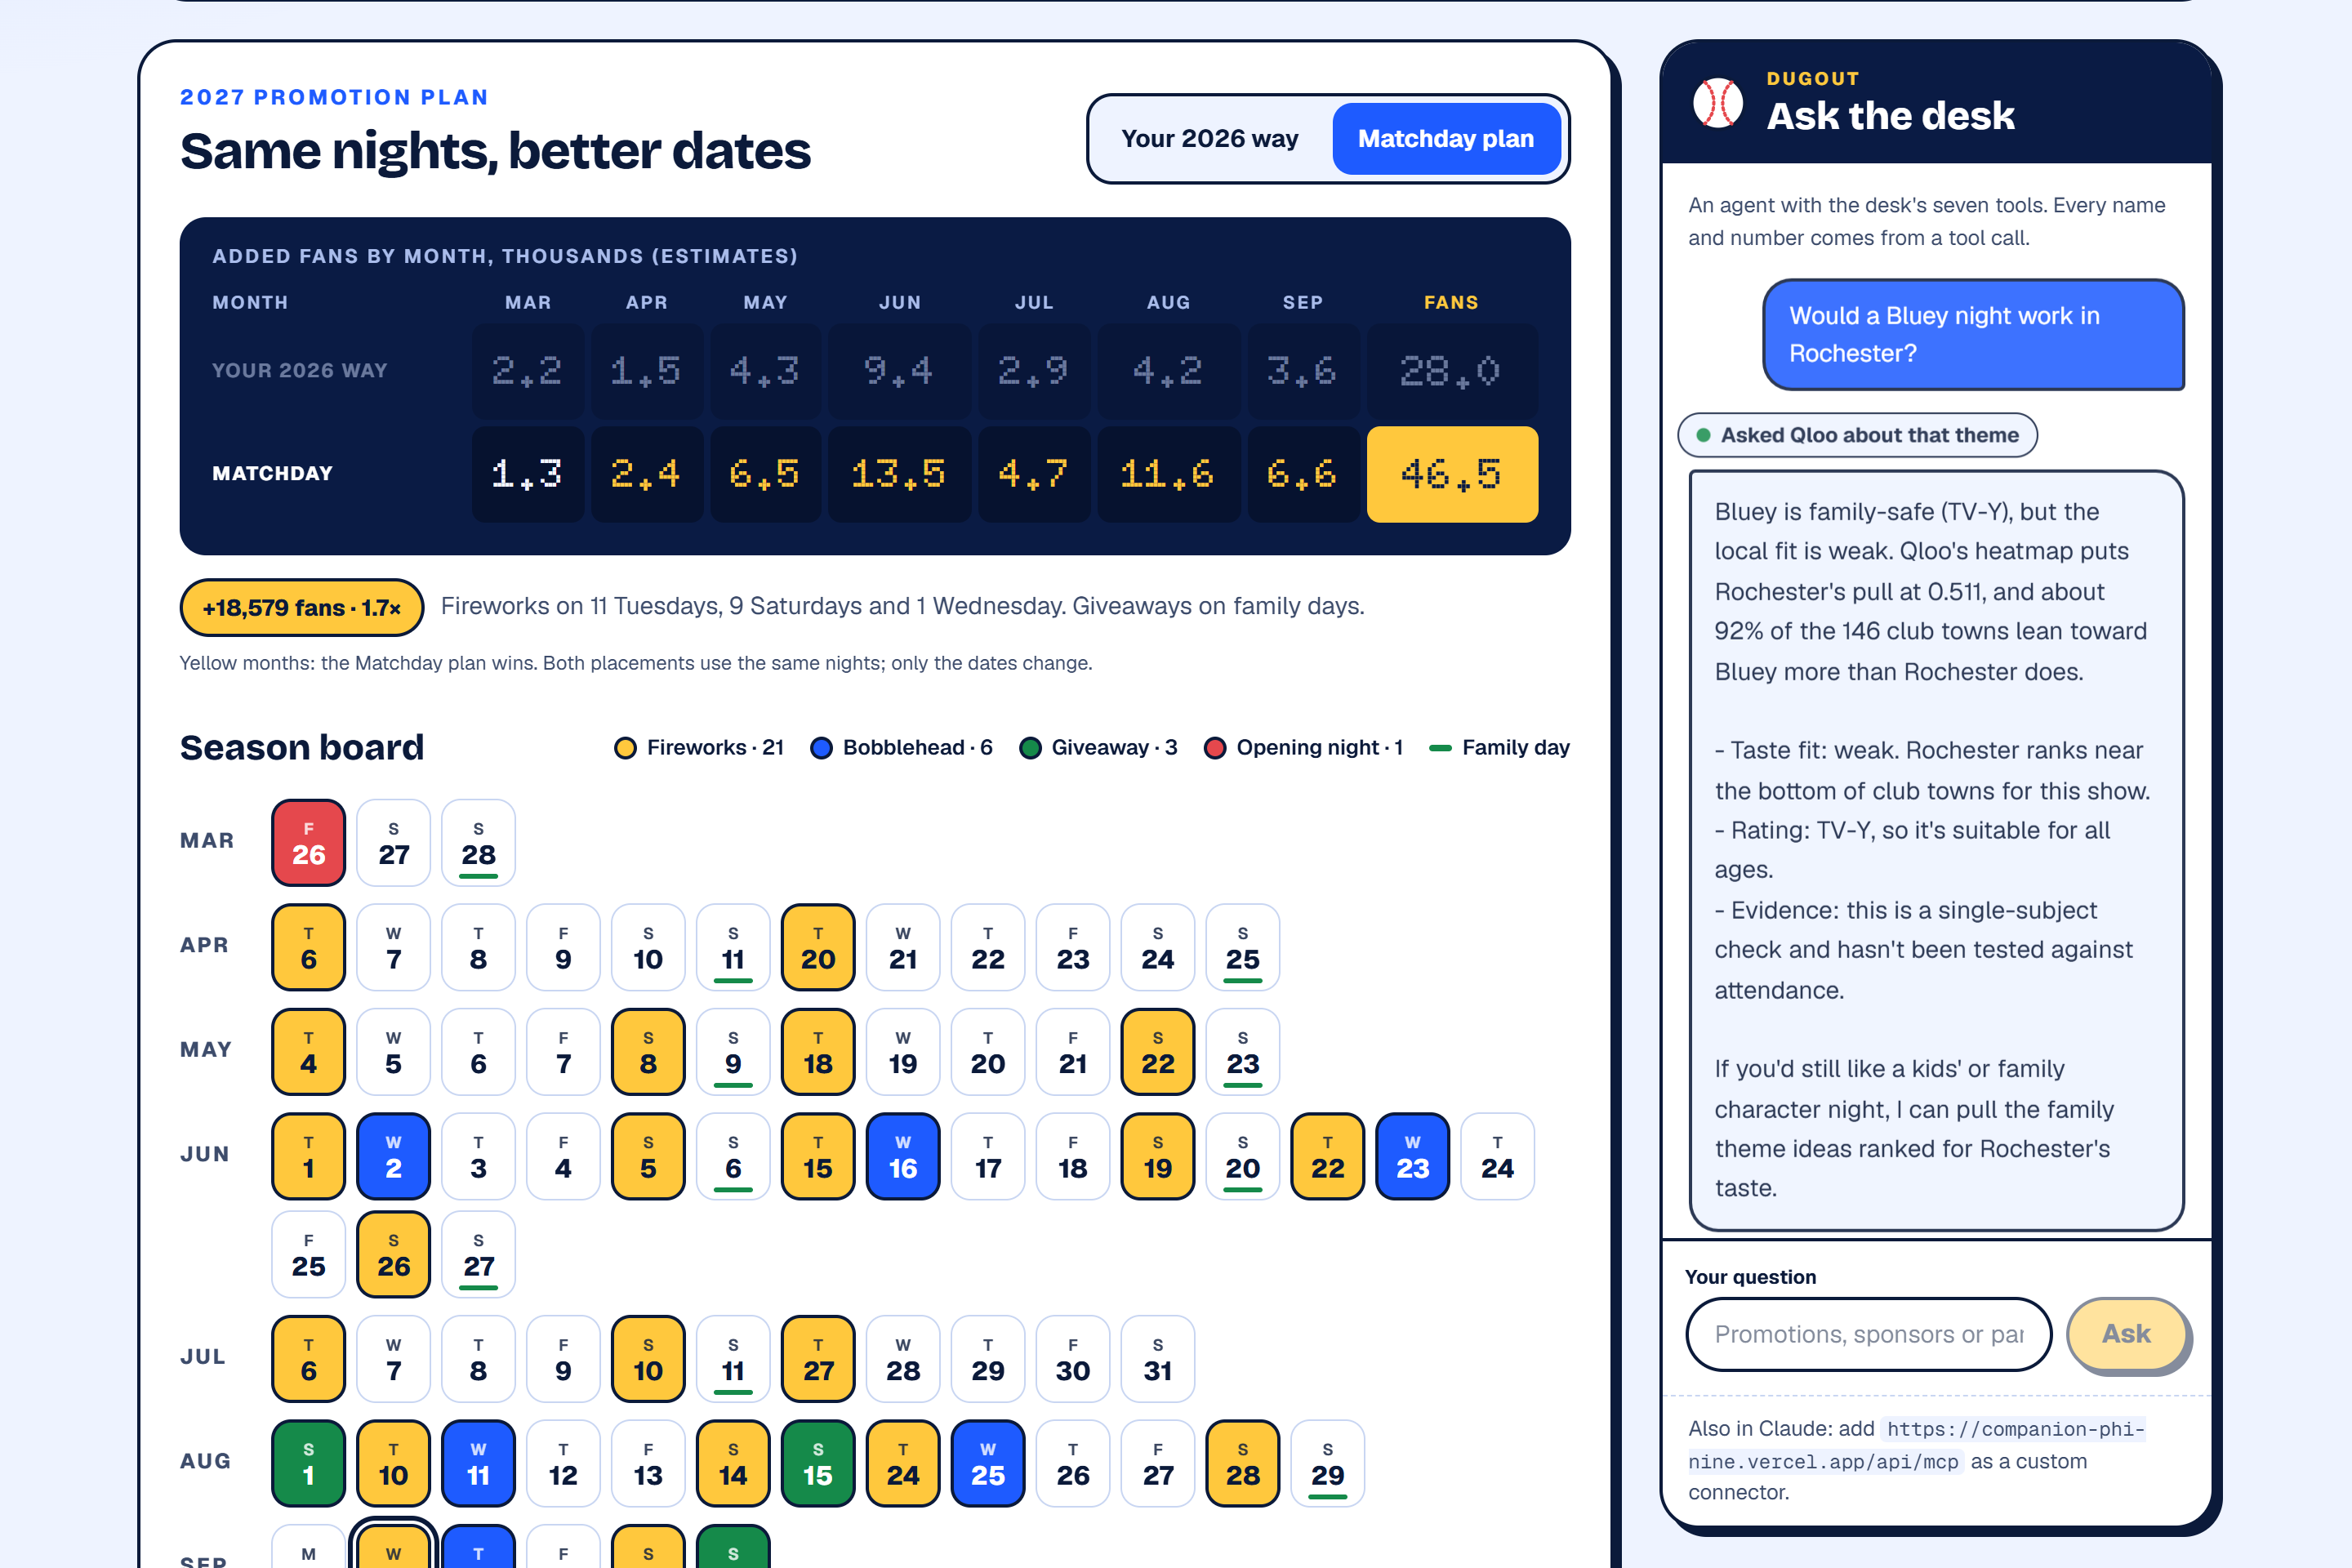
Pick any of the 150 clubs. The desk keeps the club's own promotion mix and moves each night to the 2027 home date where measured lift adds the most fans, then compares that with the same nights on the weekdays the club used in 2026. For the Rochester Red Wings, the same 21 fireworks nights, 6 bobbleheads and 3 giveaways add an estimated 46,500 fans across the season, against 28,000 the club's way.
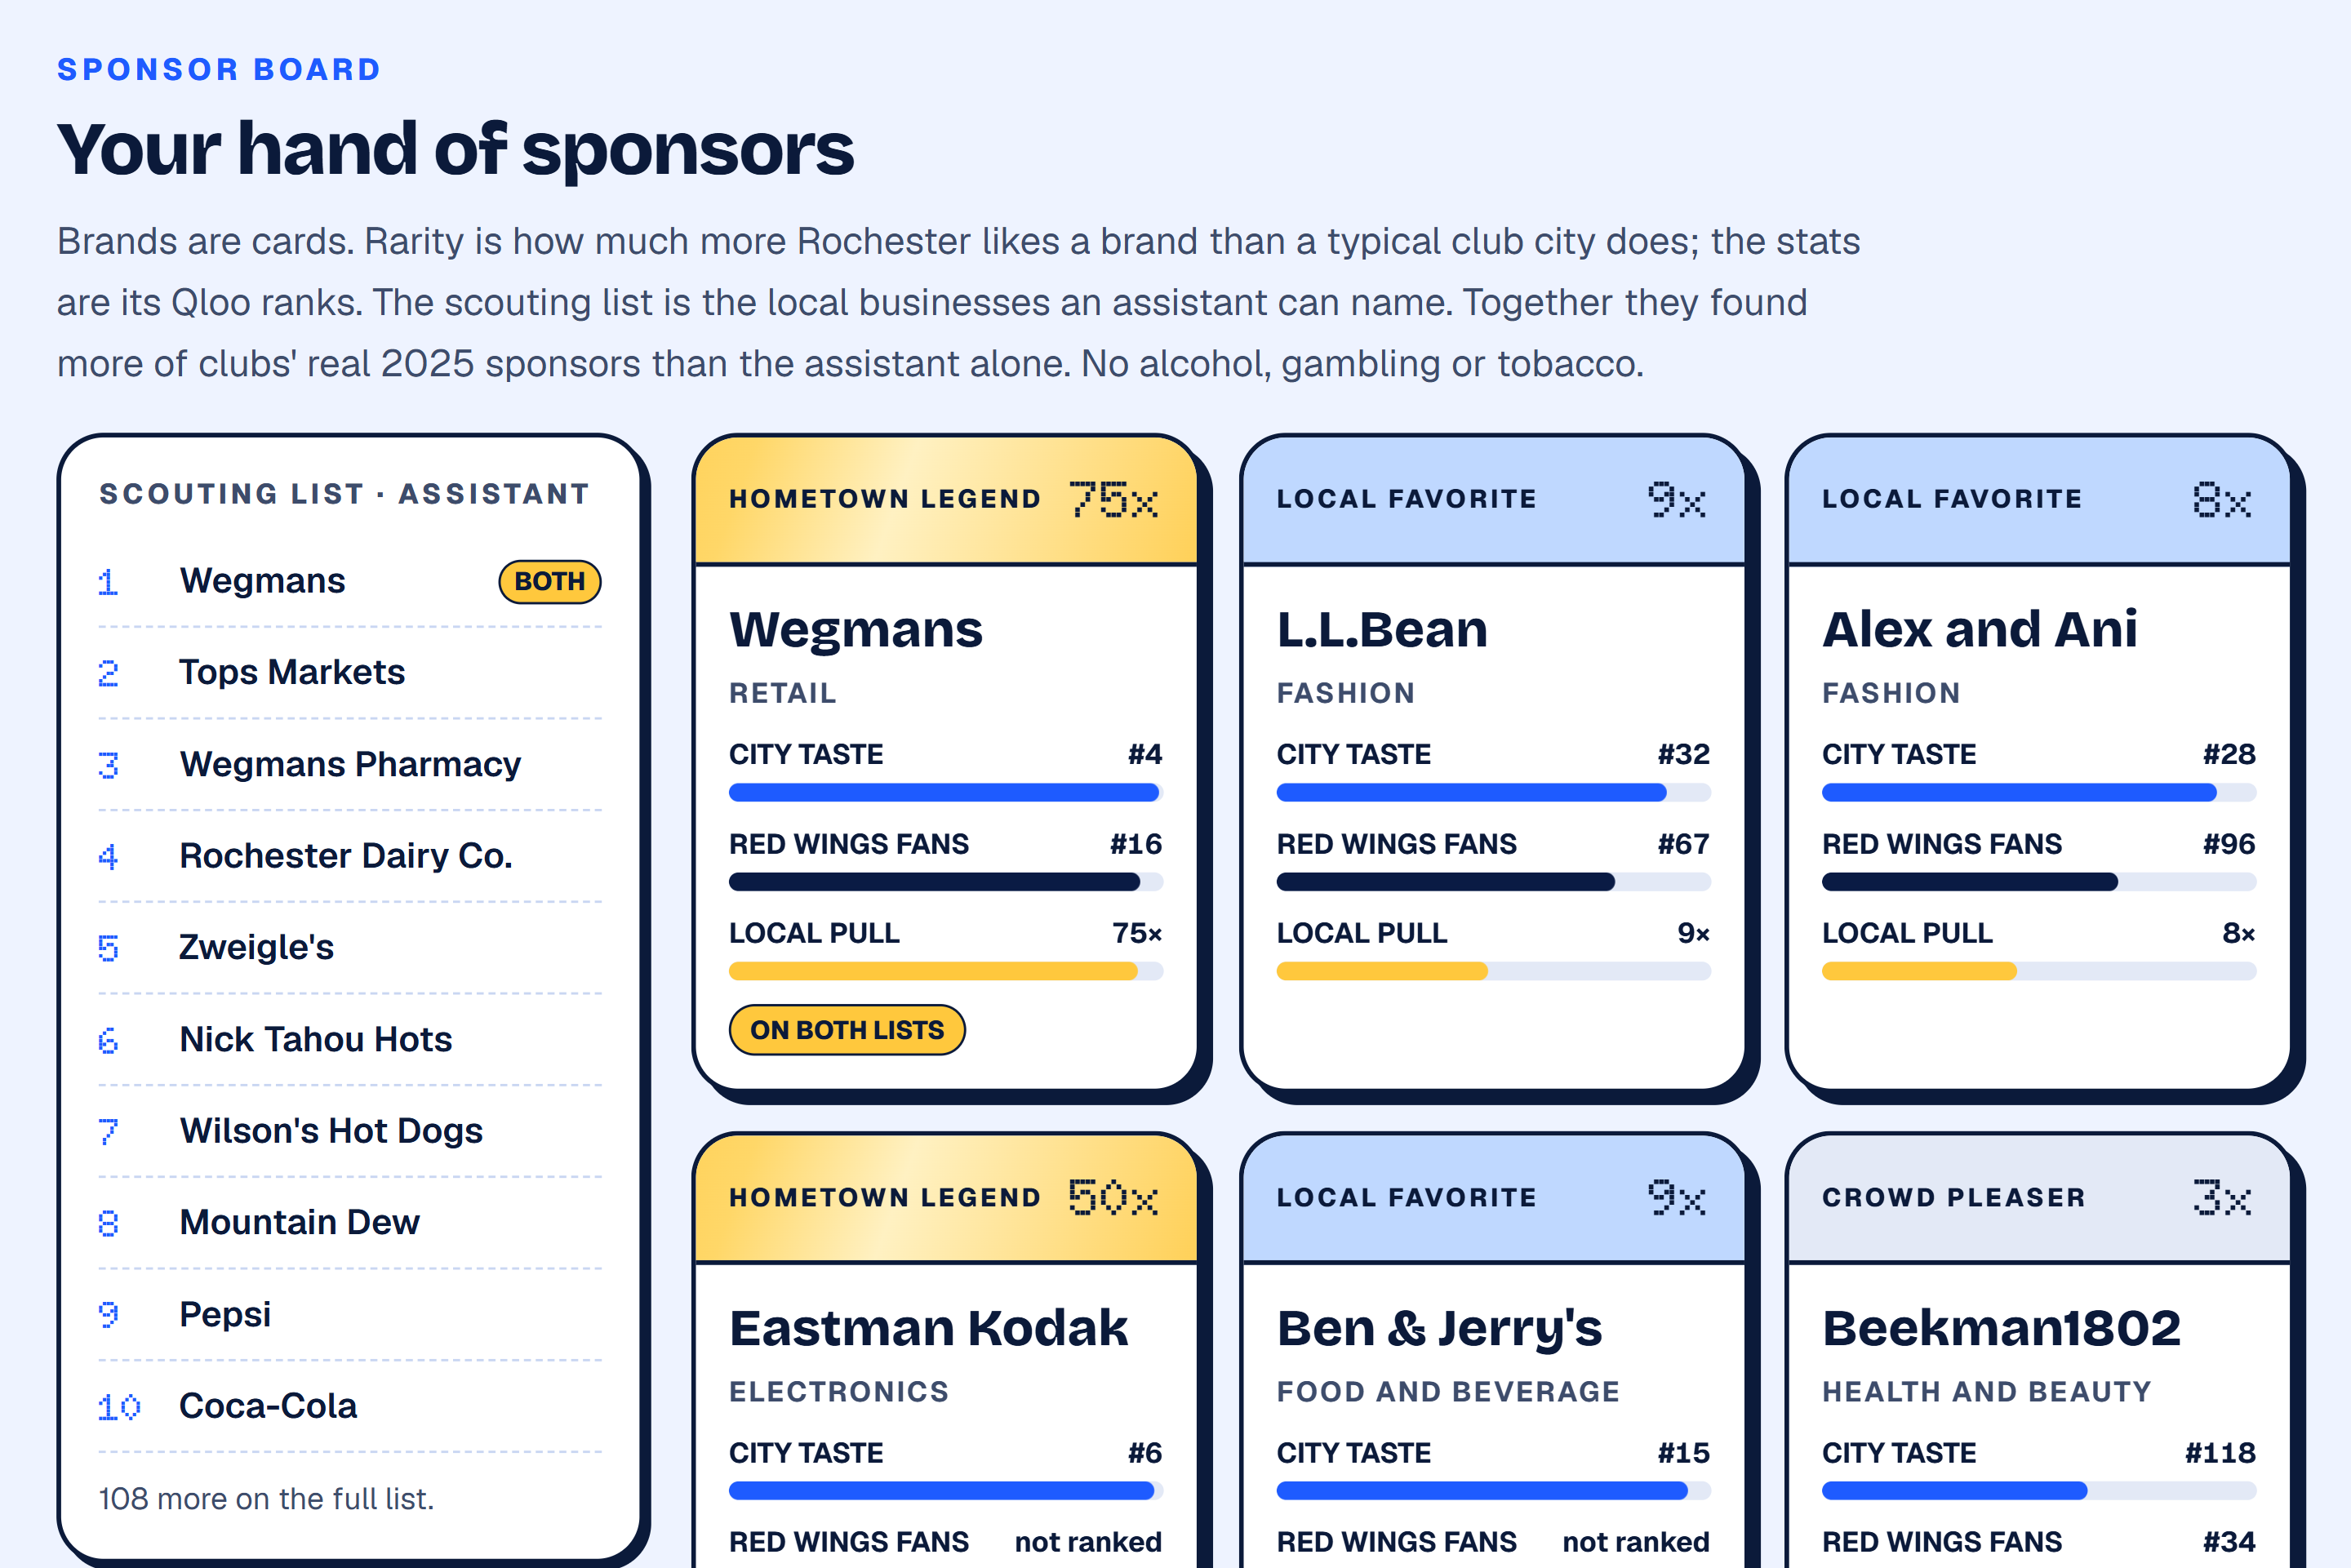
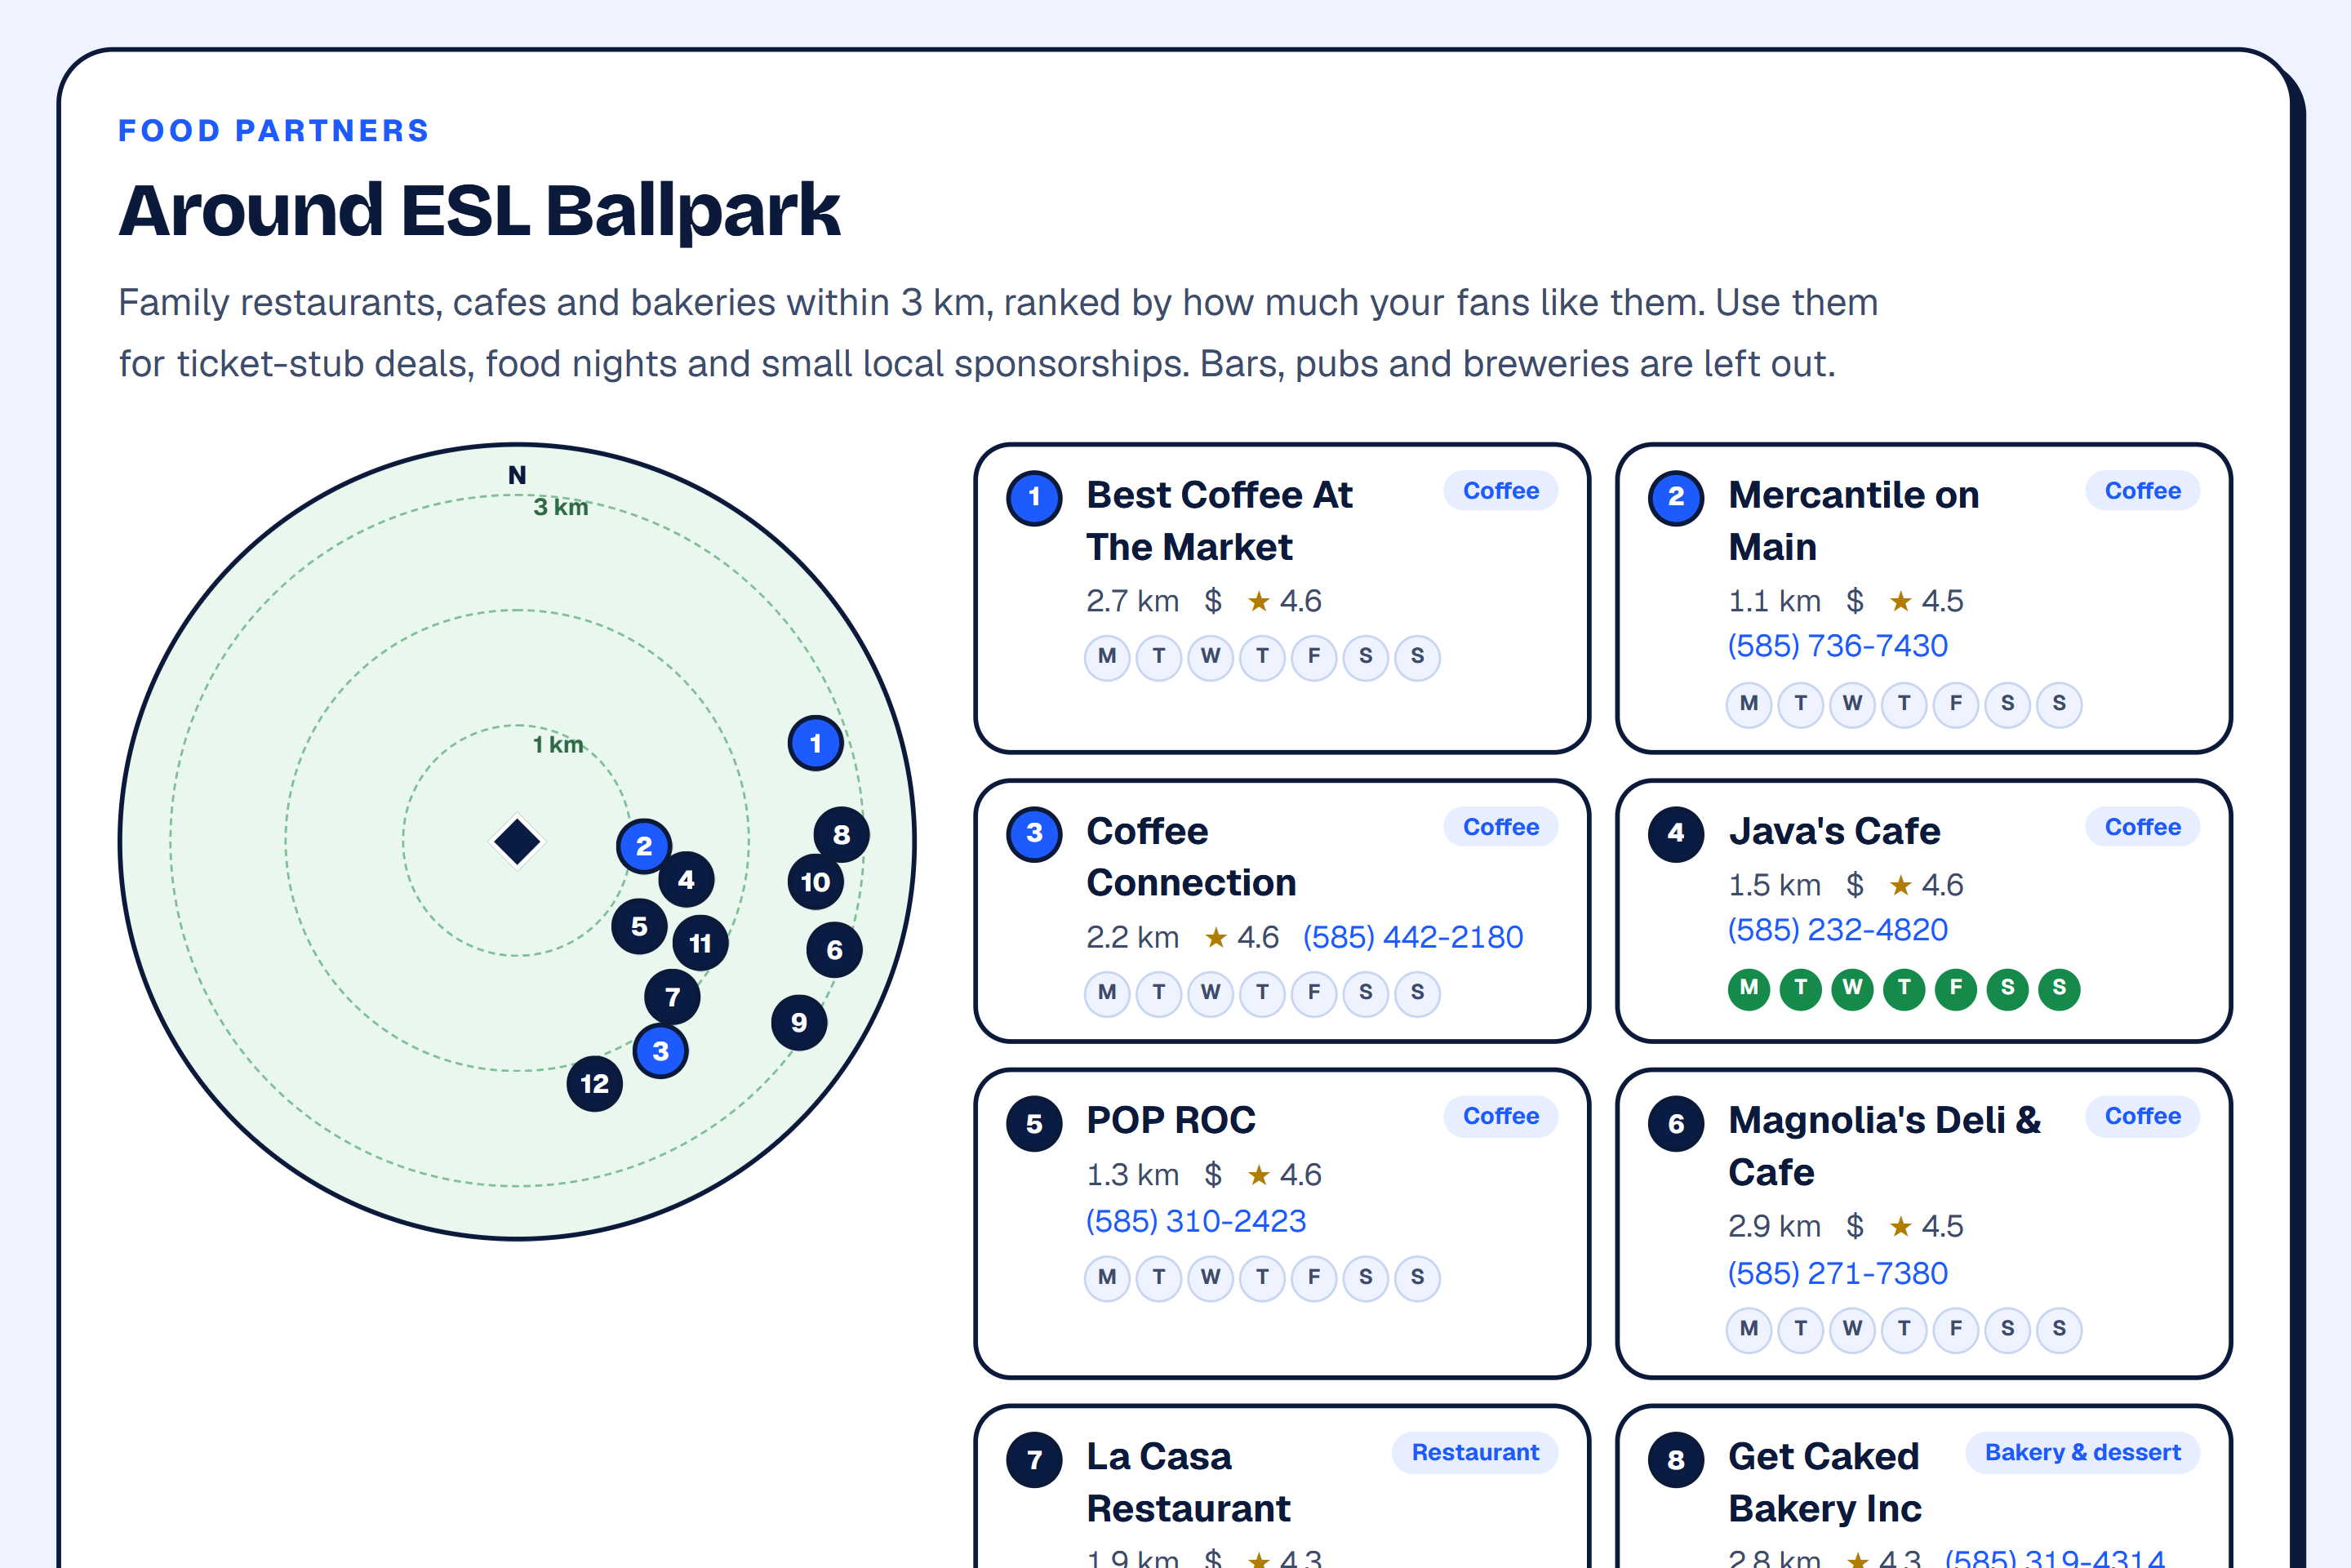
It deals a hand of sponsor cards: brands Qloo ranks high for the club's city and for its fan base, each showing how much higher the brand ranks in this city than in a typical club city. Wegmans, for example, ranks 75 times higher in Rochester. Next to the cards is a scouting list of the local businesses an AI assistant can name. It maps family restaurants, cafes and bakeries within 3 km of the ballpark, ranked by how much the club's fans like them and checked against night-game hours, with bars and breweries left out.
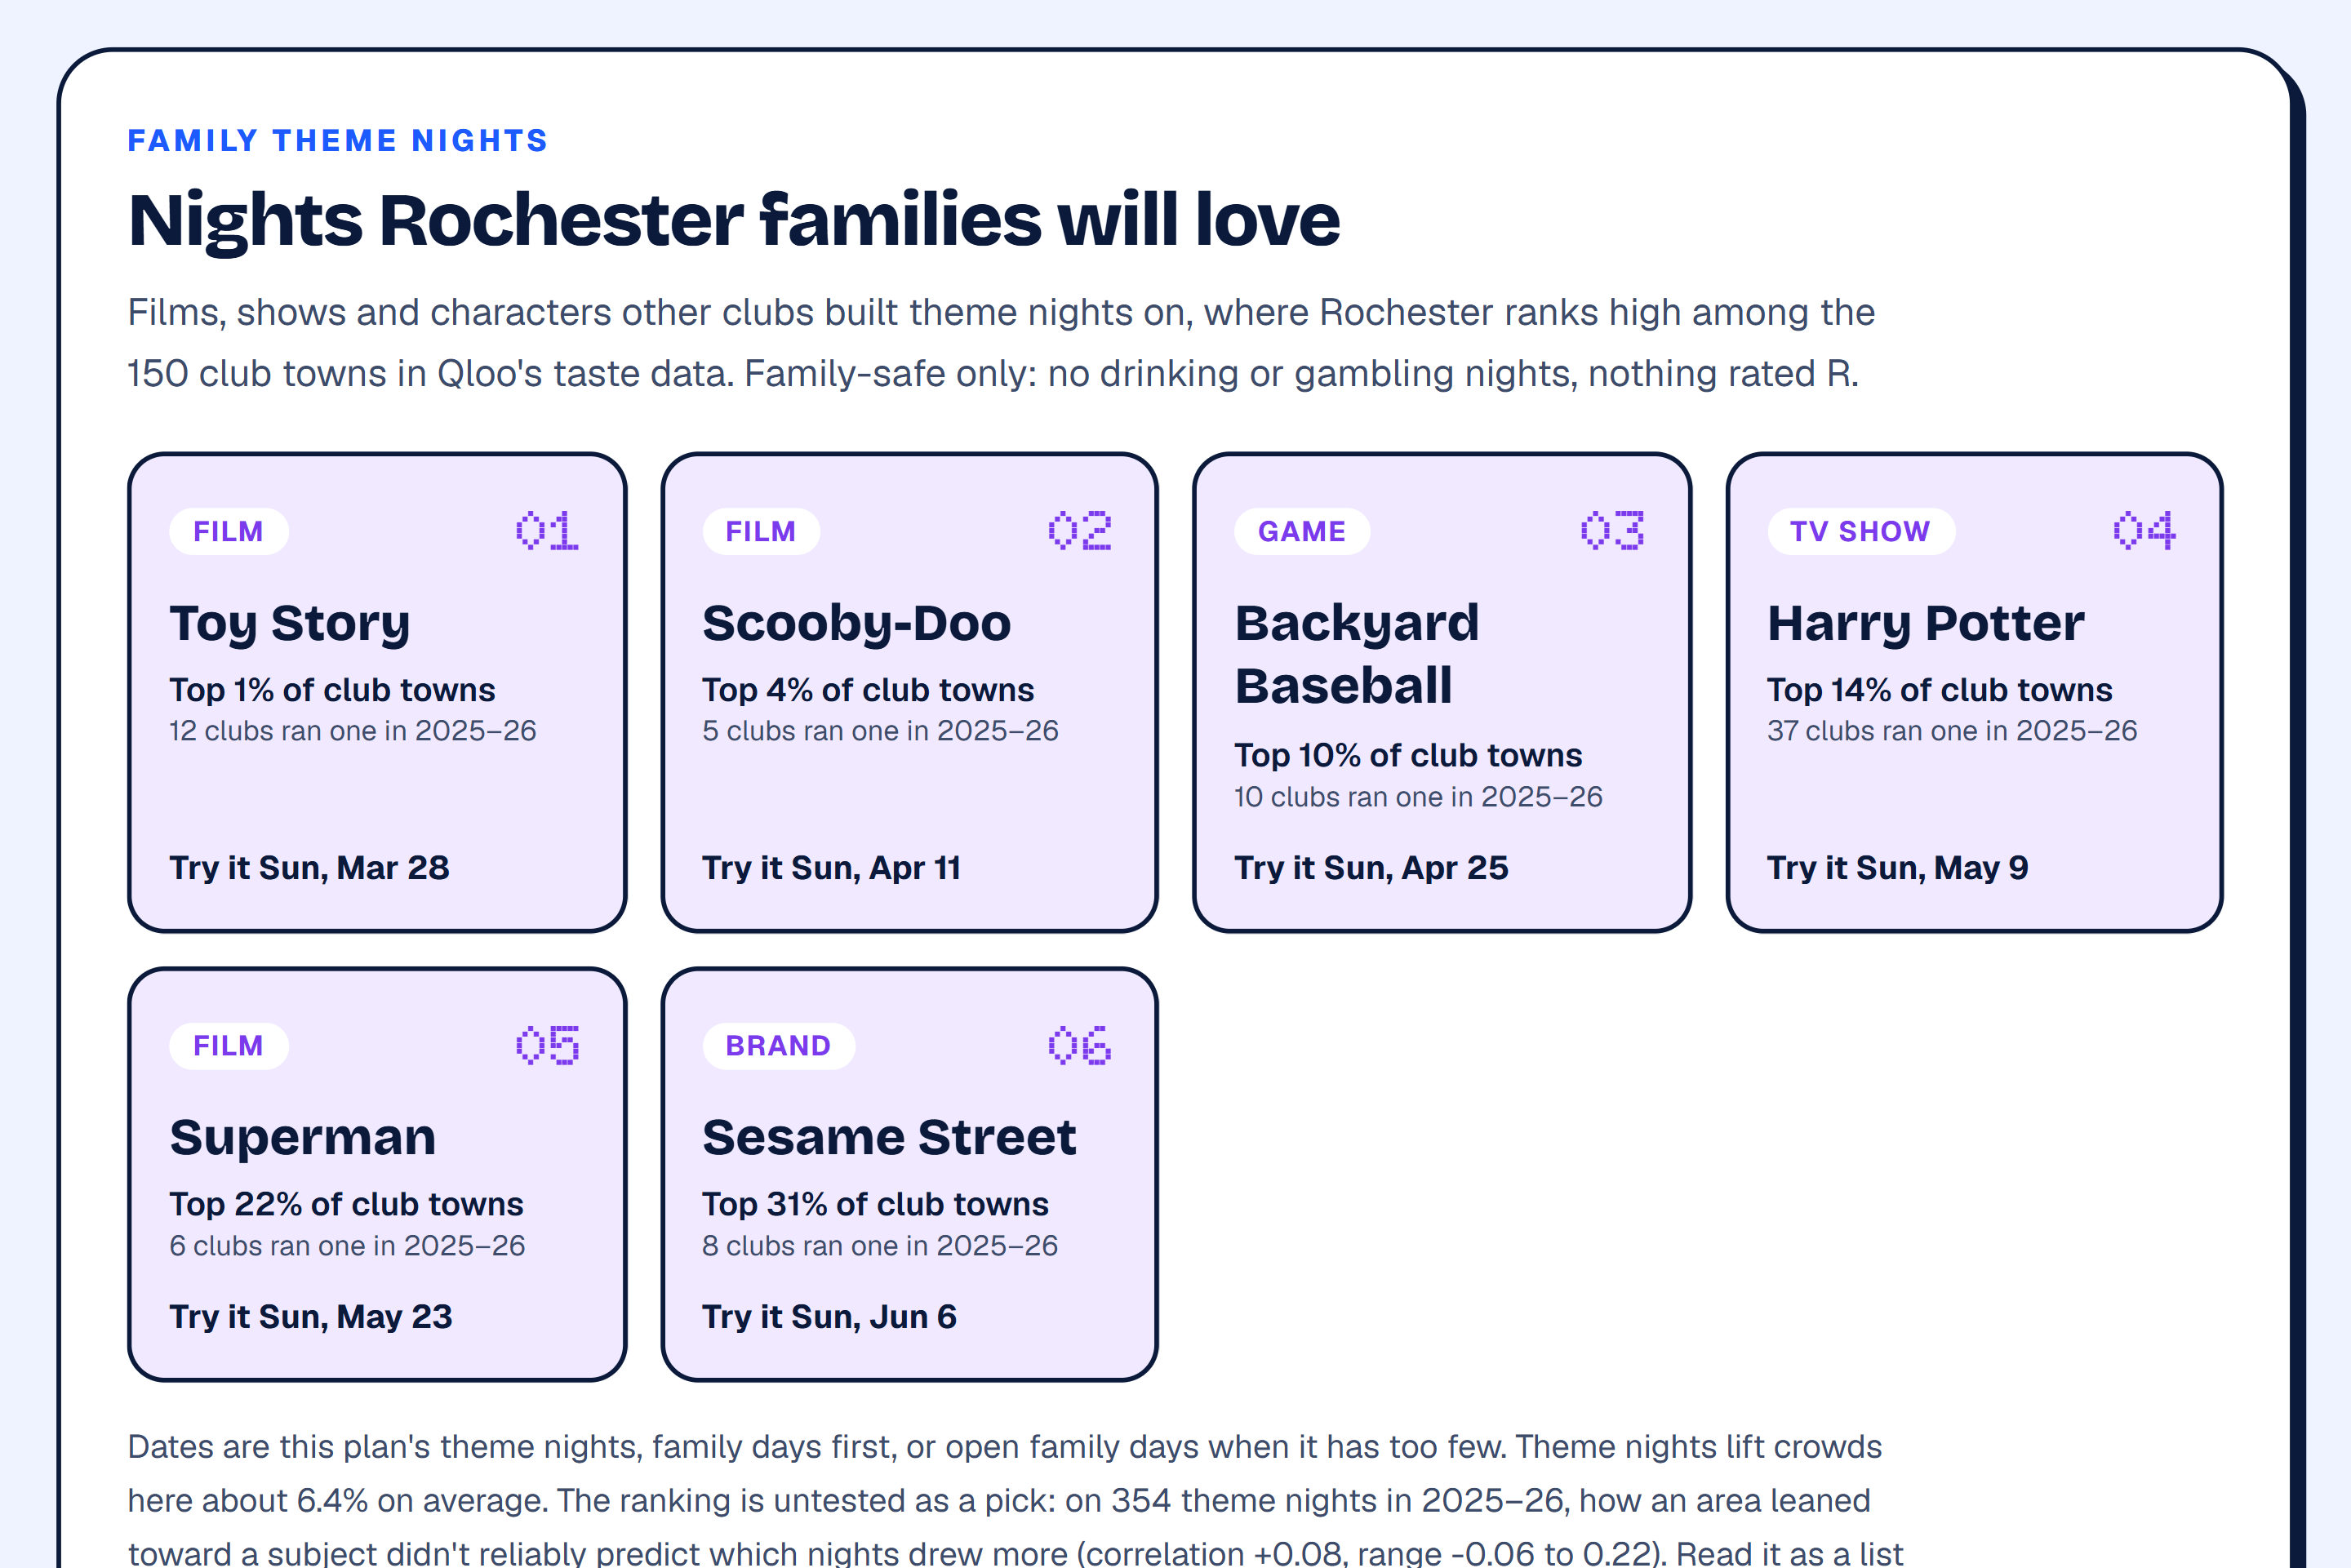
It suggests family theme nights the club's own town is likely to love. 124 of the 150 clubs ran a Star Wars night in 2026, so instead of copying the obvious, the desk takes the 26 family-safe subjects clubs actually built nights on (Toy Story, Bluey, Harry Potter, Sesame Street, PAW Patrol and others) and ranks them by how the area around this ballpark leans toward each compared with every other club town. For Rochester that puts Toy Story first: its area is in the top 1% of club towns. Each idea lands on one of the plan's theme nights or an open family Sunday. Nothing is ever about drinking, gambling or tobacco, and nothing is rated R.
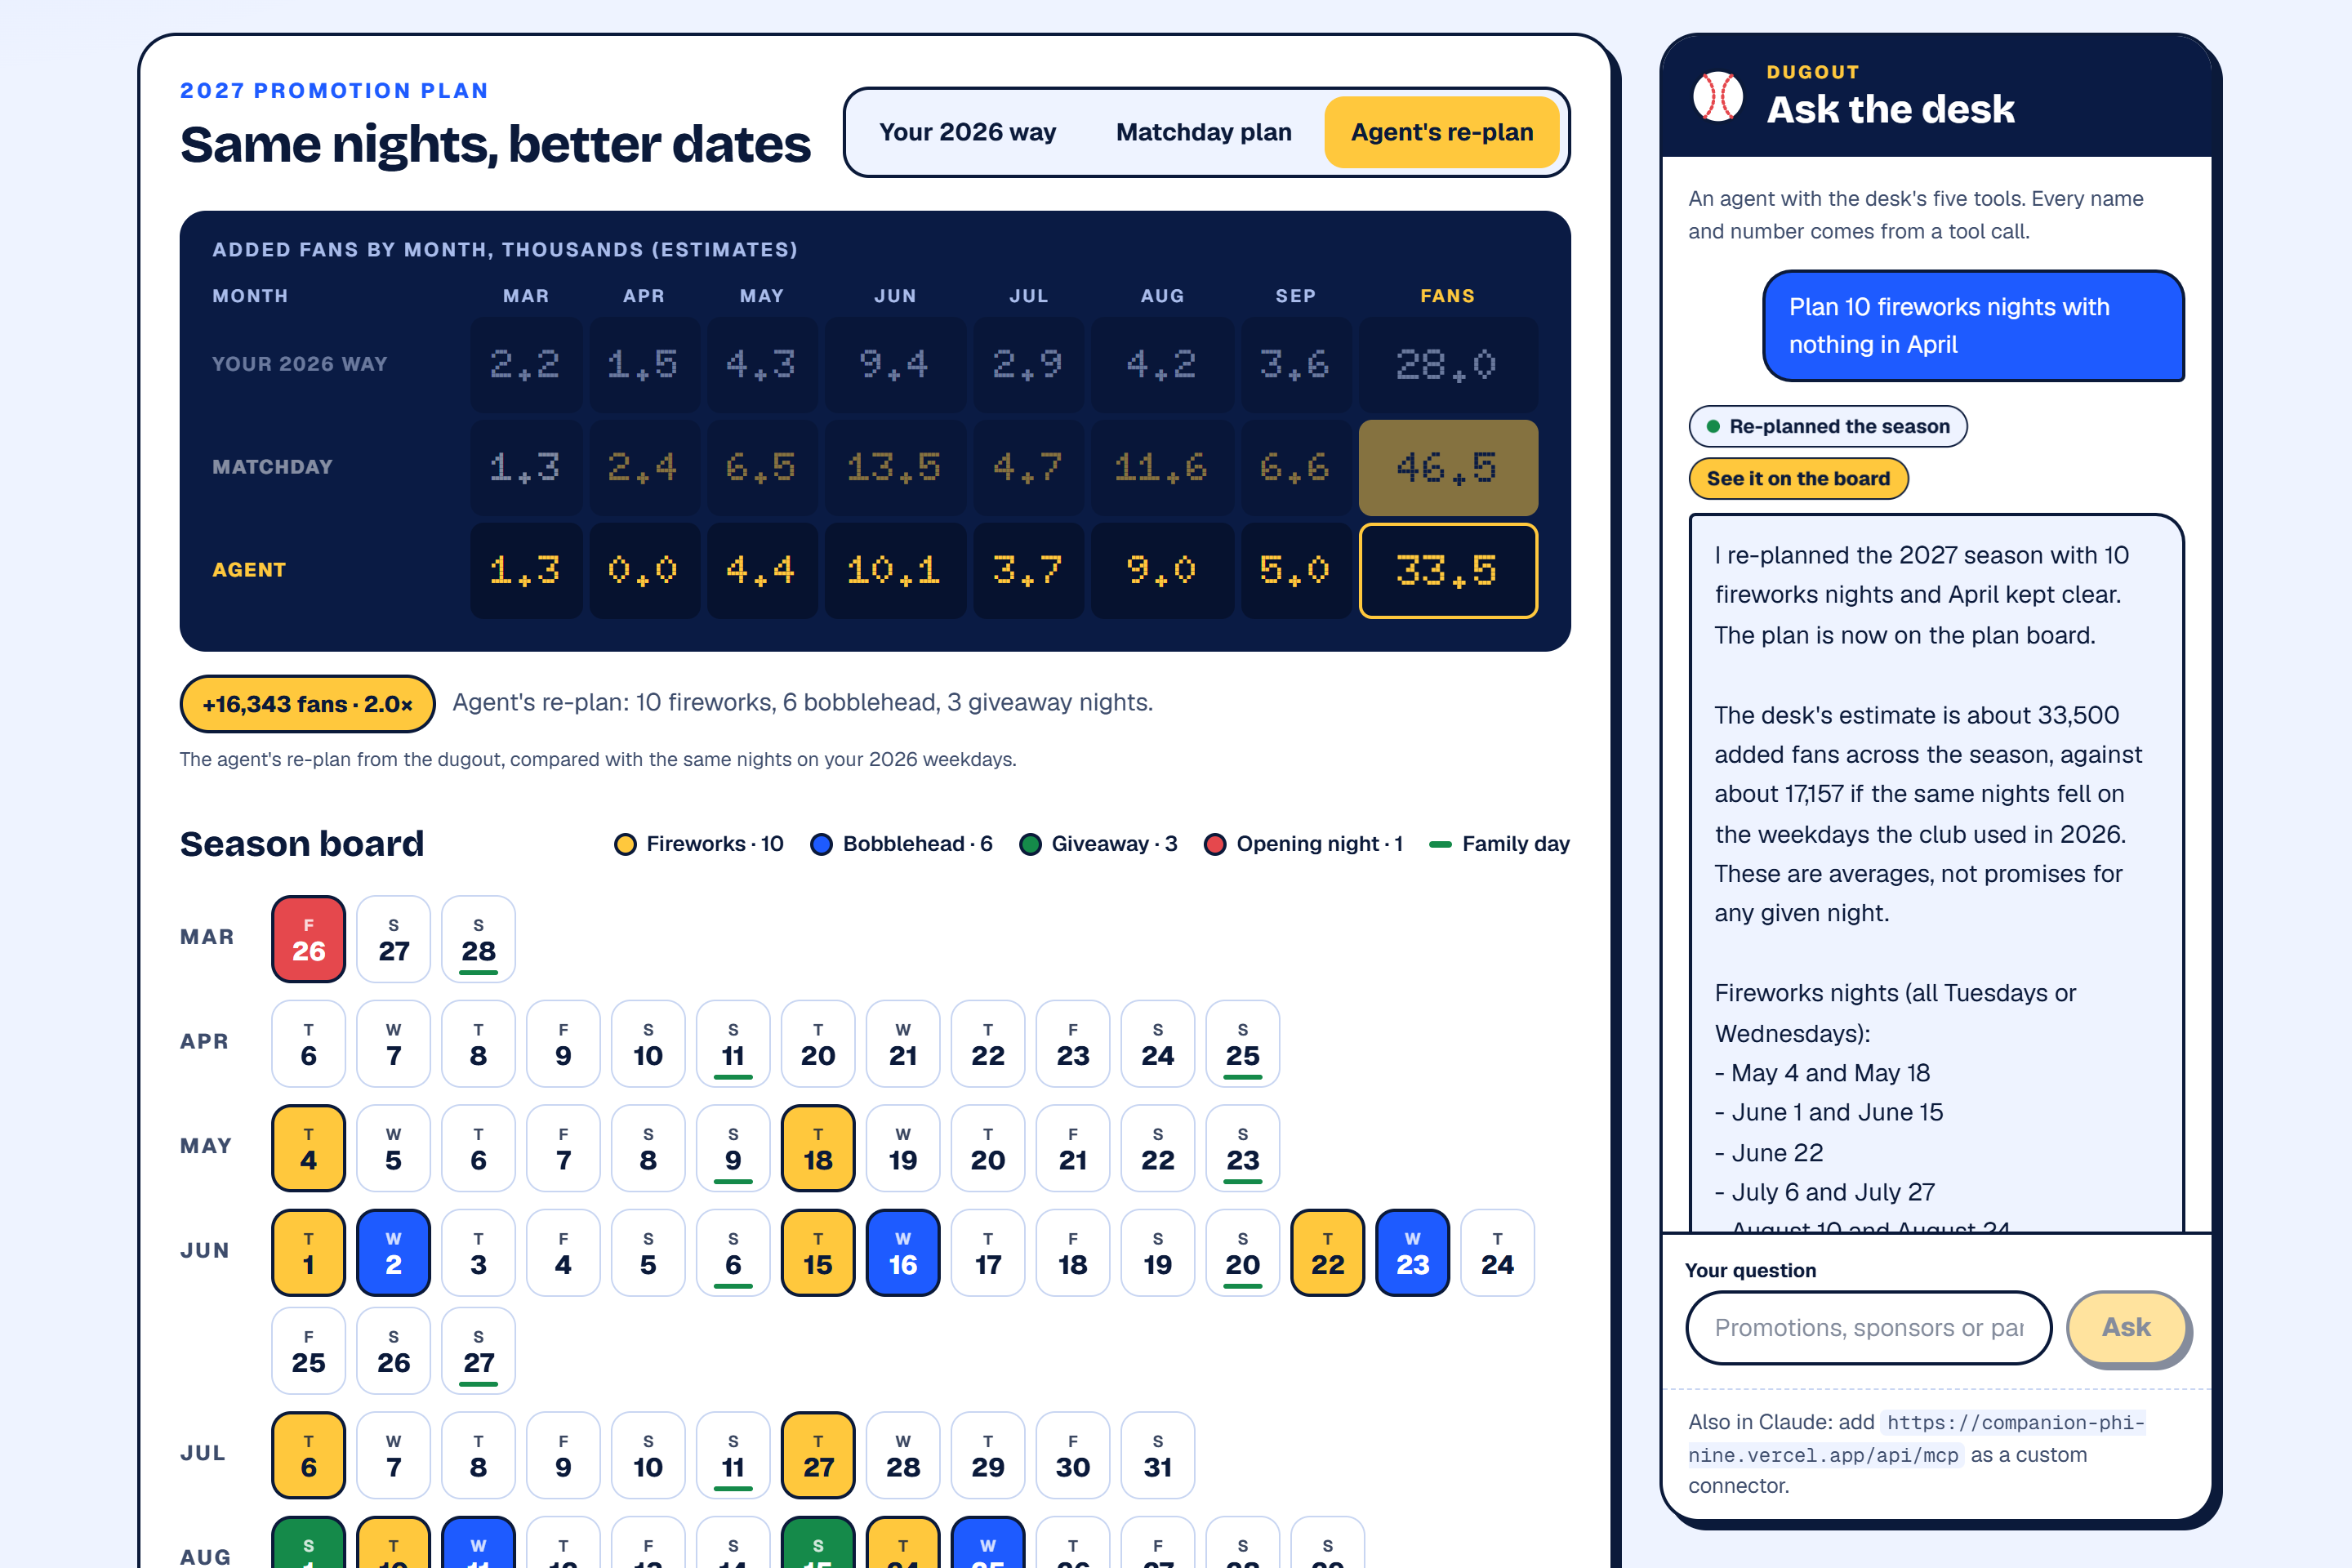
"Ask the desk" is an agent with the desk's seven tools. Ask it to "plan 10 fireworks nights with nothing in April" and it re-plans the season and puts the result on the board as a third view beside the club's way and the Matchday plan. Ask "would a Bluey night work in Rochester?" and it asks Qloo live, checks the show is family-safe, and answers honestly: Bluey is rated TV-Y, but about 92% of club towns lean toward it more than Rochester does. It also filters sponsors and drafts pitches. The same tools work inside Claude as an MCP connector, with no sign-in.
How I built it
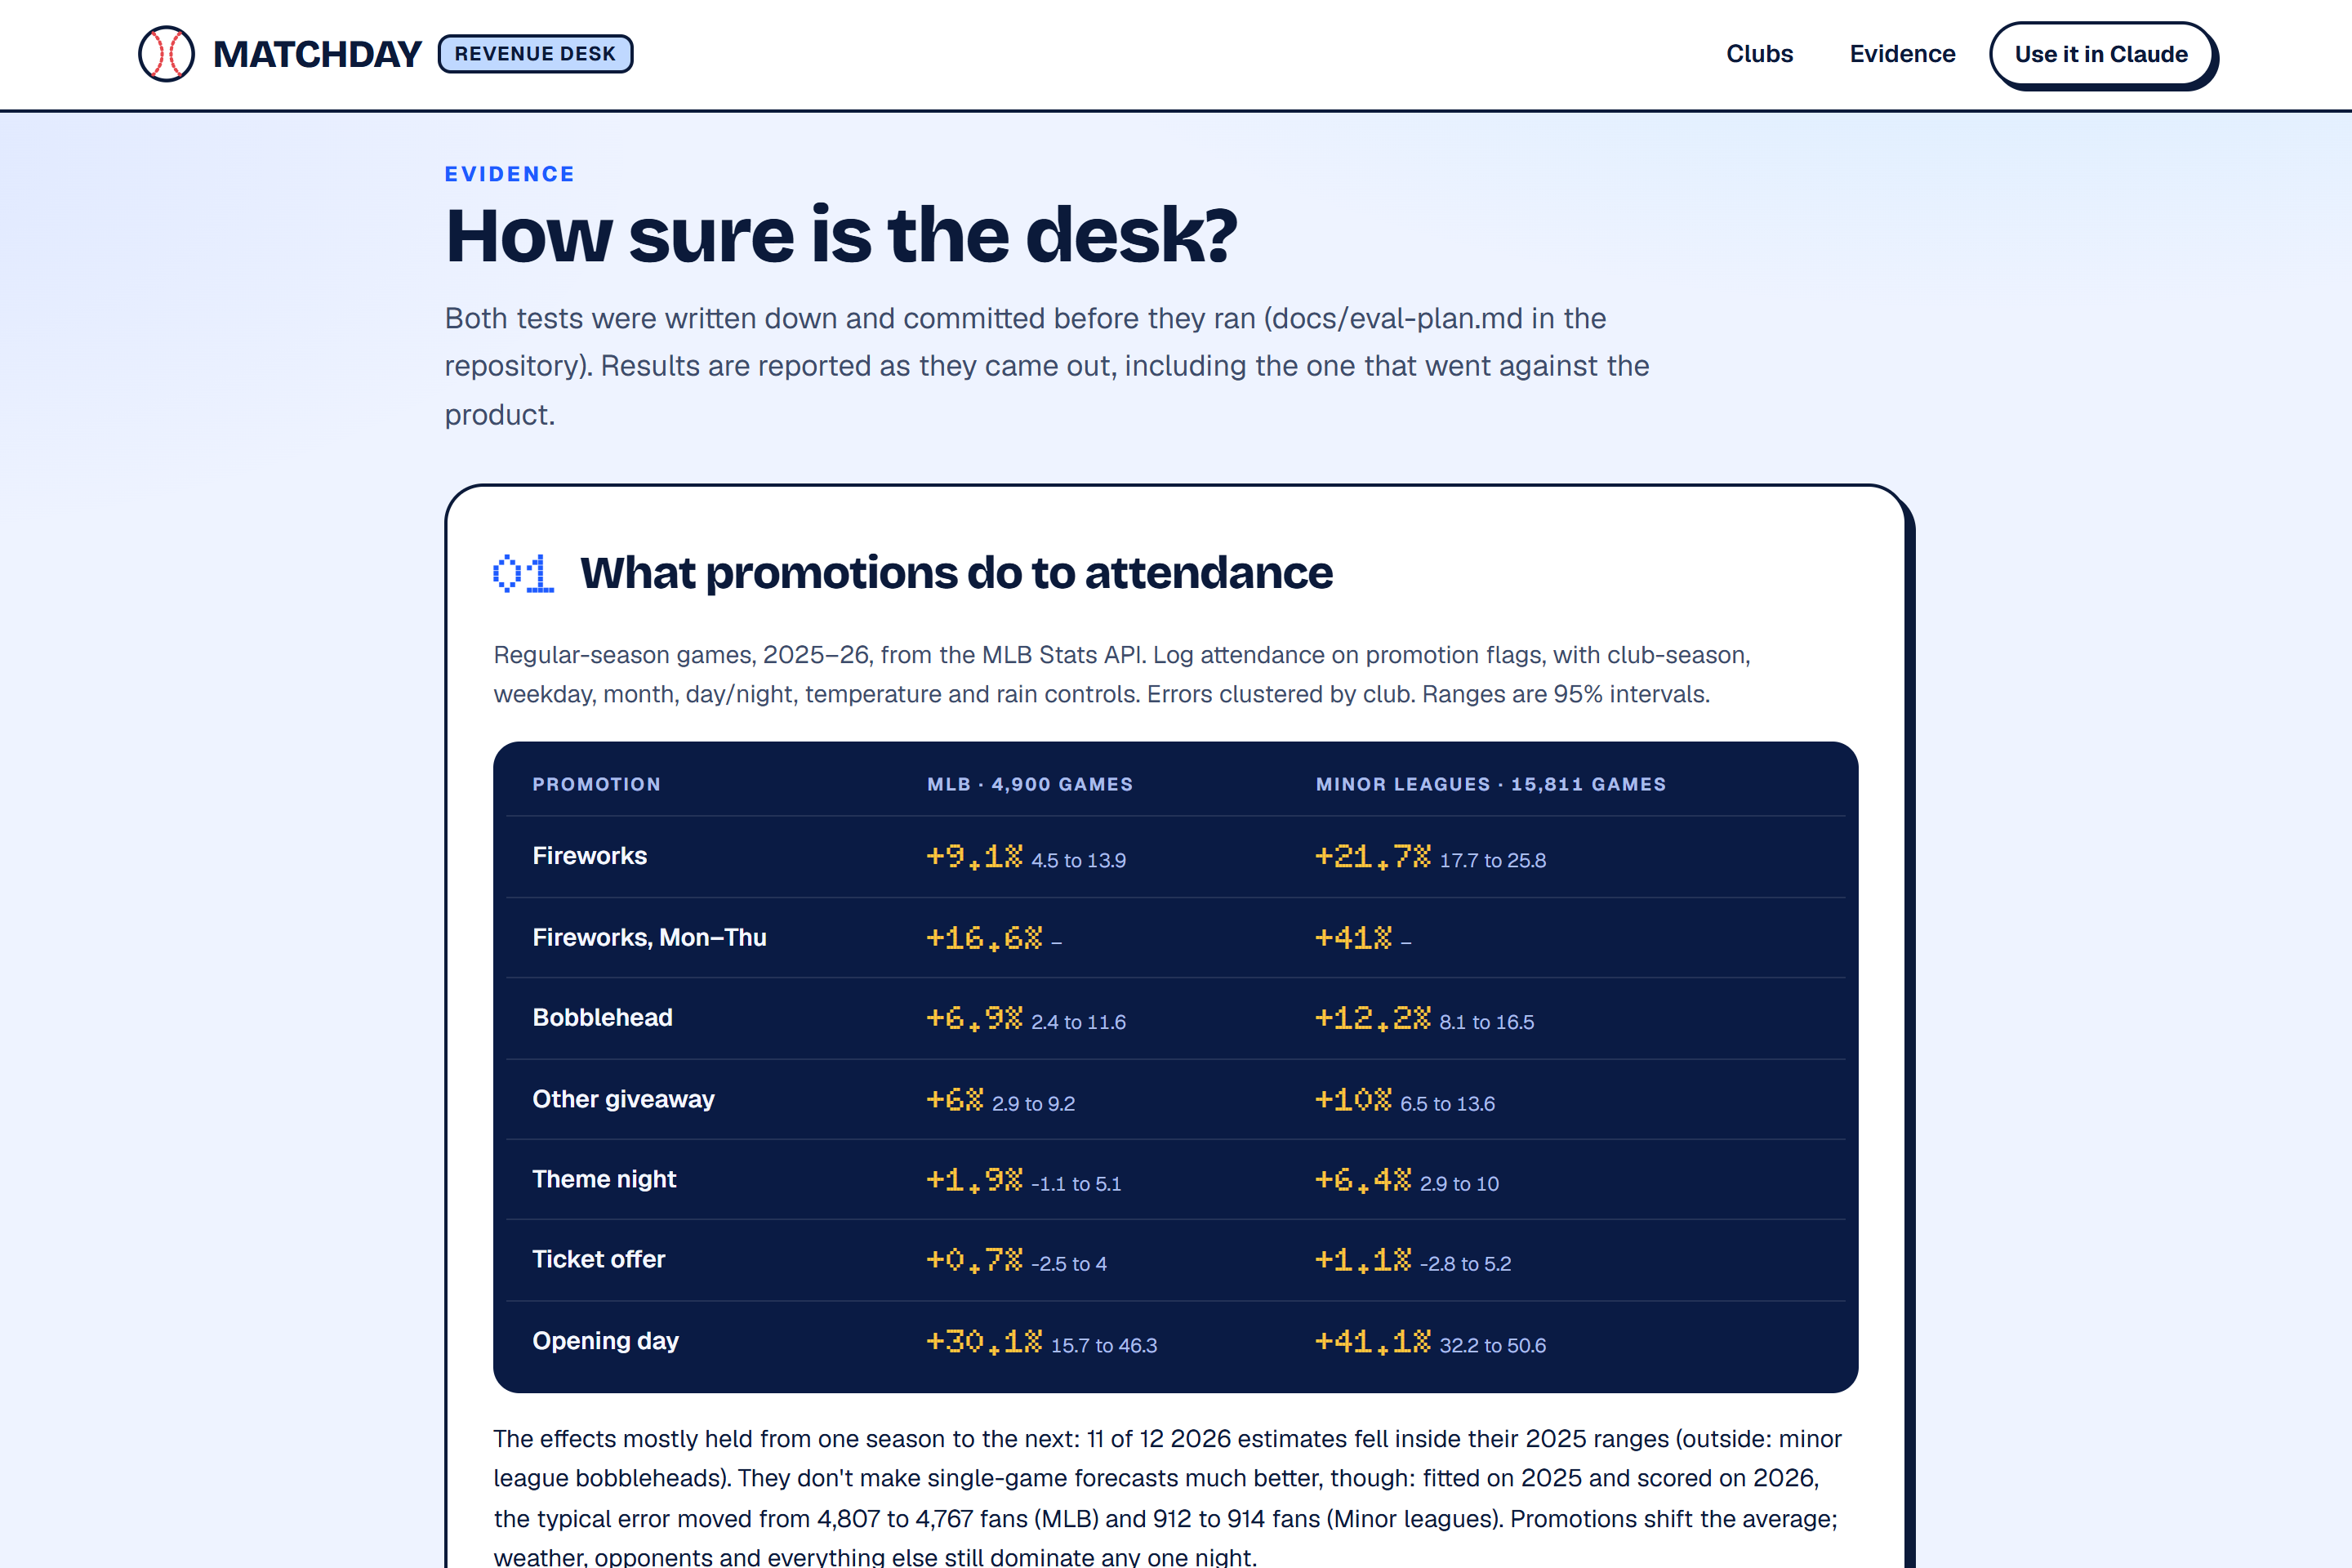
The attendance side comes from the MLB Stats API: every regular-season MLB and Minor League game of 2025 and 2026, 20,711 games with attendance, promotions, weather and start times. I regressed log attendance on promotion flags with club-season, weekday, month, day/night, temperature and rain controls, with errors clustered by club. Fireworks add about 22% in the minors and 9% in MLB, and midweek fireworks about 41% in the minors. The planner places each promotion where that lift adds the most fans, with minimum gaps between nights of one kind.
The taste side is Qloo. Each club is resolved to its own Qloo entity with /search, accepted only on an exact name match. Two brand pools of 300 come from /v2/insights for each club: one with the city as the location signal, and one adding the club itself as an interest signal. A brand's rank in this city against its rank in the other club cities gives its local lift, which becomes the card's rarity. The partner map is a place query within 3 km of the ballpark, with the club as the interest signal, filtered to family food and checked against Qloo's opening hours. For theme nights, Claude Haiku 5.5 read all 2,523 theme-night names from 2025 and 2026 for the pop-culture subject each was built on and whether it suits all ages. Each subject was resolved with /search, and one national Qloo heatmap per subject gives the popularity-weighted lean of the area within 60 km of every ballpark. The agent's live theme check runs the same heatmap for any subject someone names.
All of it is precomputed per club and loaded into Neon Postgres, so the app never waits on an API call. The app is Next.js 16 on Vercel. The agent runs on the Vercel AI SDK with Claude Haiku 5.5 through the AI Gateway, and the same tool registry is served as a stateless MCP endpoint. Both evaluations were written down and committed in the repository before they ran.
Built in coordination with an AI coding assistant, Claude Code.
Challenges I ran into
The pre-registered sponsor test failed. Against 3,065 real presenting sponsors from 114 clubs' 2026 promotions, the Qloo ranking found 136 and an assistant alone found 248. The Qloo ranking did beat a placebo (another club's city) by 105, so the taste signal is real. But most real sponsors are local banks, hospitals and car dealers, which an assistant can name and a taste graph doesn't cover. Instead of hiding that, I wrote down a hybrid test first and ran it on a different season: the assistant's top 150 plus the Qloo top 150 found 262 of the 2025 sponsors against 233 for the assistant alone. That is why the sponsor board shows both lists.
The comparison had to be fair. An early version compared the Matchday plan with a club record that had fewer nights, which made the gain look like 2.8 times. With exactly the same nights on both sides it is 1.7 times, and that is the number on the page. Fireworks also kept landing on minor league Sundays, which are mostly day games, so the planner now reads each club's day/night history before placing them.
I also tested the theme nights before trusting them, with the test written down first. Across 354 theme nights on 26 subjects, I asked whether a night drew more where the area leaned toward its subject, comparing each subject only with itself across towns. The Qloo score pointed the right way and edged out an AI assistant's ratings, but neither result was strong enough to rule out chance, and single nights proved very noisy. So every club page says the theme ranking is untested and offers it as a list of what the town likes, not a forecast. Qloo's location-based scores also covered only a quarter of the subject-town pairs, which I found before looking at any outcome; I added the heatmap method in writing at that point. Brand safety was harder than a keyword list, because names like "Labatt Blue" don't say beer, so a model reads every club's list once and flags alcohol, gambling, tobacco and cannabis brands before they reach the board.
Accomplishments that I'm proud of
Every number on the page traces back to a tool call, a cached Qloo result or a committed test, and the Evidence page reports the results that went against the product next to the ones that went for it. The desk is also built to be good for the people at the ballpark: family nights, family restaurants instead of bars, and no drinking or gambling promotions anywhere. A promotions manager can check the season plan in one look: the same nights, with only the dates changed.
What I learned
Qloo is strongest where taste really decides: which national brands a city overindexes on, and which places a club's fans favour. Real sponsorship is mostly local relationships, so the useful product combines measured taste with what an assistant knows, and says which is which.
What's next
I want to pull each club's 2027 start times once they're published, let a club upload its own sponsor history to rank prospects against, and replace attendance with ticket revenue where a club can share it.
Built With
- claude
- mlb-stats-api
- model-context-protocol
- neon
- next.js
- pandas
- postgresql
- python
- qloo
- react
- statsmodels
- tailwindcss
- typescript
- vercel
- vercel-ai-gateway
- vercel-ai-sdk
- vitest

Log in or sign up for Devpost to join the conversation.